. 2025 Mar 9;15(3):e70867.
doi: 10.1002/ece3.70867. eCollection 2025 Mar.

Multiple Pathways of Visual Adaptations for Water Column Usage in an Antarctic Adaptive Radiation

Affiliations

Multiple Pathways of Visual Adaptations for Water Column Usage in an Antarctic Adaptive Radiation

Ella B Yoder et al. Ecol Evol. .

Abstract

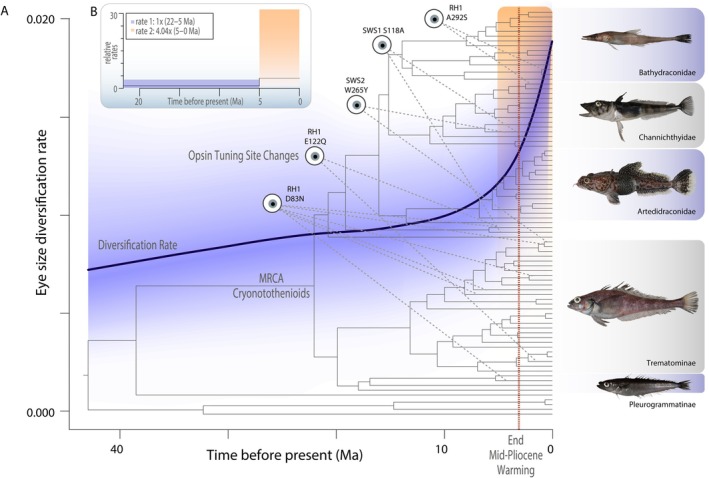
Evolutionary transitions in water column usage have played a major role in shaping ray-finned fish diversity. However, the extent to which vision-associated trait complexity and water column usage is coupled remains unclear. Here we investigated the relationship between depth niche, eye size, and the molecular basis of light detection across the Antarctic notothenioid adaptive radiation. Integrating a phylogenetic comparative framework with data on eye size and depth occupancy, we provide support for an acceleration in the rate of eye size diversification nearly 20 million years after the initial radiation. Our results further reveal that levels of eye size divergence are often highest between closely related taxa. We further analyzed opsin tuning site sequences and found changes representing repeated instances of independent tuning site changes across the notothenioid phylogeny that are generally not associated with habitat depth or species eye size. Collectively, our results strongly support that multiple evolutionary pathways underlie the diversification of visual adaptations in this iconic adaptive radiation.

Keywords: icefish; notothenioids; opsin; tuning site.


Conflict of interest statement

The authors declare no conflicts of interest.

Figures

FIGURE 1
FIGURE 1
Visualization of variation in mean depth and eye size across the cryonotothenioid phylogeny. Shown on the left panel is a time‐calibrated tree depicting phylogenetic relationships among cryonotothenioid species sampled in our morphological dataset. The middle panel depicts average depth per species, with darker shadings corresponding to deeper depths. The right panel depicts a barplot of eye size (represented as residuals from the regression of eye diameter on SL) measured for our focal cryonotothenioid species with warm colors representing larger eyes relative to head size. Fish images: EP.
FIGURE 2
FIGURE 2
Projection of cryonotothenioid phylogeny in space defined by time and eye size. Time (in millions of years) is on the X axis and eye size variability is on the Y axis. Placement of tree tips along the Y axis corresponds to eye size (represented using the residuals from regression of eye diameter on head length) for each cryonotothenioid species. Ancestral state reconstructions of mean depth of occurrence (panel A) and of mean %B (panel B) have been mapped onto the cryonotothenioid phylogeny to facilitate simultaneous visualization of variation in eye size and variation in water column usage.
FIGURE 3
FIGURE 3
Disparity through time (DTT; Harmon et al. 2003) in eye size and ecology over the course of the cryonotothenioid radiation. Panel A depicts patterns of disparity in residual eye size corrected for head length, panel B reflects disparity in mean depth of occurrence, and panel C depicts disparity in mean % buoyancy. In all plots, the X axis reflects relative time since clade origin (0.0). The Y axis corresponds to average relative subclade disparity in eye size. The solid blue line depicts the empirical estimation of eye size disparity, while the dotted gray line depicts the median trait disparity calculated from 10,000 Brownian motion simulations of trait evolution on the cryonotothenioid phylogeny. The shaded gray region represents the 95% confidence interval (CI) of the Brownian motion simulations.
FIGURE 4
FIGURE 4
Punctuated elevation in the diversification of eye size well after the onset of the cryonotothenioid adaptive radiation. (A) The mean rate of eye size diversification (solid line) and confidence interval (blue shading) based on BAMM overlaid on the time calibrated phylogeny of cryonotothenioids and key opsin substitutions discussed in the text (dotted purple lines), revealing a notable increase in eye size diversification coincident with the end of the mid‐Pliocene warming (orange line) that occurred after the initial Antarctic radiation (gray text; Daane et al. ; Near et al. 2012). (B) Relative rates of residual eye size diversification across 5 million year time slices estimated by motmot. Tall light shaded box in B corresponds to the light shaded box in A. Photos: EP.
FIGURE 5
FIGURE 5
Evolution of opsin tuning site replacements in cryonotothenioids. Maximum likelihood topology of opsin sequences (left) with tuning site replacements indicated in the shaded grids. Clades identity is indicated on the phylogeny and cryonotothenoids are indicated by the gray gradient box and blue shading on the phylogeny. Blue boxes indicate the presence of a substitution and purple boxes indicate alternate substitutions (see supplemental materials). Other nototheniods are indicated on the phylogeny in yellow, other teleost outgroups in gray. Text near the shaded boxes indicates AA replacement (i.e., W265Y). Names on the right provide sequence accession numbers and genus/species codes. Genus, species, and common names are provided in Table S2.

References

    1. Abrams, P. A. 2014. “How Precautionary Is the Policy Governing the Ross Sea Antarctic Toothfish (Dissostichus Mawsoni) Fishery?” Antarctic Science 26, no. 1: 3–14.
    1. Alfaro, M. E. , Bolnick D. I., and Wainwright P. C.. 2005. “Evolutionary Consequences of Many‐To‐One Mapping of Jaw Morphology to Mechanics in Labrid Fishes.” American Naturalist 165, no. 6: E140–E154. - PubMed
    1. Balguerias, E. 2000. “Changes in Biomass of Eight Species of Finfish Around the South Orkney Islands (Subarea 48.2) From Three Bottom Trawl Surveys.” CCAMLR Science 7: 53–74.
    1. Benjamini, Y. , and Hochberg Y.. 1995. “Controlling the False Discovery Rate: A Practical and Powerful Approach to Multiple Testing.” Journal of the Royal Statistical Society 57, no. 1: 289–300.
    1. Berner, D. 2011. “Size Correction in Biology: How Reliable Are Approaches Based on (Common) Principal Component Analysis?” Oecologia 166, no. 4: 961–971. - PubMed

LinkOut - more resources