. 2025 Aug;19(8):2212-2232.
doi: 10.1002/1878-0261.70014. Epub 2025 Mar 11.

The atypical KRASQ22K mutation directs TGF-β response towards partial epithelial-to-mesenchymal transition in patient-derived colorectal cancer tumoroids

Affiliations

The atypical KRASQ22K mutation directs TGF-β response towards partial epithelial-to-mesenchymal transition in patient-derived colorectal cancer tumoroids

Theresia Mair et al. Mol Oncol. 2025 Aug.

Abstract

Transforming growth factor beta (TGF-β) exhibits complex and context-dependent cellular responses. While it mostly induces tumor-suppressive effects in early stages of tumorigenesis, tumor-promoting properties are evident in advanced disease. This TGF-β duality is still not fully understood, and whether TGF-β supports invasion and metastasis by influencing cancer cells directly, or rather through the stromal tumor compartment, remains a matter of debate. Here, we utilized a library of colorectal cancer (CRC) patient-derived tumoroids (PDTs), representing a spectrum of tumor stages, to study cancer cell-specific responses to TGF-β. Using conditions allowing for the differentiation of PDTs, we observed TGF-β-induced tumor-suppressive effects in early-stage tumoroids, whereas more advanced tumoroids were less sensitive to the treatment. Notably, one tumoroid line harboring an atypical KRASQ22K mutation underwent partial epithelial-to-mesenchymal transition (EMT), which was associated with morphological changes and increased invasiveness. On a molecular level, this was accompanied by elevated expression of mesenchymal genes, as well as deregulation of pathways associated with matrix remodeling and cell adhesion. Our results suggest that tumor cell-intrinsic responses to TGF-β are critical in determining its tumor-suppressive or tumor-promoting effects.

Keywords: EMT; KRAS mutations; TGF‐β; colorectal cancer; organoids; patient‐derived tumoroids.


Conflict of interest statement

The authors declare no conflict of interest.

Figures

Fig. 1
Fig. 1
Molecular and phenotypic characteristics of colorectal cancer (CRC) patient‐derived tumoroid (PDT) lines. (A) Demographic table of different PDT lines used in this study, including patient age in years (y), gender (m: male; f: female), tumor location, TNM classification, microsatellite status (MSI, microsatellite instable; MSS, microsatellite stable), and driver gene mutations. The colors in the first row of the table group PDTs in four different classes. Green: SMAD4 wild‐type, primary tumor PDTs; blue: SMAD4 mutated, primary tumor PDTs; purple: MSI, primary tumor PDTs; yellow: colorectal liver metastasis (CRLM) PDTs. (B) Histo‐morphological analysis of PDT lines compared to their tumors of origin. Hematoxylin and eosin (H&E) staining of formalin‐fixed paraffin‐embedded (FFPE) sections of original tumor tissues (left) compared to PDT lines cultured for 7 days in ENAS medium (middle). Bright‐field microscopic images of PDT lines cultivated for 7 days in ENAS medium (right). Scale bars: 50 μm. PDTs in B are grouped, and color coded as described in A.
Fig. 2
Fig. 2
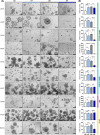
TGF‐β1 treatment induces different responses in individual patient‐derived tumoroids (PDTs). (A) Representative bright‐field microscopic images of different PDT lines cultured in different media conditions for 10 days, ES: ENAS + solvent (white); ET: ENAS + 5 ng·mL−1 TGF‐β1 (light blue), BS: basal medium + solvent (gray); BT: basal medium + 5 ng·mL−1 TGF‐β1 (dark blue) (n = 2). Scale bar: 200 μm. PDTs are grouped into four different classes indicated at the right in different colors. Green: SMAD4 wild‐type, primary tumor PDTs; blue: SMAD4 mutated, primary tumor PDTs; purple: microsatellite instable (MSI), primary tumor PDTs; yellow: colorectal liver metastasis (CRLM) PDTs. (B) Cell viability of PDTs in different media conditions as in (A) measured with CellTiter‐Glo® 3D Cell Viability Assay. Viability is presented as % of viability relative to ES. Graphs show mean and standard deviation (SD) from three technical replicates of two individual experiments (n = 2). Statistical significance was calculated with graphpad prism version 8 using ordinary one‐way ANOVA followed by Tukey's multiple comparison test with 95% confidence interval: ns P > 0.05; *P ≤ 0.05; **P ≤ 0.01; ***P ≤ 0.001; ****P ≤ 0.0001.
Fig. 3
Fig. 3
TGF‐β1 induces different signaling pathways in insensitive and sensitive patient‐derived tumoroids (PDTs). (A) Representative bright‐field microscopic images of SMAD4 wild‐type PDT lines (PDT1,4,5: primary PDTs; PDT9,10: colorectal liver metastasis (CRLM) PDTs) cultured in different conditions for 5 days (n = 2). ES: ENAS + solvent; BS: basal medium + solvent; BT: basal medium + 5 ng·mL−1 TGF‐β1. Scale bar: 200 μm. (B) Western blot analysis of PDTs treated as in (A) for phospho‐SMAD2 (p‐SMAD2) (60 KDa), phospho‐SMAD1/3 (p‐SMAD1/3) (60 kDa, 52 kDa), total SMAD2/3 (60 kDa, 52 kDa), phospho‐ERK1/2 (p‐ERK1/2) (44 kDa, 42 kDa), total ERK1/2 (44 kDa, 42 kDa), BIMEL (23 kDa), Bcl‐xL (30 kDa) and β‐tubulin (55 kDa) as loading control (n = 2).
Fig. 4
Fig. 4
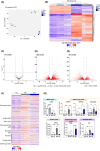
Gene expression analysis reveals differentiation of patient‐derived tumoroids (PDTs) to specific cell types of the colon crypt in basal medium. (A) Principal component analysis (PCA) of RNA sequencing data of PDT1 cultured in different conditions based on variance stabilizing transformation (VST) read counts (n = 3). Colors indicate different conditions: white = ES: ENAS + solvent; light blue = ET: ENAS + 5 ng·mL−1 TGF‐β1; gray = BS: basal medium + solvent; dark blue = BT: basal medium + 5 ng·mL−1 TGF‐β1. (B) Dendrogram and heatmap showing unsupervised hierarchical clustering of the top 1000 variable expressed genes using normalized read counts (VST transformed counts in DESeq2) of PDT1 cultured as in (A) (n = 3). Columns represent individual samples (color coded as in A), rows represent individual genes. The color gradient on the bottom shows VST normalized counts, with blue indicating below‐average gene expression and red indicating above‐average expression. (C–E) Volcano plots of significant differentially expressed genes between different media conditions as in (A) (n = 3). Significantly deregulated genes are indicated in red with Padj < 0.05 and Log2 fold change (LFC) > 1 or < −1. Genes below this significance threshold are indicated in gray (Padj > 0.05. LFC < 1 and > −1), green (Padj > 0.05. LFC > 1 or < −1), and blue (Padj < 0.05. LFC < 1 and > −1). (F) Heatmap showing VST gene count values of PDT1 in different conditions (ES, BS, BT) for colon crypt cell type‐associated genes inferred from [33] (https://panglaodb.se/) (n = 3). Cell types are ordered according to their frequency in the colon crypt. Red indicates upregulation, blue downregulation. (G) Gene expression analysis of indicated cell type‐associated genes in different conditions as in (A) quantified by qRT‐PCR. Data are represented as expression relative to TATA‐Box Binding Protein (TBP) as housekeeping gene. Bar graphs show mean and standard deviation (SD) of three independent experiments, whereby each dot represents the mean of three technical replicates (n = 3). Statistical significance was calculated using graphpad prism version 8 with ordinary one‐way ANOVA followed by Tukey's multiple comparison test with 95% confidence interval: ns P > 0.05; *P ≤ 0.05; **P ≤ 0.01; ***P ≤ 0.001; ****P ≤ 0.0001.
Fig. 5
Fig. 5
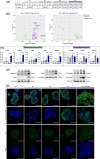
TGF‐β1 treatment of patient‐derived tumoroid 1 (PDT1) promotes differentiation towards a mesenchymal phenotype. (A) Prediction of the consensus molecular subtypes (CMS) of PDT1 cultured in different medium compositions (ES: ENAS + solvent; ET: ENAS + 5 ng·mL−1 TGF‐β1, BS: basal medium + solvent; BT: basal medium + 5 ng·mL−1 TGF‐β1) from RNA sequencing data (n = 3) using the CMS caller tool [34]. The predicted CMS is indicated in the first row as NP: no prediction, CMS2, CMS3 or CMS4 for each sample. The second row shows the P‐values for each prediction. (B) Overlap of differentially expressed genes of PDT1 cultivated for 10 days in different conditions (BS vs ES and BT vs BS) with cancer cell‐specific epithelial‐to‐mesenchymal transition (EMT) signatures [35] (n = 3). Volcano plot on the left represents BS versus ES, plot on the right represents BT versus BS. Epithelial genes are represented in purple and mesenchymal genes in green. (C) Gene expression analysis of mesenchymal genes (left) and epithelial genes (right) using qRT‐PCR of PDT1 cultured in different conditions as in (A). Gene expression of target genes is represented as expression relative to TATA‐Box Binding Protein (TBP) as housekeeping gene. Graphs show the mean and error bars depict standard deviation (SD) from three replicates (n = 3). Statistical significance was calculated using graphpad prism version 8 with ordinary one‐way ANOVA followed by Tukey's multiple comparison test with 95% confidence interval: ns P > 0.05; *P ≤ 0.05; **P ≤ 0.01; ***P ≤ 0.001; ****P ≤ 0.0001. (D) Representative western blot analysis of selected mesenchymal (fibronectin, fascin, Slug) or epithelial (E‐cadherin, keratin 20) marker proteins isolated from PDT1 treated as in (A) (n = 2). β‐tubulin is used as loading control. (E) Whole‐mount immunofluorescence staining and confocal microscopy of PDT1 cultured in different conditions as in (A) (n = 2). The top panel shows staining with antibodies against E‐cadherin as epithelial marker (green) and Ki67 as a marker for proliferative cells (red). Nuclei were counterstained with DAPI (blue). The second panel shows staining with antibodies against fibronectin as mesenchymal marker (green), and DAPI counterstain of nuclei (blue). The bottom panel shows antibody staining for Slug (green) and separate nuclear DAPI staining (blue). Scale bar: 100 μm.
Fig. 6
Fig. 6
TGF‐β1 induces invasive properties in patient‐derived tumoroid 1 (PDT1). (A) Bar chart representing the top significantly enriched pathways in BT (basal medium + TGF‐β1) versus BS (basal medium + solvent) conditions, based on Reactome pathway analysis of significantly upregulated genes (Padj < 0.05 and log2 fold change (LFC) > 1) from RNA sequencing analysis between the two conditions (n = 3). X‐axis represents the counts of individual genes upregulated in the respective pathway. Color gradient indicates significance of the enriched pathway based on Padj. (B) CNET (Gene‐Concept Network)‐plot representing connections of genes among the five top‐ enriched Reactome pathways (according to Padj) from (A). Circle size indicates gene count for each pathway. Dot color for each gene indicates LFC of the gene according to the color gradient. (C) qRT‐PCR analysis of genes associated with invasion (L1CAM, MMP14, ITGA5) relative to the reference gene TATA‐Box Binding Protein (TBP) of PDT1 cultured in different conditions (ES: ENAS + solvent; ET: ENAS + 5 ng·mL−1 TGF‐β1, BS: basal medium + solvent; BT: basal medium + 5 ng·mL−1 TGF‐β1). Graphs show the mean and standard deviation (SD) from three replicates (n = 3). Statistical significance was calculated with graphpad prism version 8 using ordinary one‐way ANOVA followed by Tukey's multiple comparison test with 95% confidence interval: ns P > 0.05; **P ≤ 0.01; ***P ≤ 0.001; ****P ≤ 0.0001. (D) Representative bright‐field images of trans‐well invasion assays in basal medium + solvent (BS) or in basal medium + 5 ng·mL−1 TGF‐β1 (BT) towards fetal calf serum (FCS) as chemoattractant (n = 3). Invasive cells were visualized by crystal violet staining. Overview (top) and higher magnification image (bottom) are shown. Please note that bottom panels are not enlargements of the top panels. Scale bar: 500 μm (lower panel). Right panel shows quantification of invasive cells, depicted as percent covered area. The graph represents the mean and standard deviation (SD) of three counted areas from two individual experiments per condition (n = 2). Statistical significance was calculated with graphpad prism version 8 using Welch's t‐test: ***P ≤ 0.001.

References

    1. Massagué J, Sheppard D. TGF‐β signaling in health and disease. Cell. 2023;186(19):4007–4037. - PMC - PubMed
    1. Ihara S, Hirata Y, Koike K. TGF‐β in inflammatory bowel disease: a key regulator of immune cells, epithelium, and the intestinal microbiota. J Gastroenterol. 2017;52(7):777–787. - PubMed
    1. Markowitz SD, Bertagnolli MM. Molecular origins of cancer: molecular basis of colorectal cancer. N Engl J Med. 2009;361(25):2449–2460. - PMC - PubMed
    1. Calon A, Lonardo E, Berenguer‐Llergo A, Espinet E, Hernando‐Momblona X, Iglesias M, et al. Stromal gene expression defines poor‐prognosis subtypes in colorectal cancer. Nat Genet. 2015;47(4):320–329. - PubMed
    1. Tauriello DVF, Sancho E, Batlle E. Overcoming TGFβ‐mediated immune evasion in cancer. Nat Rev Cancer. 2022;22(1):25–44. - PubMed

MeSH terms

Substances