. 2025 Feb 27;53(5):gkaf161.
doi: 10.1093/nar/gkaf161.

Eukaryotic initiation factors eIF4F and eIF4B promote translation termination upon closed-loop formation

Affiliations

Eukaryotic initiation factors eIF4F and eIF4B promote translation termination upon closed-loop formation

Ekaterina Shuvalova et al. Nucleic Acids Res. .

Abstract

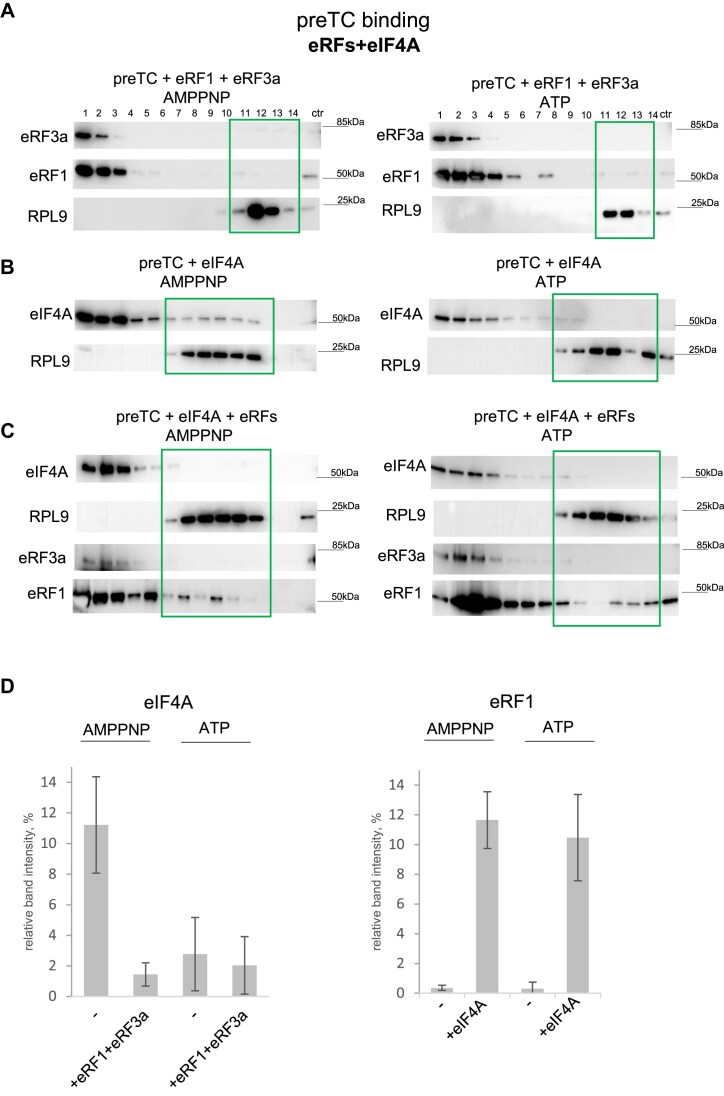
Eukaryotic translation initiation factor 4F (eIF4F), comprising subunits eIF4G, eIF4E, and eIF4A, plays a pivotal role in the 48S preinitiation complex assembly and ribosomal scanning. Additionally, eIF4B enhances the helicase activity of eIF4A. eIF4F also interacts with poly (A)-binding protein (PABP) bound to the poly (A) tail of messenger RNA (mRNA), thereby forming a closed-loop structure. PABP, in turn, interacts with eukaryotic release factor 3 (eRF3), stimulating translation termination. Here, we employed a reconstituted mammalian system to directly demonstrate that eIF4F potently enhances translation termination. Specifically, eIF4A and eIF4B promote the loading of eRF1 into the A site of the ribosome, while eIF4G1 stimulates the GTPase activity of eRF3 and facilitates the dissociation of release factors following peptide release. We also identified MIF4G as the minimal domain required for this activity and showed that eIF4G2/DAP5 can also promote termination. Our findings provide compelling evidence that the closed-loop mRNA structure facilitates translation termination, with PABP and eIF4F directly involved in this process.


Conflict of interest statement

None declared.

Figures

Graphical Abstract
Graphical Abstract
Figure 1.
Figure 1.
Translation termination is stimulated by eIF4F. (A) Rate of peptide release (v0) at Nluc preTC induced by eRF1 and eRF3a (5 nM each) in the presence of various concentrations of eIF4F (left panel) and difference in peptide release rates at selected concentrations: eRFs 5 nM each and eIF4F 5 nM (1:1) (right panel). (B) Rate of peptide release (v0) at Nluc preTC induced by eRF1 (50 nM) in the presence of various concentrations of eIF4F (left panel) and difference in peptide release rates at selected concentrations: eRF1 50 nM and eIF4F 100 nM (1:2) (right panel). RLU, relative luminescent units. (C) Toe-print analysis of TC formation in the reconstituted mammalian translation system in the presence of eRF1 (AGQ) and eIF4F or eIF4G1. ru, relative units. (D) GTPase activity of eRF3a in the presence of various concentrations of eIF4F (left panel) and difference in the amount of the released 32Pi at selected concentrations: eRFs 166 nM each and eIF4F 312 nM (1:1.8) (right panel). The data are shown as the mean ± standard error, number of repeats, n = 3. Asterisks indicate statistically significant differences between the values (*, P < .05; **, P < .01).
Figure 2.
Figure 2.
eIF4G1 and its truncated forms stimulate peptide release and GTPase activity of eRF3. (A) Schematic representation of eIF4G1, eIF4G2, their truncated forms, and domain organization. Regions of interaction with other proteins are indicated. (B) Rates of peptide release (v0) at Nluc preTC induced by eRF1 and eRF3a (5 nM each) in the presence of various concentrations of eIF4G1, p100, and p50 (left panel) and difference in peptide release rates at selected concentrations: eRFs 5 nM each and eIF4G1/p100/p50 50 nM (1:10) (right panel). RLU, relative luminescent units. (C) GTPase activity of eRF3a in the presence of various concentrations of p50 (left panel) and difference in the amount of the released 32Pi at selected concentrations: eRFs 166 nM each and p50 312 nM (1:1.8) (right panel). The data are shown as the mean ± standard error, number of repeats, n = 3. Asterisks indicate statistically significant differences between the values (*, P < .05; **, P < .01).
Figure 3.
Figure 3.
eIF4G2 stimulates translation termination more strongly than the p100 fragment of eIF4G1. (A) Rates of peptide release (v0) at Nluc preTC induced by eRF1 and eRF3a (5 nM each) in the presence of various concentrations of eIF4G2 and p86 (left panel) and difference in peptide release rates at selected concentrations: eRFs 5 nM each, and eIF4G1/p86 50 nM (1:10) (right panel). RLU, relative luminescent units. (B) Nluc release induced by eRF1 and eRF3a in the presence of eIF4G2 and p100 at selected concentrations: eRFs 5 nM each and eIF4G2 and p100 50 nM (1:10) (left panel) and difference in peptide release rates (right panel). RLU, relative luminescent units. (C) Toe-print analysis of TC formation in the reconstituted mammalian translation system in the presence of eRF1 (AGQ) and eIF4G2. ru, relative units. (D) GTPase activity of eRF3a in the presence of various concentrations of eIF4G2 (left panel) and difference in the amount of the released 32Pi at selected concentrations: eRFs 166 nM each and eIF4G2 312 nM (1:1.8) (right panel). The data are shown as the mean ± standard error, number of repeats, n = 3. Asterisks indicate statistically significant differences between the values (*, P < .05; **, P < .01).
Figure 4.
Figure 4.
eIF4A, eIF4E, and eIF4B activities in translation termination. (A) Rates of peptide release (v0) at Nluc preTC induced by eRF1 and eRF3a (5 nM each) in the presence of various concentrations of eIF4A (left panel). eIF4A was pre-incubated with ATP, ADP, AMPPNP, or without a nucleotide. The right panel shows difference in peptide release rates at selected concentrations: eRFs 5 nM each and eIF4A 50 nM (1:10). (B) Rate of peptide release (v0) at Nluc preTC induced by eRF1 (50 nM) in the presence of various concentrations of eIF4A (left panel) and difference in peptide release rates at selected concentrations: eRF1 50 nM and eIF4A 75 nM (1:1.5) (right panel). (C) Rate of peptide release (v0) at Nluc preTC induced by eRF1 and eRF3a (5 nM each) in the presence of various concentrations of eIF4E (left panel) and difference in peptide release rates at selected concentrations: eRFs 5 nM each and eIF4E 50 nM (1:10) (right panel). (D) Rate of peptide release (v0) at Nluc preTC induced by eRF1 and eRF3a (5 nM) in the presence of various concentrations of eIF4B (left panel) and difference in peptide release rates at selected concentrations: eRFs 5 nM each and eIF4B 25 nM (1:5) (right panel). RLU, relative luminescent units. The data are shown as the mean ± standard error, number of repeats, n = 3. Asterisks indicate statistically significant differences between the values (*, P < .05; **, P < .01; n.s., not significant).
Figure 5.
Figure 5.
Influence of reconstituted eIF4F on translation termination. Relative peptide release rates (v0) at Nluc preTC induced by eRFs (8 nM each) in the presence of different combinations of eIF4F complex components eIF4G1, eIF4A, and eIF4E (35 nM each) (A) in the absence of ATP and (B) in the presence of ATP. p100, eIF4A, and eIF4E (20 nM each) (C) in the absence of ATP and (D) in the presence of ATP. (E) Relative peptide release rates (v0) at Nluc preTC induced by eRFs (8 nM each) in the absence and presence of eIF4B (15 nM) and eIF4G1 (35 nM)/eIF4F (5 nM). The data are shown as the mean ± standard error, number of repeats, n = 3. Asterisks indicate statistically significant differences between the values (*, P < .05; **, P < .01).
Figure 6.
Figure 6.
Effect of poly (A) tail, bound with PABP, on the activity of eIF4F components in translation termination. (A) The rates of peptide release (v0) at preTCs assembled on Nluc mRNA without poly (A) tail or with poly (A) tail. Peptide release was induced by eRF1 and eRF3a (8 nM each) in the presence of various concentrations of eIF4G1, eIF4A, eIF4E, and eIF4B. (B) Differences in peptide release rates at selected concentrations: eRFs 8 nM each, eIF4G1, eIF4A, eIF4E, and eIF4B 50 nM (1:6). RLU, relative luminescent units. The data are shown as the mean ± standard error, number of repeats, n = 3. Asterisks indicate statistically significant differences between the values (*, P < .05; **, P < .01; n.s., not significant).
Figure 7.
Figure 7.
eIF4A promotes the loading of eRF1 to the ribosome. (A) Western blot analysis of SDG fractions obtained after incubation of preTC with eRF1 and eRF3a in the presence of ATP or AMPPNP. (B) Western blot analysis of SDG fractions obtained after incubation of preTC with eIF4A in the presence of ATP or AMPPNP. (C) Western blot analysis of SDG fractions obtained after incubation of preTC with eRFs and eIF4A in the presence of ATP or AMPPNP. Fraction numbering: from 1 to 14, from top to bottom of SDG. PreTC-associated fractions are marked with frames. ctr - control recombinant protein. Antibodies raised against the proteins of interest were used. (D) Intensities of eIF4A (left panel) or eRF1 (right panel) bands in preTC-bound fractions relative to total eIF4A or eRF1 on each membrane. Number of repeats: n = 2 (for AMPNP), n = 3 (for ATP).
Figure 8.
Figure 8.
The model of eIF4F functioning in translation termination. The figure is created in BioRender. Alkalaeva, E. (2025) https://BioRender.com/p54r922.

References

    1. Brito Querido J, Díaz-López I, Ramakrishnan V The molecular basis of translation initiation and its regulation in eukaryotes. Nat Rev Mol Cell Biol. 2024; 25:168–86.10.1038/s41580-023-00624-9. - DOI - PubMed
    1. Shirokikh NE, Preiss T Translation initiation by cap-dependent ribosome recruitment: recent insights and open questions. Wiley Interdiscip Rev RNA. 2018; 9:e1473.10.1002/wrna.1473. - DOI - PubMed
    1. Pelletier J, Schmeing TM, Sonenberg N The multifaceted eukaryotic cap structure. Wiley Interdiscip Rev RNA. 2021; 12:e1636.10.1002/wrna.1636. - DOI - PubMed
    1. Kumar P, Hellen CUT, Pestova TV Toward the mechanism of eIF4F-mediated ribosomal attachment to mammalian capped mRNAs. Genes Dev. 2016; 30:1573–88.10.1101/gad.282418.116. - DOI - PMC - PubMed
    1. Grifo JA, Tahara SM, Morgan MA et al. . New initiation factor activity required for globin mRNA translation. J Biol Chem. 1983; 258:5804–10.10.1016/S0021-9258(20)81965-6. - DOI - PubMed

MeSH terms

LinkOut - more resources