. 2025 May 22;145(21):2411-2423.
doi: 10.1182/blood.2024027999.

Clonal hematopoiesis landscape in frequent blood donors

Affiliations

Clonal hematopoiesis landscape in frequent blood donors

Darja Karpova et al. Blood. .

Abstract

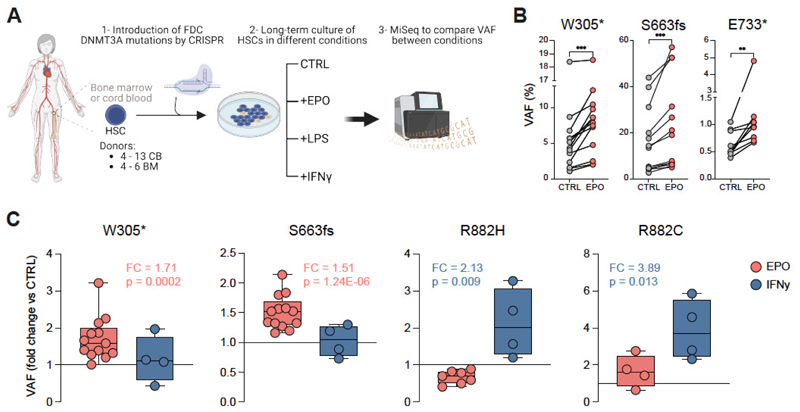
Donor blood saves lives, yet the potential impact of recurrent large-volume phlebotomy on donor health and hematopoietic stem cells (HSCs) remains largely unexplored. In our study, we conducted a comprehensive screening of 217 older male volunteer donors with a history of extensive blood donation (>100 lifetime donations) to investigate the phenomenon of clonal hematopoiesis (CH). No significant difference in the overall incidence of CH was found in frequent donors (FDs) compared with sporadic donors (<10 lifetime donations; 212 donors). However, upon deeper analysis of mutations in DNMT3A, the most commonly affected gene in CH, we observed distinct mutational patterns between the FD and age/sex-matched control donor cohorts. Functional analysis of FD-enriched DNMT3A variants examined in CRISPR-edited human HSCs demonstrated their competitive outgrowth potential upon stimulation with erythropoietin (EPO), a hormone that increases in response to blood loss. In contrast, clones harboring leukemogenic DNMT3A R882 mutations increase upon stimulation with interferon gamma. Through concurrent mutational and immunophenotypic profiling of primary samples at single-cell resolution, a myeloid bias of premalignant R882 mutant HSCs was found, whereas no significant lineage bias was observed in HSCs harboring EPO-responsive DNMT3A variants. The latter exhibited preferential erythroid differentiation when persistent erythropoietic stress was applied to CRISPR-edited human HSC xenografts. Our data demonstrate a nuanced, ongoing Darwinian evolution at the somatic stem cell level, with EPO identified as a novel environmental factor that favors HSCs carrying certain DNMT3A mutations.


Conflict of interest statement

Competing interests: Authors declare that they have no competing interests.

Figures

Fig. 1
Fig. 1. Frequent blood donors show expected CH incidence but distinct DNMT3A mutation profile.
(A) Characteristics of the frequent donor (FD) and control donors (CD) collected and analyzed as the main and validation cohort. (B) Percentage of donors with somatic mutations (Hits within the FD and CD cohorts. The cutoff for the VAF (clone size) was set to 0.005 (0.5%). Analysis with a 0.02 (2%) cutoff is shown for comparison. Percentage values are indicated on the bars. Data from the main and validation cohort are plotted separately. For VAF cutoff 0.005, main cohort: adjusted OR/CI: 1.81/0.95-3.49, p=0.074. For VAF cutoff 0.005, validation cohort: adjusted OR/CI: 0.81/0.44-1.48, p=0.49. For VAF cutoff 0.02, main cohort: adjusted OR/CI: 1.33/0.58-3.09, p=0.501. For VAF cutoff 0.02, validation cohort: adjusted OR/CI: 0.72/0.29-1.75, p=0.47. Data from the main and validation cohort are plotted separately. (C) LollipopPlot charts with type and location of the mutations in DNMT3A shown (detected at a VAF ≥ 0.005, extended FD and main CD). The events are color-coded based on their effects on the protein (see legend). See Supplementary Tables 2a/b and 3a/b for full lists of events. The locations of the PWWP (proline–tryptophan–tryptophan–proline motif), the ADD (ATRX, DNMT3, and DNMT3L)-type zinc finger, and the methyltransferase (MTase) domains are shown. All but three exonic splice region DNMT3A mutations (c.2320 G>A, c.2477 A>G in the CD and c.2477 A>G in the FD) are not depicted in the lollipopPlot. Mutations from the (extended) main and validation cohort are plotted together. Fisher test for independence between donor group and mutation class: p=0.404. (D) Analysis of stability scores for DNMT3A mutations from the FD and CD cohorts that were matched to the variants characterized by Huang et al.42 (See Supplementary Table 3a/b), p<0.001. Data from the main and validation cohorts were combined. (E) Analysis of the fitness (f) (p<0.001) for DNMT3A mutations from the frequent and control donor cohort that were matched to the variants characterized by Watson et al.33 (See Supplementary Table 5). Data from the main and validation cohorts are plotted together.
Fig. 2
Fig. 2. DNMT3A-clones associated with blood donation expand in EPO-induced stress while preleukemic R882-mutant clones expand in IFNγ-induced stress.
(A) Schematic representation of genetic engineering of human HSCs to introduce mutations found in frequent blood donors and perform long term-culture (LTC) in the presence of different stimuli over 4 weeks. VAF between conditions was compared at the end of the co-culture at 4 weeks. (B) For each DNMT3A mutant clone from FD, a significant increase of the VAF was observed when comparing non-treated (CTRL) and EPO conditions after 4 weeks in culture. Each dot represents an independent biological donor. Paired t-test for each biological donor between different conditions was used for statistical significance. *, p < 0.05; **, p < 0.01; *** p < 0.001. (C) Fold change expansion upon different conditions of each mutation in all cord blood donors tested (n = 4-13). For clone S663fs and clone W305* 13 biological donors were tested over 4 independent experiments. For clones R882H and R882C 4-7 biological donors were tested in 2 independent experiments. Each dot represents an independent biological donor. T-test for each biological donor between different conditions was used for statistical significance of the percentage of the DNMT3A-mutant clones. *, p < 0.05; **, p < 0.01; *** p < 0.001.
Fig. 3
Fig. 3. Downregulation of DNMT3A associated with W305* FD mutation underlies outgrowth advantage in EPO-rich environments.
(A) Schematic representation of single cell deposition of K562 after introduction of the mutations by CRISPR, expansion in vitro and colony screening to select the monoclonal colonies harboring specific mutations to perform RNA sequencing. (B) Previously identified DNMT3A transcripts and the corresponding ENSEMBL annotation. (C) Heatmap of DNMT3A transcripts annotated in ENSEMBL and detected in the bulk RNASeq. W305* mutant K562 compared to the other genotypes show lower levels of transcripts correlating with previously reported protein-coding transcripts and increased levels of transcripts annotated to undergo nonsense mediated mRNA decay (NMD). (D) Principal Component Analysis (PCA) based clustering of transcription profiles of DNMT3A downregulated vs. control HUDEP-2 cells. n=9. (E) Gene set enrichment analysis (GSEA) of heme metabolism signature in DNMT3A downregulated vs. control HUDEP-2 cells. ES, enrichment score; NES, normalized enrichment score; FDR, false discovery rate. (F) Normalized expression counts (DESeq2) for indicated genes in DNMT3A downregulated (red) vs. control HUDEP-2 (blue) cells. n=9. Padj HBA1, HBA2, HBB and EPOR: 1.39e-15, 1.46e-20, 1.91e-19 and 2.62e-06, respectively. (G) DNMT3A downregulated (BFP+) and HUDEP-2 control (GFP+) cells were co-cultured at the given ratio in regular and erythroid differentiation media. The ratio between BFP and GFP positive cells was analyzed over a period of 8 days and is presented relative to the input. n=3, three independent experiments, measurement in duplicates. P-values Differentiation vs. Regular Media for timepoints Day 1, 3, 5 and 8 were: 0.33, 0.19, 0.03 (*) and 0.01 (*) respectively.
Fig. 4
Fig. 4. In vivo study of lineage distribution of DNMT3A variants.
(A) UMAP clustering of CD34 enriched samples based on their immunophenotype as defined by expression of 50 unique hematopoietic surface antigens with cell type labels transferred from Triana et al., 2021(51). (B-C) Intradonor/Intrapatient, genotype specific cellular composition of indicated donor samples. 15 cell clusters were defined according to the UMAP in a as shown in the color-matched legend. Fisher exact test was used for analysis of statistical significance in the contribution of a mutant vs. non-mutant genotype to a given cell population *, p < 0.05; **, p < 0.01; *** p < 0.001. (D) Schematic representation of the humanized mice model used to evaluate W305* and R882H behavior within the hematopoietic system after producing sustained erythropoietic stress via successive bleeding/ EPO injection and phenylhydrazine treatment. (E-F) Frequency of W305* (E) or R882H (F) mutations represented as fold expansion from HSPC and mature cell subsets. Each dot represents an individual humanized mouse. t-test was used for statistical significance. *, p < 0.05; **, p < 0.01; *** p < 0.001. Overlaid heatmap representing the fold expansion of each mutation within the different cell populations of the hematopoietic system is provided to visualize the differential lineage bias of the two DNMT3A mutations.

Comment in

  • Of donors and dynamics.
    Cull AH, Kent DG. Cull AH, et al. Blood. 2025 May 22;145(21):2399-2400. doi: 10.1182/blood.2025028660. Blood. 2025. PMID: 40402526 No abstract available.

References

    1. Ritter S, Hamouda O, Offergeld R. Demography and donation frequencies of blood and plasma donor populations in Germany. Update 2010 and 5-year comparison. Bundesgesundheitsblatt Gesundheitsforsch Gesundheitsschutz. 2012;55:914–922. - PubMed
    1. Association GM. Guideline for Manufacturing of Blood and Blood Components and Hemotherapy (Hemotherapy Guidelines)
    1. Nadler SB, Hidalgo JH, Bloch T. Prediction of blood volume in normal human adults. Surgery. 1962;51:224–232. - PubMed
    1. Zhao J, Dahlén T, Brynolf A, Edgren G. Risk of hematological malignancy in blood donors: A nationwide cohort study. Transfusion. 2020;60:2591–2596. doi: 10.1111/trf.16020. - DOI - PMC - PubMed
    1. Cabezas-Wallscheid N, Buettner F, Sommerkamp P, Klimmeck D, Ladel L, Thalheimer FB, Pastor-Flores D, Roma LP, Renders S, Zeisberger P, Przybylla A, et al. Vitamin A-Retinoic Acid Signaling Regulates Hematopoietic Stem Cell Dormancy. Cell. 2017;169:807–823.:e19. - PubMed

Substances

LinkOut - more resources