. 2025 May 5;224(5):e202407014.
doi: 10.1083/jcb.202407014. Epub 2025 Mar 11.

The deubiquitinase USP45 inhibits autophagy through actin regulation by Coronin 1B

Affiliations

The deubiquitinase USP45 inhibits autophagy through actin regulation by Coronin 1B

Yuchieh Jay Lin et al. J Cell Biol. .

Erratum in

Abstract

The autophagy-lysosomal system comprises a highly dynamic and interconnected vesicular network that plays a central role in maintaining proteostasis and cellular homeostasis. In this study, we uncovered the deubiquitinating enzyme (DUB), dUsp45/USP45, as a key player in regulating autophagy and lysosomal activity in Drosophila and mammalian cells. Loss of dUsp45/USP45 results in autophagy activation and increased levels of V-ATPase to lysosomes, thus enhancing lysosomal acidification and function. Furthermore, we identified the actin-binding protein Coronin 1B (Coro1B) as a substrate of USP45. USP45 interacts with and deubiquitinates Coro1B, thereby stabilizing Coro1B levels. Notably, the ablation of USP45 or Coro1B promotes the formation of F-actin patches and the translocation of V-ATPase to lysosomes in an N-WASP-dependent manner. Additionally, we observed positive effects of dUsp45 depletion on extending lifespan and ameliorating polyglutamine (polyQ)-induced toxicity in Drosophila. Our findings highlight the important role of dUsp45/USP45 in regulating lysosomal function by modulating actin structures through Coro1B.


Conflict of interest statement

Disclosures: The authors declare no competing interests exist.

Figures
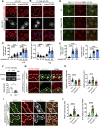
Figure 1.
Figure 1.
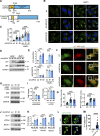
dUsp45 depletion enhances autophagosome formation and autophagic flux. (A and B) The clonal knockdown of dUsp45 (GFP positive) in the larval fat bodies using the flp-out system resulted in an elevated presence of mCherry-Atg8a puncta, compared with controls (GFP negative). Secondary instar larvae (L2) were incubated in normal food (A) or with chloroquine (CQ, 10 mg/ml) for 6 h (B). Knockdown clones are indicated by the dashed line. Scale bar: 20 μm. (C) Quantification results of the number and size of Atg8a puncta were depicted for conditions (A and B). Data are shown as mean ± SEM, n = 3, ≥ 30 cells. (D) Confocal microscopy analysis of autophagic flux, as determined by the expression of GFP-mCherry-Atg8a with the fat body-specific Cg-Gal4 driver, in control (Ctrl) and dUsp45 knockdown larvae. Scale bar, 20 μm. (E) Quantification of total Atg8a puncta and ratio of autolysosomes (GFP mCherry+) to total Atg8a puncta per cell in D; data are shown as mean ± SEM, n = 3, ≥ 30 cells. (F) RT-PCR analysis of dUsp45 mRNA levels in the fat body of second instar (L2) larvae and wandering third-instar (wL3) larvae. Quantification results indicated dUsp45 expression levels normalized to Actin. (G) The clonal expression of dUsp45-WT (GFP positive), but not catalytic mutant dUsp45-C315A (GFP positive), in the wL3 larval fat bodies using the flp-out system resulted in an enlarged size of Atg8a puncta, compared with controls (GFP negative). The clones were indicated by the dashed line. Scale bar: 20 μm. (H) Quantification of the number and size of Atg8a puncta per cell in G; data shown as mean ± SEM, n = 3, ≥ 25 cells. (I) The clonal expression of dUsp45-WT, but not catalytic mutant dUsp45-C315A, in the wL3 larval fat bodies resulted in increased Ref2P signal, compared with controls. The clones were indicated by white lines. Scale bar: 20 μm (original) and 10 μm (zoom-in). (J) Quantification of Ref2P intensity per cell and percentage of the Atg8a puncta colocalized with Ref2P dots. Data are shown as mean ± SEM, n = 3, ≥ 25 cells. Significance was determined using one-way ANOVA and Dunnett’s multiple comparisons test (C, E, H, and J), and Student’s t test (F); *P < 0.05; **P < 0.01; ****P < 0.0001. Source data are available for this figure: SourceData F1.
Figure S1.
Figure S1.
dUsp45 impairs autophagy and V-ATPase translocation to the autolysosome. (A) Confocal microscopic analysis of mCherry-Atg8a puncta in control (Luc), dUsp45 knockdown, and dUsp45 rescue (dUsp45 depletion with dUsp45WT over-expression) larvae fat body. Scale bar, 20 μm. (B) Quantification of Atg8a puncta number in A. Data are shown as mean ± SEM in n = 3, ≥30 cells. (C) Clonal analysis of wL3 larval fat body cells showing mCherry-Atg8 signals in control and dUsp45 knockdown cells (marked with NLS-GFP). Scale bar, 20 μm. (D) Quantification of Atg8 puncta size in control and dUsp45 knockdown cell shown in C. Data shown as mean ± SEM, n = 3, ≥ 20 cells. (E) Western blot analysis of expression level of wild-type (WT) and catalytic mutant (C315A) of dUsp45 in larvae fat body indicated by Flag antibody. (F) Representative TEM images showed the ultrastructure of control (Luciferase), dUsp45 wild-type (WT), and catalytic mutant (CA) overexpression wL3 larval fat body cells. Black arrow indicates autolysosome. Scale bar, 1 μm. (G) Quantification of autolysosome size in F; data shown as mean ± SEM, n = 3, ≥ 20 autolysosomes. (H) Western blot analysis of Ref2P expression in wandering larvae fat body with control and dUsp45WT overexpression. (I) Quantification of Ref2P was normalized to Tubulin. Data are shown as mean ± SEM in four of independent experiments. (J) Diagram shows the percentage of control, dUsp45 overexpression, and knockdown larvae pupariated at indicated days. The data were collected from ≥90 flies in each group. (K) Confocal microscopy analysis of Vha13 (GFP-positive) and mCherry-Atg8a localization in control and dUsp45WT-overexpressing wL3 larval fat body cells. Scale bar, 20 μm (original) and 10 μm (zoom-in). (L) Line-scan profiles of fluorescence intensity for mCherry-Atg8a and GFP-Vha13 along the white line in K. Significance was determined using one-way ANOVA and Tukey‘s (B) or Dunnett’s (G) multiple comparisons test, and Student’s t test (D and I); *P < 0.05; ****P < 0.0001. Source data are available for this figure: SourceData FS1.
Figure 2.
Figure 2.
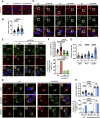
dUsp45 overexpression impairs lysosomal acidification and V-ATPase lysosomal localization. (A) Confocal microscopy analysis showed colocalization of mCherry-Atg8a and GFP-LAMP1 in control or dUsp45WT expressing wL3 larval fat body cells. Scale bar, 20 μm. (B) Quantification of the colocalization of Atg8a and LAMP1 in A. Pearson’s correlation coefficient was analyzed by ImageJ. Data are shown as mean ± SEM, n = 3, ≥ 20 cells. (C) Confocal microscopy analysis of wL3 larval fat body cells expressing Luc (Ctrl), dUsp45WT, or dUsp45RNAi with Cg-Gal4 driver and stained with the fluorescent dye LysoTracker Red. Scale bar, 20 μm. (D) Quantification of the number of LysoTracker-positive dots per cell in C; data shown as mean ± SEM, n = 3, ≥ 20 cells. (E) Quantification of the number of MagicRed puncta per cell in dUsp45 knockdown wL3 larval fat body cells. Data are shown as mean ± SEM, n = 3, ≥ 15 cells. (F) Western blot analysis of Cathepsin-L (CTHL) expression levels in the larval fat bodies expressing Luc (Ctrl) or dUsp45RNAi under the control of Cg-Gal4. (G) Quantification of Cathepsin-L expression normalized to Actin in F. Data shown as mean ± SEM of four independent experiments. (H) Confocal microscopy analysis of localization of VhaSFD (GFP positive) and mCherry-Atg8a in control and dUsp45WT overexpression wL3 larval fat body cells. The arrows showed the colocalized signals of VhaSFD and Atg8a. The scale bars showed 20 μm (original) and 10 μm (zoom-in). (I) Line-scan profiles of fluorescence intensity for mCherry-Atg8a and GFP-VhaSFD along the white line in H. Significance was determined using one-way ANOVA and Dunnett’s multiple comparisons test (D and G), and Student’s t test (B and E); *P < 0.05; **P < 0.01; ****P < 0.0001. Source data are available for this figure: SourceData F2.
Figure 3.
Figure 3.
Mammalian USP45 negatively regulates autophagy. (A) Schematic presentation of the domain structures of human USP45 and Drosophila dUsp45. (B) Immunofluorescence analysis of LC3 puncta in control (scr) or USP45 knockdown HeLa cells with or without bafilomycin A1 (BafA1) treatment. Scale bar, 20 μm. (C) Quantification of the number of LC3 puncta in control and USP45 knockdown cells in B; data shown as mean ± SEM, n = 3, ≥ 30 cells. (D) Western blot analysis of LC3 and p62 levels in control and USP45 depleted HeLa cells with or without BafA1 treatment. (E) Quantification of LC3 and p62 expression normalized to GAPDH in D. Data shown as mean ± SEM of four independent experiments. (F) Confocal microscopy analysis of autophagy flux in mRFP-EGFP-LC3 transfected control or USP45 knockdown HeLa cells. Scale bar showed 10 μm (original) and 5 μm (zoom-in). (G) Quantification of the number of total LC3 puncta and the ratio of autolysosomes (RFP+GFP) to total LC3 puncta. Data as shown by mean ± SEM, n = 3, ≥25 cells/condition. (H) Western blot analysis of phospho-p70 S6 kinase (pS6K), total p70 S6 kinase (S6K), and mTOR expression levels in control and USP45 knockdown HeLa cells. (I) Quantification of phospho-S6K normalized to total S6K, and mTOR levels normalized to GAPDH in H. Data shown as mean ± SEM of three independent experiments. (J) Western blot analysis of ULK1, VPS34, and Beclin1 expression levels in control and USP45 knockdown HeLa cells. (K) Quantification of ULK1, VPS34, and Beclin1 levels normalized to GAPDH in J. Data shown as mean ± SEM of three independent experiments. (L) Immunofluorescent analysis of GFP-TFEB localization in control and USP45 knockdown HeLa cells. Scale bar, 20 μm. (M) Quantification of the percentage of cells with nuclear GFP-TFEB signal. Data are shown by mean ± SEM, n = 30 images, ≥5 cells/image. Significance was determined using one-way ANOVA and Dunnett’s multiple comparisons test (C, E, G, I, and K), and Student’s t test (M); *P < 0.05; **P < 0.01; ***P < 0.001; ****P < 0.0001; NS not significant. Source data are available for this figure: SourceData F3.
Figure S2.
Figure S2.
Depletion of USP45 causes enrichment of V-ATPase at the lysosome. (A) Immunofluorescent analysis of the colocalization of transiently transfected Myc-USP45 and endogenous vesicle markers (EEA1, Rab7, LAMP1, and LC3) in HeLa cells using the indicated antibodies. Scale bar, 10 μm (original) and 4 μm (zoom-in). (B) Quantification of colocalization of Myc-USP45 and markers in A. Data are shown as mean ± SEM in n = 3, ≥15 cells from three independent experiments. (C) RT-PCR analysis of USP45 expression in control and USP45 knockdown HeLa cells. (D) Immunofluorescent analysis of LysoTracker (LTK) and lysosome (LAMP2) in USP45 knockdown cells. Scale bar, 10 μm. (E) Quantification of LTK dot number and LAMP2 intensity respectively in D. Data shown as mean ± SEM in n = 3, ≥40 cells. (F) Immunofluorescent analysis of colocalization of V-ATPase subunit (V1H) and lysosome (LAMP1). Scale bar, 20 μm. (G) Quantification of colocalization of V1H and LAMP1 in F. ± SEM in n = 3, ≥20 cells. (H) Lysosomal immunoprecipitation (LysoIP) analysis of V-ATPase subunits (V1Band V0D) in enriched lysosome lysate by precipitating TMEM192-HA (TMEM192-Flag as negative control) in control and USP45 knockdown HEK293T cells. V-ATPase subunits (V1B, V0D) and organelle markers (lysosome, LAMP2; mitochondria, ATP5A; Golgi, GM130; and ER, Calnexin) were detected by antibodies. (I) Quantification of V1B normalized to HA. Data are shown as mean ± SEM from three independent experiments. Significance was determined using one-way ANOVA and Tukey‘s (B) or Dunnett’s (E and I) multiple comparisons test, and Student’s t test (G); *P < 0.05; ***P < 0.001; ****P < 0.0001. Data shown as mean Source data are available for this figure: SourceData FS2.
Figure 4.
Figure 4.
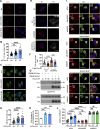
USP45 negatively regulates lysosomal activity by altering V-ATPase endolysosomal trafficking. (A) Western blot analysis of Cathepsin-L (CTHL) levels in control (scr) and USP45 knockdown HeLa cells. (B) Quantification of mature CTHL expression normalized to tubulin in A. Data shown as mean ± SEM of three independent experiments. (C) Immunofluorescence analysis of DQ-BSA puncta in control or USP45 knockdown HeLa cells. Scale bar, 20 μm. (D) Quantification of the number of DQ-BSA puncta in control and USP45 knockdown cells treated as C; data are shown as mean ± SEM, n = 3, ≥ 30 cells. (E) Confocal microscopy analysis of colocalization of the V-ATPase subunit (V0D) and endolysosomal markers (EEA1, Rab7, and LAMP2) in control and USP45 knockdown cells with indicated antibodies. The scale bars show 10 μm (original) and 4 μm (zoom-in). (F) Quantification of the colocalization of V0D and endolysosomal markers in E. Pearson’s correlation coefficient and colocalization rate were analyzed by ImageJ. Data are shown as mean ± SEM, n = 3, ≥ 30 cells. Significance was determined using Student’s t test (B, D, and F); *P < 0.05; **P < 0.01; ***P < 0.001; ****P < 0.0001; NS not significant. Source data are available for this figure: SourceData F4.
Figure 5.
Figure 5.
USP45 interacts with and deubiquitinates Coro1B. (A) Coimmunoprecipitation (Co-IP) analysis of the interaction between Myc-USP45 and Flag-Coro1B or Flag-Coro1C in HEK293T cells. Co-IP experiments were performed using an anti-Myc antibody, followed by a Western blot analysis with the indicated antibodies. (B) (top). Schematic presentation of domain structures and deletion mutants of Coro1B. β-propeller, β-propeller domain; CC, coiled-coil domain. (bottom) Coimmunoprecipitation assays to map the interaction regions between USP45 and Coro1B. (C) Western blot analysis of the expression levels of Coro1B and Coro1C with indicated antibodies in control and USP45 knockdown HeLa cells. (D) Quantification of Coro1B and Coro1C expression normalized to tubulin and GAPDH, respectively. Data are shown as mean ± SEM of at least three independent experiments. (E) Western blot analysis of the expression levels of Coro1B in control (scr) and USP45 knockdown HeLa cells with or without treatment of proteasome inhibitor MG132 (5 μM, 4 h). (F) Quantification of Coro1B expression normalized to GAPDH in E. Data are shown as mean ± SEM of four independent experiments. (G) Cycloheximide (CHX) chase analysis of Coro1B expression in control and USP45 knockdown HeLa cells treated with CHX for the indicated times. (H) Quantification of Coro1B levels normalized to GAPDH at different time points after CHX treatment, as indicated in G. Data shown as mean ± SEM of four independent experiments. (I) Immunoprecipitation analysis for Coro1B ubiquitination in control or USP45 knockdown HEK293T cells. (J) Quantification of ubiquitin (Ub) levels normalized to Coro1B in I. Data are shown as mean ± SEM of three independent experiments. (K) Immunoprecipitation analysis of Coro1B ubiquitination in cells expressing Flag-Coro1B, Myc-tagged USP45-WT or the catalytically inactive USP45-C199A (C > A) mutant. (L) Quantification of Ub levels normalized to Coro1B in K. Data shown as mean ± SEM of three independent experiments. Significance was determined using one-way ANOVA and Dunnett’s (D, J, and L) or Tukey’s (F) multiple comparisons test, and Student’s t test (H); *P < 0.05; **P < 0.01; ***P < 0.001; ****P < 0.0001; NS not significant. Source data are available for this figure: SourceData F5.
Figure S3.
Figure S3.
USP45 interacts with Coro1B and mediates its ubiquitination. (A) Immunoprecipitation analysis of interaction between Flag-Coro1B and Myc-USP45 with Flag antibody. (B) Immunoprecipitation analysis of the interaction between Flag-Coro1B and endogenous USP45 by pulldown of Flag-Coro1B. (C) RT-PCR analysis of CORO1B mRNA level in control and USP45 knockdown HeLa cell. Quantification of CORO1B mRNA level was normalized to GAPDH. Data are shown as mean ± SEM from three independent experiments. (D) Immunoprecipitation analysis for Flag-Coro1B ubiquitination in HEK293T cells with expression of wild-type (WT) or mutant (C199A) Myc-USP45. Cells were lysed by a denaturing agent (1% SDS) containing buffer. Quantification of Ub was normalized to Flag-Coro1B. Data are shown as mean ± SEM from three independent experiments. Significance was determined using one-way ANOVA and Dunnett’s multiple comparisons test (C and D); ****P < 0.0001. Source data are available for this figure: SourceData FS3.
Figure 6.
Figure 6.
USP45 depletion–induced F-actin patch formation is required for V-ATPase translocation to lysosomes. (A) Confocal microscopy analysis of F-actin structures stained with phalloidin in control (scr) and USP45 knockdown HeLa cells. Arrows indicate cytoplasmic F-actin patches. Scale bar, 20 μm. (B) Quantification of the area of cytoplasmic F-actin patches in A; data shown as mean ± SEM, n = 3, ≥ 35 cells. (C) Immunofluorescence analysis of colocalization of the F-actin patches and endolysosomal markers (EEA1, Rab7, and LAMP1) in control and USP45 knockdown cells with indicated antibodies. The scale bars showed 20 μm (original) and insets with 1.5x zoom. (D) Quantification of the colocalization of F-actin patches and endolysosomal markers in C. Pearson’s correlation coefficient was analyzed by ImageJ. Data are shown as mean ± SEM, n = 3, ≥ 30 cells. (E) Immunofluorescence analysis of colocalization of V-ATPase (V1H) and lysosome (LAMP1) in control and USP45 knockdown HeLa cells treated with LatA (200 nM) or Arp2/3 inhibitor CK666 (200 μM) for 2 h. Scale bar, 10 μm (original) and insets, 2.5x zoom. (F) Quantification of the colocalization of V1H and LAMP1 in E. Pearson’s correlation coefficient and colocalization rate were analyzed by ImageJ. Data are shown as mean ± SEM, n = 3, ≥ 25 cells. (G) Immunofluorescence analysis of colocalization of V-ATPase (V1H) and lysosome (LAMP1) in control and USP45 knockdown cells transfected with control (siCtrl) siRNA or siRNA targeting WASP family genes (siN-WASP and siWASH). Scale bar, 10 μm (original) and insets, 2.5x zoom. (H) Quantification of the colocalization of V1H and LAMP1 in G. Data are shown as mean ± SEM, n = 3, ≥ 25 cells. Significance was determined using one-way ANOVA and Dunnett’s (B) or Tukey’s (F and H) multiple comparisons test, and Student’s t test (D); ***P < 0.001; ****P < 0.0001; NS not significant.
Figure S4.
Figure S4.
USP45 depletion accelerates recovery of acidification and actin patch structure formation after removal of actin polymerization inhibitor, LatA. (A) Immunofluorescent analysis of LysoTracker (LTK) and actin structure (phalloidin) in control and USP45 knockdown HeLa cells. Cells were treated with LatA (200 nM, 2 h) followed by replacement of fresh medium for 15 min. Scale bar, 20 μm (original) and 5 μm (zoom-in). (B) Quantification of LTK dot number and LTK-phalloidin colocalization in A. Data are shown as mean ± SEM in n = 3, ≥30 cells. Significance was determined using one-way ANOVA and Tukey’s multiple comparisons test; ****P < 0.0001.
Figure 7.
Figure 7.
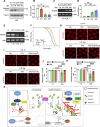
Depletion of Coro1B promotes autophagy and V-ATPase lysosomal localization. (A) Confocal images of late L2 larval fat body cells expressing GFP-mCherry-Atg8a in control (Ctrl) and Coro knockdown larvae. Scale bar, 20 μm. (B) Quantification of the ratio of autolysosomes (GFP mCherry+) to total Atg8a puncta per cell in A; data are shown as mean ± S EM, n = 3, ≥ 20 cells. (C) Confocal images of wL3 larval fat body cells from flies expressing mCherry-Atg8a and indicated transgenes driven by Cg-Gal4. Scale bar, 20 μm. (D) Quantification of Atg8a puncta number and size shown in C. Data are shown as mean ± SEM, n = 3, ≥ 15 cells. (E) Immunofluorescence analysis of colocalization of V-ATPase (V1H) and lysosome (LAMP1) in control and Coro1B knockdown HeLa cells. Scale bar, 20 μm (original) and insets, 3x zoom. (F) Quantification of the colocalization of V1H and LAMP1 in E. Pearson’s correlation coefficient and colocalization rate were analyzed by ImageJ. Data are shown as mean ± SEM, n = 3, ≥ 20 cells. (G) Immunofluorescence analysis of colocalization of V-ATPase (V1H) and lysosome (LAMP1) in control and Coro1B knockdown cells treated with LatA (200 nM) or Arp2/3 inhibitor CK666 (200 μM) for 2 h. Scale bar, 20 μm (original) and insets, 2x zoom. (H) Quantification of the colocalization of V1H and LAMP1 in G. Data are shown as mean ± SEM, n = 3, ≥ 25 cells. Significance was determined using one-way ANOVA and Tukey’s multiple comparisons test (D and H), and Student’s t test (B and F); ****P < 0.0001; NS not significant.
Figure S5.
Figure S5.
CORO1B knockdown promotes lysosomal function and V-ATPase translocation to lysosome in an N-WASP-dependent manner. (A) Immunofluorescent analysis of LysoTracker (LTK) in control and CORO1B knockdown HeLa cell. Scale bar, 10 μm. (B) Quantification of LTK dot number in A. Data are shown as mean ± SEM in n = 3, ≥30 cells. (C) Confocal microscopic analysis of DQ-BSA in control and CORO1B knockdown cells. Scale bar, 10 μm. (D) Quantification of DQ-BSA number in C. Data are shown as mean ± SEM in n = 3 , ≥30 cells. (E) Confocal microscopic analysis of LTK signals in control and USP45 knockdown cells with or without Flag-Coro1B overexpression. Scale bar, 10 μm. (F) Quantification of LTK dot number in E. Data shown as mean ± SEM in n = 3, ≥20 cells. (G) Lysosomal immunoprecipitation (LysoIP) analysis of V-ATPase subunit (V1H) in enriched lysosome lysate of control and CORO1B knockdown HEK293T cells. TMEM192-Flag was emerged as negative control. (H) Quantification of V1H normalized to HA in G. Data shown as mean ± SEM in three of independent experiments. (I) Immunofluorescent analysis of the colocalization of the V-ATPase subunit (V1H) and lysosome marker (LAMP1) in control and Coro1B-depleted HeLa cells with knockdown of control or WASP family proteins (N-WASP, WASH) by the indicated siRNAs. (J) Quantification of colocalization of V1H and LAMP1 in I. Data are shown as mean ± SEM in n = 3, ≥20 cells. Significance was determined using one-way ANOVA and Dunnett’s (B, D, and H) or Tukey‘s (F and J) multiple comparisons test; **P < 0.01; ***P < 0.001; ****P < 0.0001. Source data are available for this figure: SourceData FS5.
Figure 8.
Figure 8.
Loss of dUsp45 extends lifespan and mitigates polyQ-induced toxicity in Drosophila. (A) Western blot analysis of cathepsin-L (CTHL) levels in the heads of adult flies at different ages. (B) Quantification of CTHL levels normalized to Tubulin in A. Data are shown as mean ± SEM of three independent experiments. (C) RT-PCR analysis of dUsp45 mRNA levels in the heads of adult flies at different ages. (D) Quantification of dUsp45 mRNA levels normalized to Actin. Data are shown as mean ± SEM of three independent experiments. (E) RT-PCR analysis of dUsp45 mRNA levels in control (w1118 and dUsp45EY/+) and dUsp45 mutant (dUsp45EY/EY and dUsp45EY/B) flies. Numbers below lanes indicate the relative ratio of dUsp45/Actin. (F) Loss of dUsp45 (dUsp45EY/EY and dUsp45EY/B) extends lifespan compared with controls (w1118 and dUsp45EY/+). N ≥ 582 flies of each genotype. (G) Confocal images of phalloidin stained retinae from young (1 day) and aged (70 days) adult flies expressing GFP (control), or mutant (72Q) Htt fragment together with GFP or dUsp45RNAi under control of the eye-specific driver GMR-Gal4. Flies were reared in a light/dark (LD 12L:12D) cycle incubator. Scale bar, 10 μm. (H) Quantification of intact rhabdomere numbers in flies described in G. Data shown as mean ± SEM in n = 3, ≥30 ommatidea per genotype. (I) Confocal images of phalloidin stained retinae from young (1 day) and aged (40 days) adult flies expressing GFP (control), or mutant (72Q) Htt fragment together with GFP or CoroRNAi under control of the eye-specific driver GMR-Gal4. Flies were reared in a light/dark (LD 12L:12D) cycle incubator. Scale bar, 10 μm. (J) Quantification of intact rhabdomere numbers in flies described in I. Data shown as mean ± SEM in n = 3, ≥20 ommatidea per genotype. (K) A schematic diagram illustrating the role of USP45 in regulating autophagy, lysosome function, and V-ATPase lysosomal localization through the modulation of actin structures via Coro1B. Significance was determined using one-way ANOVA and Tukey’s multiple comparisons test (B, D, H, and J), and log-rank test (F); *P < 0.05; **P < 0.01; ***P < 0.001; ****P < 0.0001; NS not significant. Source data are available for this figure: SourceData F8.

References

    1. Aman, Y., Schmauck-Medina T., Hansen M., Morimoto R.I., Simon A.K., Bjedov I., Palikaras K., Simonsen A., Johansen T., Tavernarakis N., et al. . 2021. Autophagy in healthy aging and disease. Nat. Aging. 1:634–650. 10.1038/s43587-021-00098-4 - DOI - PMC - PubMed
    1. Angarola, B., and Ferguson S.M.. 2019. Weak membrane interactions allow Rheb to activate mTORC1 signaling without major lysosome enrichment. Mol. Biol. Cell. 30:2750–2760. 10.1091/mbc.E19-03-0146 - DOI - PMC - PubMed
    1. Ballabio, A., and Bonifacino J.S.. 2020. Lysosomes as dynamic regulators of cell and organismal homeostasis. Nat. Rev. Mol. Cell Biol. 21:101–118. 10.1038/s41580-019-0185-4 - DOI - PubMed
    1. Barbosa, M.C., Grosso R.A., and Fader C.M.. 2019. Hallmarks of aging: An autophagic perspective. Front. Endocrinol. (Lausanne). 9:790. 10.3389/fendo.2018.00790 - DOI - PMC - PubMed
    1. Brandstaetter, H., Kishi-Itakura C., Tumbarello D.A., Manstein D.J., and Buss F.. 2014. Loss of functional MYO1C/myosin 1c, a motor protein involved in lipid raft trafficking, disrupts autophagosome-lysosome fusion. Autophagy. 10:2310–2323. 10.4161/15548627.2014.984272 - DOI - PMC - PubMed

LinkOut - more resources