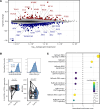
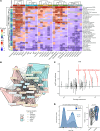
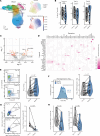
. 2025 Mar 11;135(11):e182790.
doi: 10.1172/JCI182790. eCollection 2025 Jun 2.

Transcriptomic profiling after B cell depletion reveals central and peripheral immune cell changes in multiple sclerosis

Affiliations

Transcriptomic profiling after B cell depletion reveals central and peripheral immune cell changes in multiple sclerosis

Jessica Wei et al. J Clin Invest. .

Abstract

Multiple sclerosis (MS) is a complex, genetically mediated autoimmune disease of the CNS, in which anti-CD20-mediated B cell depletion is remarkably effective in the treatment of early disease. Although previous studies investigated the effect of B cell depletion on select immune cell subsets using flow cytometry-based methods, the therapeutic effect on the patient's immune landscape is unknown. In this study, we explored how B cell-depleting therapies modulate the immune landscape using single-cell RNA-Seq. We demonstrate that B cell depletion led to cell-type-specific changes in the abundance and function of cerebrospinal fluid (CSF) macrophages and peripheral blood monocytes. Specifically, a CSF-specific macrophage population with an antiinflammatory transcriptomic signature and peripheral CD16+ monocytes increased in frequency after B cell depletion. This was accompanied by increases in TNF-α mRNA and protein levels in monocytes following B cell depletion, consistent with the finding that anti-TNF-α treatment exacerbated autoimmune activity in MS. In parallel, B cell depletion induced changes in peripheral CD4+ T cell populations, including increases in the frequency of TIGIT+ Tregs and marked decreases in the frequency of myelin peptide-loaded, tetramer-binding CD4+ T cells. Collectively, this study provides an exhaustive transcriptomic map of immunological changes, revealing different cell-type-specific reprogramming as a result of B cell depletion treatment of MS.

Keywords: Autoimmunity; Immunology; Multiple sclerosis.


Figures
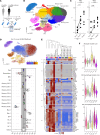
Figure 1
Figure 1. Microglia-like CSF macrophages increase in frequency in patients with MS following B cell depletion therapy.
(A) Healthy donor and MS patient sample collection scheme for scRNA-Seq analysis (n = 6 healthy donors, n = 5 patients with MS before treatment [Tx], n = 5 matched patients with MS after treatment). (B) UMAP dimensionality reduction plot of immune cell clusters detected in CSF from healthy donors and patients with MS (n = 60,704 single cells, 17 immune cell clusters). (C) CSF macrophage cluster frequency before and after B cell depletion therapy across all 5 patients with MS. (D) Post–B cell depletion therapy MELD likelihood (mean ± SEM, n = 5 patients with MS) enrichment UMAP and patient-level summary values for all immune clusters in C. (E) Heatmap of myeloid-related genes showing average expression levels across all immune cell types. (F) All myeloid clusters in the CSF scored against microglia, CNS macrophage, and pan-macrophage gene modules. P values were calculated using the Wald test of regression coefficients.
Figure 2
Figure 2. Enriched CSF macrophages present an antiinflammatory phenotype in patients with MS following B cell depletion therapy.
Gene expression analyses of CSF macrophages were conducted by comparing cells from healthy donors (n = 6) and pre– and post–B cell depletion therapy MS patient samples (n = 5). (A) Mean abundance plot depicting DEGs (FDR <0.1) in the Mac 1 cluster from patients with MS before and after B cell depletion. Blue indicates downregulation after treatment; red indicates upregulation after treatment. (B) MHC class I and class II gene module scores for healthy donor, MS pre-treatment, and MS post-treatment Mac 1 cells. (C) Dot plot depicting myeloid inflammatory and antiinflammatory gene expression in healthy donors and patients with MS before and after treatment. (D) Gene module scores for all CSF myeloid clusters against peripheral monocyte gene signatures. Top: classical monocyte module score, middle: intermediate monocyte module score; bottom: nonclassical monocyte module score.
Figure 3
Figure 3. Increased CD16+ monocyte abundance after anti-CD20 treatment.
(A) experimental design of pre- and post-treatment (anti-CD20) PBMC samples from patients with MS (n = 18) for droplet-based scRNA-Seq using the 10X Genomics platform. (B) UMAP of annotated cell types (left) and overlaid MELD likelihoods for post-treatment status (right). (C) MELD likelihood patient-level summary values (mean ± SEM) per fine-grained cluster and main cell types. (D) Fine-grained community frequency post-treatment changes (log fold change mean estimate ± SEM from β regression; see Methods). (E) Flow cytometric validation of CD16+ monocyte frequency changes in MS patients’ PBMCs. P values were calculated using the Wald test of regression coefficients.
Figure 4
Figure 4. Post-treatment DEGs in CD16+ monocytes.
(A) Mean abundance plot of gene expression changes. DEGs are highlighted in red (upregulated after treatment), or blue (downregulated after treatment). (B) Flow cytometric analysis of HLA-DR and CD81 expression in CD16+ monocytes (n = 16). (C) GSEA using the Hallmark gene sets for CD16+ monocytes. (D) Custom GSEA analysis of post-treatment PBMC monocyte signature gene sets (up- and downregulated genes) tested on the CSF macrophage Mac 1 dataset (from Figure 1). P values were calculated using the Wald test of regression coefficients.
Figure 5
Figure 5. GSEA of anti-CD20 gene expression alterations across cell types.
(A) Heatmap of normalized enrichment scores (NESs) from post-treatment GSEA analyses run for each cluster shows a ubiquitous increase in TNF-α/NF-κB pathway genesets. Differentially enriched gene sets are highlighted with an asterisk. “ID count” indicates the number of times a gene set was found enriched across communities. (B) Overlap graph analysis of leading-edge genes for the “TNF-α signaling via NF-κB” gene set across cell types highlights 2 sets of signatures: B and myeloid cells versus T cells. (C) Pre- and post-treatment fold change of TNFA transcript levels across clusters (differential expression is highlighted in red). (D) In vitro validation of TNF-α upregulation before and after B cell depletion at the protein level in monocytes from patients with MS (n = 18) by intracellular flow cytometry staining after LPS stimulation. P values were calculated using the Wald test of regression coefficients.
Figure 6
Figure 6. Detailed analysis of CD4+ T cell alterations following anti-CD20 treatment.
(A) Schematic illustration of the analysis of CD4+ T cells using reference mapping and NMFproj. From CSF and PBMC samples, CD4+ T cells were extracted using Azimuth, and detailed CD4+ T clusters were predicted using Symphony. The 12 gene programs were calculated using NMFproj. (B) Inferred CD4+ T cell clusters on the UMAP plot. The clusters were assigned to either a major cluster (L1) or a detailed cluster (L2) level. (C and D) Cell frequency changes after anti-CD20 treatment in CSF (C) and PBMCs (D). Coefficients of cell frequency change per cluster L2 quantified using a generalized linear model with beta distribution are visualized on the UMAP plot (left). The populations with cell frequency increases following B cell depletion treatment are shown in red. CD4+ T cluster frequency before and after B cell depletion therapy (right). Substantially altered clusters are shown. See Supplemental Figure 10C and Supplemental Figure 11C for additional details. (E and F) Alterations of gene programs extracted by NMFproj after anti-CD20 treatment in CSF (E) and PBMCs (F). Dot plots depicting NMF cell feature changes in each cell type (left). Dot colors show coefficients, and sizes show the significance of GLM (method). The coefficient (Coef.) of the gene program change per cluster for some gene programs is shown on the UMAP plots (right). Annotations and representative genes of gene programs are as follows: NMF0 (cytotoxic-feature [cytotoxic-F]; GZMB, CX3CR1); NMF1 (Treg-F; FOXP3, IL2RA); NMF2 (Th17-F; RORC, CCR6); NMF3 (naive-F; CCR7, BACH2); NMF4 (activation-F [Act-F]; DACT1, CDK6), NMF5 (Treg Eff/Th2-F; HLA-DRs, CCR10); NMF6 (Tfh-F; MAF, CXCR5); NMF7 (IFN-F; OAS1, MX1); NMF8 (central memory-F; CRIP2, PLP2); NMF9 (thymic emigrant-F; SOX4, PECAM1); NMF10 (tissue-F; JUNB, NFKBIA); and NMF11 (Th1-F; GZMK, EOMES). P values were calculated using the Wald test of regression coefficients.
Figure 7
Figure 7. B cell depletion induces an increase in TIGIT+ Tregs and reduces autoreactive T cells.
(A) Visualization of Treg population extraction and changes after B cell depletion treatment. Predicted CD4+ T clusters and Tregs (outlined by dotted line) on UMAP plot (left). Re-embedding of extracted Tregs using UMAP (top right). B cell depletion treatment–associated relative likelihood in Treg populations calculated using MELD (bottom right). (B) Frequency changes of each subpopulation within the Treg group. (C) Volcano plot depicting DEGs in Tregs, particularly highlighting genes encoding surface proteins. (D) Heatmap displaying predicted interactions between myeloid cell–derived ligands (limited to genes differentially regulated with B cell depletion treatment) and Treg-derived receptors, weighted by prior interaction potential. (E and F) Flow cytometric data of Treg frequencies (E) and TIGIT protein expression by Tregs (F) in MS patient PBMCs (n = 20) after B cell depletion treatment. (G) Flow cytometric analysis of myelin tetramer–reactive CD4+ T cell frequencies (Freq.) at the pre-treatment and 6-month post-treatment time points (n = 7). (H) Cell frequencies of Tfh (CD45RACXCR5+) and Th17 (CCR6+CXCR3) in tetramer-reactive CD4+ T cells at pre-treatment and 6-month post-treatment time points (n = 7)”. P values were calculated using the Wald test of regression coefficients.

References

    1. Lee DSW, et al. B cell depletion therapies in autoimmune disease: advances and mechanistic insights. Nat Rev Drug Discov. 2021;20(3):179–199. doi: 10.1038/s41573-020-00092-2. - DOI - PMC - PubMed
    1. Pescovitz MD, et al. Rituximab, B-lymphocyte depletion, and preservation of beta-cell function. N Engl J Med. 2009;361(22):2143–2152. doi: 10.1056/NEJMoa0904452. - DOI - PMC - PubMed
    1. Hauser SL, et al. Ocrelizumab versus interferon beta-1a in relapsing multiple sclerosis. N Engl J Med. 2017;376(3):221–234. doi: 10.1056/NEJMoa1601277. - DOI - PubMed
    1. Cao Y, et al. Functional inflammatory profiles distinguish myelin-reactive T cells from patients with multiple sclerosis. Sci Transl Med. 2015;7(287):287ra74. doi: 10.1126/scitranslmed.aaa8038. - DOI - PMC - PubMed
    1. Ota K, et al. T-cell recognition of an immunodominant myelin basic protein epitope in multiple sclerosis. Nature. 1990;346(6280):183–187. doi: 10.1038/346183a0. - DOI - PubMed