. 2025 Mar 11;135(9):e187063.
doi: 10.1172/JCI187063. eCollection 2025 May 1.

Activin A activation of Smad3 mitigates innate inflammation in mouse models of psoriasis and sepsis

Affiliations

Activin A activation of Smad3 mitigates innate inflammation in mouse models of psoriasis and sepsis

Thierry Gauthier et al. J Clin Invest. .

Abstract

Phosphorylation of Smad3 is a critical mediator of TGF-β signaling, which plays an important role in regulating innate immune responses. However, whether Smad3 activation can be regulated in innate immune cells in TGF-β-independent contexts remains poorly understood. Here, we show that Smad3 is activated through the phosphorylation of its C-terminal residues (pSmad3C) in murine and human macrophages in response to bacterial and viral ligands, and this activation is mediated by activin A in a TGF-β-independent manner. Specifically, infectious ligands, such as LPS, induced secretion of activin A through the transcription factor STAT5 in macrophages, and activin A signaling in turn activated pSmad3C. This activin A/Smad3 axis controlled mitochondrial ATP production and ATP conversion into adenosine by CD73 in macrophages, enforcing an antiinflammatory mechanism. Consequently, mice with a deletion of activin A receptor 1b specifically in macrophages (Acvr1bfl/fl-Lyz2cre) succumbed more to sepsis as a result of uncontrolled inflammation and exhibited exacerbated skin disease in a mouse model of imiquimod-induced psoriasis. Thus, we have revealed a previously unrecognized natural brake to inflammation in macrophages that occurs through the activation of Smad3 in an activin A-dependent manner.

Keywords: Cytokines; Immunology; Inflammation; Innate immunity; Macrophages.


Conflict of interest statement

Conflict of interest: The authors have declared that no conflict of interest exists.

Figures

Figure 1
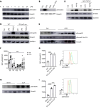
Figure 1. LPS activates Smad3 in a TGF-β–independent manner.
(A) Abundance of the indicated proteins in macrophages treated with 10 ng/mL of LPS for the indicated times. (B) Abundance of the indicated proteins in macrophages pretreated with cycloheximide for 1 hour followed by LPS stimulation for 6 hours. (C) Abundance of the indicated proteins in macrophages pretreated with an anti–TGF-β blocking antibody for 1 hour followed by LPS or TGF-β (5 ng/mL) stimulation for 6 hours. (D) Abundance of the indicated proteins in macrophages isolated from WT or RI-Lyz2cre mice and stimulated by LPS or TGF-β for 6 hours. (E) Abundance of the indicated proteins in peritoneal cells of mice injected i.p. with LPS and harvested 6 hours after injection. Each band represents a mouse. (F) Flow cytometry analysis of phosphorylated Smad2/3 (pSmad2/3) levels in peritoneal cells from mice injected i.p. with LPS and harvested 6 hours after injection. MFI, mean fluorescence intensity; M, macrophages; N, neutrophils; DC, dendritic cells; B, B cells; T, T cells. (n = 9.) (G) Flow cytometry analysis of pSmad2/3 levels in macrophages from WT or RI-Lyz2cre mice injected i.p. with LPS and harvested 6 hours after injection. Red, isotype control; orange, WT; blue, WT LPS; green, RI-Lyz2cre LPS. (H) Abundance of the indicated proteins in peritoneal cells of mice subjected to CLP surgery (or sham surgery) and harvested 6 hours after injection. Each band represents a mouse. (I) Flow cytometry analysis of pSmad2/3 levels in macrophages from WT or RI-Lyz2cre mice subjected to CLP surgery (or sham surgery) and harvested 6 hours after injection. Red, isotype control; green, WT; blue, WT LPS; orange, RI-Lyz2cre LPS. Representative or pooled from at least 2 independent experiments. **P < 0.01, ***P < 0.005, ****P < 0.001 by 1-way ANOVA.
Figure 2
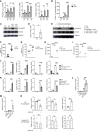
Figure 2. LPS phosphorylates Smad3 in an activin A–dependent manner.
(A) RT-qPCR analysis in macrophages stimulated by LPS. (n = 4–6.) (B) Activin A levels (measured by ELISA) in the supernatant of macrophages stimulated by LPS. (C) Abundance of the indicated proteins in macrophages stimulated by LPS for 6 hours. (D) RT-qPCR analysis of INHBA expression in human macrophages stimulated by LPS for 6 hours. (n = 4.) (E) Abundance of the indicated proteins in human macrophages pretreated with follistatin or an anti–activin A or anti–TGF-β blocking antibody for 1 hour followed by LPS stimulation for 6 hours. (FG) Activin A levels in serum of WT mice injected with LPS (F) or subjected to CLP surgery (G) and harvested after 6 hours. (n = 6–10.) (HI) Flow cytometry analysis of pSmad2/3 levels in macrophages from WT or Acvr1b-Lyz2cre mice injected i.p. with LPS (H) or subjected to CLP surgery (I) and harvested after 6 hours. (J) RT-qPCR analysis of the indicated genes in macrophages stimulated or not by LPS for 24 hours. (n = 4–6.) (K) RT-qPCR analysis of macrophages stimulated or not by LPS for 24 hours. (n = 4.) (L) RT-qPCR analysis of IL6 expression in human macrophages pretreated with follistatin or an anti–activin A blocking antibody for 1 hour followed by LPS stimulation for 24 hours. (n = 4.) (M) RT-qPCR analysis of IL6 expression in human macrophages pretreated with a Smad3 inhibitor (SMAD3i) for 1 hour followed by LPS stimulation for 24 hours. (n = 4.) (N) RT-qPCR analysis in macrophages stimulated by LPS for 24 hours in the presence of activin A. (n = 6.) Representative or pooled from at least 2 independent experiments. *P < 0.05, **P < 0.01, ***P < 0.005, ****P < 0.001 by Student’s t test (A, B, D, F, G, and N) or 1-way ANOVA (HM).
Figure 3
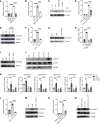
Figure 3. LPS induces the activin A/Smad3 axis through a TLR4/MyD88/MAPK/STAT5 pathway.
(A) RT-qPCR analysis of Inhba expression in macrophages from WT or TLR4-KO mice stimulated 2 hours by LPS. (n = 6.) (B) RT-qPCR analysis of Inhba expression in macrophages from WT or MyD88-KO mice stimulated 2 hours by LPS. (n = 4.) (C) Protein abundance in macrophages stimulated 6 hours by LPS. (D) RT-qPCR analysis of Inhba expression in macrophages from WT or Traf6-Lyz2cre mice stimulated by LPS for 2 hours. (n = 6.) (E) Protein abundance in macrophages isolated stimulated 6 hours by LPS. (F) RT-qPCR analysis of Inhba expression in macrophages pretreated with a TAK1 inhibitor for 1 hour followed by LPS stimulation for 2 hours. (n = 6.) (G) Protein abundance in macrophages pretreated with a TAK1 inhibitor for 1 hour followed by LPS stimulation for 6 hours. (H) RT-qPCR analysis of Inhba expression in macrophages pretreated with MEK and ERK inhibitors for 1 hour followed by LPS stimulation for 2 hours. (n = 6.) (I) Protein abundance in macrophages pretreated 1 hour with MEK and ERK inhibitors followed by LPS stimulation for 6 hours. (J) Protein abundance in macrophages treated with LPS. (K) ChIP-coupled real-time PCR analysis of STAT5 enrichment in various sequences of the promoter region of the Inhba gene in macrophages treated with LPS for 2 hours. (n = 6.) (L) RT-qPCR analysis of Inhba expression in macrophages pretreated 1 hour with a STAT5 inhibitor followed by LPS stimulation for 2 hours. (n = 6.) (M) Protein abundance in macrophages pretreated 1 hour with a STAT5 inhibitor followed by LPS stimulation for 6 hours. (N) RT-qPCR analysis of Inhba expression in macrophages from WT or Stat5-Lyz2cre mice stimulated by LPS for 2 hours. (n = 6.) (O) Protein abundance in macrophages stimulated by LPS for 6 hours. Representative of at least 2 independent experiments. *P < 0.05, **P < 0.01, ***P < 0.005, ****P < 0.001 by 1-way ANOVA.
Figure 4
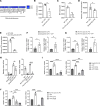
Figure 4. The activin A/Smad3 pathway supports ATP metabolism during inflammation.
(A) Heatmap representing significantly downregulated genes in macrophages from Smad3-KO mice (compared with WT macrophages) stimulated with LPS for 24 hours. (B and C) MitoTracker staining in macrophages stimulated with LPS for 24 hours and isolated from Smad3-KO mice (B) or Acvr1b-Lyz2cre mice (C). (D and E) ATP production (intracellular) in macrophages stimulated with LPS for 24 hours and isolated from Smad3-KO mice (D) (n = 6) or Acvr1b-Lyz2cre mice (E). (F and G) RT-qPCR analysis of Arg1 and Tgfbi expression in macrophages stimulated with LPS for 24 hours in combination (or not) with 20 μM of ATP and isolated from Smad3-KO mice (F) or Acvr1b-Lyz2cre mice (G). (H) RT-qPCR analysis of Nt5e (encoding CD73) expression in macrophages stimulated with LPS for 24 hours and isolated from Smad3-KO or Acvr1b-Lyz2cre mice. (I and J) RT-qPCR analysis of Tgfbi and Arg1 expression in macrophages stimulated with LPS for 24 hours in combination (or not) with ATP and a CD73 inhibitor or a CREB inhibitor and isolated from Smad3-KO mice (I) or Acvr1b-Lyz2cre mice (J). (FJ, n = 4.) Pooled or representative of at least 2 independent experiments. *P < 0.05, **P < 0.01, ***P < 0.005, ****P < 0.001 by Student’s t test (BG) or 1-way ANOVA (HJ).
Figure 5
Figure 5. Activin A signaling in macrophages controls inflammation and survival during sepsis.
(A) Survival of WT or Acvr1b-Lyz2cre mice injected i.p. with LPS. (n = 8–13.) (B) TNF-α and IL-6 levels in serum of WT or Acvr1b-Lyz2cre mice injected i.p. or not with LPS for 3 hours. (n = 6–13.) (C) Survival of WT or Acvr1b-Lyz2cre mice subjected to CLP surgery. (n = 7–11.) (D) TNF-α and IL-6 levels in serum of WT or Acvr1b-Lyz2cre mice subjected to CLP surgery. (n = 8–12.) Pooled from at least 2 independent experiments. *P < 0.05, **P < 0.01, ****P < 0.001 by log-rank (Mantel-Cox test, A and C) and Student’s t test (B and D).
Figure 6
Figure 6. The activin A/Smad3 axis regulates inflammation during psoriasis.
(A) RT-qPCR analysis of Inhba expression in macrophages pretreated for 1 hour with the indicated inhibitors and stimulated with imiquimod (IMQ) for 2 hours. (n = 4–6.) (B) Abundance of the indicated proteins in macrophages isolated from WT or Acvr1b-Lyz2cre mice (KO) and stimulated with IMQ for 6 hours. (C) RT-qPCR analysis of INHBA expression in human monocytes stimulated with IMQ for 2 hours. (n = 4.) (D) Abundance of the indicated proteins in human monocytes pretreated with follistatin or an anti–activin A or anti–TGF-β blocking antibody for 1 hour followed by IMQ stimulation for 6 hours. (E) RT-qPCR analysis of the indicated genes in macrophages from WT or Acvr1b-Lyz2cre mice stimulated or not with IMQ for 24 hours. (n = 4.) (F) RT-qPCR analysis of the indicated genes in macrophages from WT or Smad3-KO mice stimulated or not with IMQ for 24 hours. (n = 4.) (G) RT-qPCR analysis of Inhba expression in skin of WT mice treated with an IMQ topical application for 6 hours. (n = 10.) (H) Abundance of the indicated proteins in skin of WT mice treated with an IMQ topical application for 6 hours. Each band represents a mouse. Macrophages from WT or Smad3-KO macrophages were transferred intradermally in skin of CD45.1 WT mice followed by IMQ topical application for 6 consecutive days. Mice were then harvested and analyzed. (I) Skin thickness. (n = 15.) (J) TCRγδ cytokine production in skin. (n = 15.) WT or Acvr1b-Lyz2cre mice were treated with IMQ topical application for 6 consecutive days, then harvested and analyzed. (K) Skin thickness. (L) Macrophage frequency in skin. (M) Production of cytokines by macrophages. (N) TCRγδ cytokine production in skin. (KN, n = 8–9.) Representative or pooled from at least 2 independent experiments. *P < 0.05, **P < 0.01, ***P < 0.005, ****P < 0.001 by Student’s t test (C and GN) or 1-way ANOVA (A, E, and F).

References

    1. Murray PJ, Wynn TA. Protective and pathogenic functions of macrophage subsets. Nat Rev Immunol. 2011;11(11):723–737. doi: 10.1038/nri3073. - DOI - PMC - PubMed
    1. Park MD, et al. Macrophages in health and disease. Cell. 2022;185(23):4259–4279. doi: 10.1016/j.cell.2022.10.007. - DOI - PMC - PubMed
    1. Watanabe S, et al. The role of macrophages in the resolution of inflammation. J Clin Invest. 2019;129(7):2619–2628. doi: 10.1172/JCI124615. - DOI - PMC - PubMed
    1. Martin-Rodriguez O, et al. Pro-resolving factors released by macrophages after efferocytosis promote mucosal wound healing in inflammatory bowel disease. Front Immunol. 2021;12:754475. doi: 10.3389/fimmu.2021.754475. - DOI - PMC - PubMed
    1. Wynn TA, Vannella KM. Macrophages in tissue repair, regeneration, and fibrosis. Immunity. 2016;44(3):450–462. doi: 10.1016/j.immuni.2016.02.015. - DOI - PMC - PubMed

MeSH terms