. 2025 Jun;642(8066):250-259.
doi: 10.1038/s41586-025-08855-w. Epub 2025 Mar 11.

Complex water networks visualized by cryogenic electron microscopy of RNA

Affiliations

Complex water networks visualized by cryogenic electron microscopy of RNA

Rachael C Kretsch et al. Nature. 2025 Jun.

Abstract

The stability and function of biomolecules are directly influenced by their myriad interactions with water1-16. Here we investigated water through cryogenic electron microscopy (cryo-EM) on a highly solvated molecule: the Tetrahymena ribozyme. By using segmentation-guided water and ion modelling (SWIM)17,18, an approach combining resolvability and chemical parameters, we automatically modelled and cross-validated water molecules and Mg2+ ions in the ribozyme core, revealing the extensive involvement of water in mediating RNA non-canonical interactions. Unexpectedly, in regions where SWIM does not model ordered water, we observed highly similar densities in both cryo-EM maps. In many of these regions, the cryo-EM densities superimpose with complex water networks predicted by molecular dynamics, supporting their assignment as water and suggesting a biophysical explanation for their elusiveness to conventional atomic coordinate modelling. Our study demonstrates an approach to unveil both rigid and flexible waters that surround biomolecules through cryo-EM map densities, statistical and chemical metrics, and molecular dynamics simulations.


Conflict of interest statement

Competing interests: The authors declare no competing interests.

Figures

Fig. 1
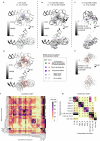
Fig. 1. Map and model of Tetrahymena ribozyme at 2.2 Å and 2.3 Å resolution.
a,b, 2.2 Å (a) and 2.3 Å (b) cryo-EM map at 3σ threshold. c,d, Maps at 2.2 Å (c) and 2.3 Å (d) with transparent surface and derived model in ribbon display, each domain is coloured. e, Models from 2.2 Å and 2.3 Å maps are overlaid. Deviations are labelled for peripheral domains that have considerable differences. f, Secondary structure diagram. All domains are labelled and coloured. g, Extracted densities around four nucleotides showing base resolvability and clear separation of stacked bases. The Q score is labelled. h,i, Density surrounding four nucleotides in the 2.2 Å (h) and 2.3 Å (i) maps showing similar density features surrounding the RNA. The map was segmented at 3σ using Segger. Density segments at distances 1.8–5.0 Å from the RNA heavy atoms are displayed at 5σ (transparent teal) and 8σ (dark teal).
Fig. 2
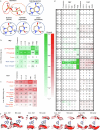
Fig. 2. Water and Mg2+ ion detection with SWIM and consensus between 2.2 Å and 2.3 Å maps.
a,b, Detected waters (red) and Mg2+ ions (green) for the 2.2 Å (a) and 2.3 Å (b) model. Consensus water and Mg2+ ions coloured dark and counts are noted next to each model. ce, Distributions of water and Mg2+ ions separated by consensus and non-consensus types: Q score of water or Mg2+ ions (c; PMg = 5.7 × 10−2 and Pwater = 6.1 × 10−4), average Q score of bound RNA nucleotides (d; PMg = 2.2 × 10−3 and Pwater = 1.0 × 10−6) and RMSD of bound RNA nucleotides between the 2.2 Å and 2.3 Å models after alignment on all RNA heavy atoms (e; PMg = 2.6 × 10−2 and Pwater = 3.8 × 10−5). The horizontal line is the mean value. Pairwise significance was determined by a two-sided Mann–Whitney U-test: not significant (NS) P > 0.05, *P < 0.05 and **P < 10−4.
Fig. 3
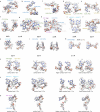
Fig. 3. Water and Mg2+ ion binding to nucleotides within and between domains.
Ribbon display of the model built in the 2.2 Å map (centre), colour-coded by domain as in Fig. 1, along with water (red spheres) and Mg2+ ions (green spheres). aj, The panels on the outside highlight a selection of water and Mg2+ ions interactions, with nucleotide labels colour-coded by domain as in Fig. 1. All water and Mg2+ ions displayed are found in the 2.2 Å and 2.3 Å models; the same regions but with the 2.3 Å map and models can be found in Extended Data Fig. 6a–j. Distances (Å) from water and Mg2+ ions to RNA heavy atoms are labelled; only some of the contacts for each water and Mg2+ ion may be shown in each case. See Supplementary Video 1 to visualize panels c,e,f,h in 3D.
Fig. 4
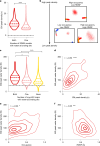
Fig. 4. Water dynamics in molecular dynamics simulation with reference to cryo-EM water-binding sites.
a, Cryo-EM peak density of all SWIM-identified waters is plotted for waters in both cryo-EM maps (‘consensus’ (red) n = 268) or only one cryo-EM map (‘non-consensus’ (pink) n = 268). The violin plot displays the range, dotted lines are the quartiles, and pairwise significance was determined by two-sided Mann-Whitney U-test (P = 3.6 × 10−26). The black dashed line is the mean density of the map. b, Example of molecular dynamics water-binding sites displaying how low occupancy or high RMSF can reduce the peak density. For every molecular dynamics frame, the position of water, if present, is a small red dot. c,d, Water-binding sites from molecular dynamics (MD) simulations are grouped by whether they are found in both cryo-EM maps (red; n = 76), only one cryo-EM map (pink; n = 167) or no cryo-EM maps (yellow; n = 1,984). The molecular dynamics and EM (2.2 Å map) peak water density are the maximum density within 1 Å of the molecular dynamics peak coordinate. The molecular dynamics peak water density is displayed (c; one versus two cryo-EM maps: P = 1.0 × 10−4; one or two versus no cryo-EM maps: P = 1.2 × 10−14); statistics are as in panel a. The black dashed line is the density of bulk water. For each molecular dynamics water-binding site found in both or one cryo-EM map, the cryo-EM peak density is plotted against the molecular dynamics peak water density; the contours display the 5%, 25%, 50%, 75% and 95% probability densities from kernel density estimation (d). Pearson’s correlation coefficient and P value, two-sided hypothesis test for 0 correlation, are reported (P = 3.2 × 10−19). e,f, For each molecular dynamics water-binding site, the proportion of time that any water occupied that site (e; P = 2.9 × 10−4) and the RMSF of the waters found at that binding site (f; P = 2.5 × 10−8) across all simulations are plotted against the molecular dynamics peak water density, as displayed in panel d. Significance is reported as: *P < 0.05, ***P < 10−6 and ****P < 10−8.
Fig. 5
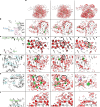
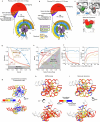
Fig. 5. Diffuse cryo-EM densities and molecular dynamics water networks.
Comparison of density features surrounding the RNA (red) between the cryo-EM maps and molecular dynamics. The first column labels the nucleotides in the region, coloured according to domains from Fig. 1. The second and third columns are the 2.2 Å and 2.3 Å cryo-EM densities, respectively, at 3σ at least 1.8 Å away from the RNA coloured in transparent green (within 2.5 Å of a Mg2+ ion) and red (remainder of density). The models are displayed in white, with the SWIM modelled Mg2+ ion as green spheres and water as red spheres. The final column is the predicted density from molecular dynamics after local alignment (Methods). Water (dark red at 101 M, light red at 68 M), Mg2+ ion (dark green at 46 M, light green at 14 M) and Na+ ion (dark purple at 28 M, light purple at 14 M) densities are displayed. The 2.2 Å RNA is pictured in white for reference. a, Densities of water and ions around the RNA for a global view of the ribozyme. bf, Specific regions of interest, showing water networks along the groove of helices and around the backbone (b), a network of waters around the backbone of P6a (c), water networks surrounding the catalytic core (d,e) and a water wire bridging the backbone of two RNA helices (f). The black circle (c) highlights a density feature in cryo-EM and molecular dynamics simulations whose irregular shape precluded SWIM assignment of an atomically ordered water. A density of unknown identity in the binding site for the guanine substrate is circled in black (d,e). See Supplementary Video 2 to visualize the 3D context of panels be.
Extended Data Fig. 1
Extended Data Fig. 1. Workflow and quality of single-particle cryo-EM analysis of Tetrahymena ribozyme.
(a) Representative motion-corrected cryo-EM micrograph. (b) Reference-free 2D class averages of computationally extracted particles. (c) Workflow of image processing. (d-e) Euler angle distribution of the particle images for (d) 2.2 and (e) 2.3 Å maps. (f-g) Gold standard FSC plots for the final 3D reconstruction, calculated in CryoSPARC for (f) 2.2 Å and (g) 2.3 Å maps. (h-i) Plots of particle number against the reciprocal squared resolution for (h) 2.2 Å and (i) 2.3 Å maps. The B-factor was calculated as twice the linearly fitted slope and the R2 value is reported.
Extended Data Fig. 2
Extended Data Fig. 2. Structure quality of the Tetrahymena ribozyme cryo-EM maps.
(a) Visual inspection of the structure quality of the 2.2 Å map at different contour levels. (b) Four representative nucleotides extracted from the 2.2 Å map with high Q-scores. Each nucleotide is displayed at two density contour levels. The Q-scores for each nucleotide (gray), the backbone (orange), and the base (blue) are shown. The directional orientation of exocyclic nitrogen and oxygen densities pointing out of the bases allowed for differentiation of adenine and guanine. However, distinguishing cytosine and uracil remained difficult because their only difference lies in the exocyclic N4 (cytosine) or O4 (uracil) position. Unambiguously distinguishing between cytosine and uracil may require a resolution closer to 1 Å; for example, the difference between oxygen and nitrogen atoms becomes clear in the 1.34 Å cryo-EM map of the protein apoferritin. When visually examining each nucleotide, densities of the backbone were less pronounced than the base. (c) Plots of per-nucleotide Q-score (rolling 10 nt average) separated by part of the nucleotide, with base in blue and the backbone in orange. The backbone was further split into the ribose sugar (green), oxygens attached to the phosphorus (pink), and phosphorus (yellow) represented by dotted lines. Nucleotide numbering, x-axis, is colored by domain matching Fig. 1. The Q-score confirmed quantitatively that resolvability is better for the bases than the backbone across the majority of the 2.2 and 2.3 Å maps. In a previous 3.1 Å map (EMDB-31385, PDB: 7ez0), the base and backbone were equally resolved, indicating that increasing the resolution to ~2.3 Å is particularly important to accurately model base orientations and hence increased confidence in modeling water interactions.
Extended Data Fig. 3
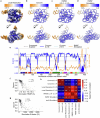
Extended Data Fig. 3. Domain level variability in map quality and molecular flexibility.
(a) Local resolution as calculated by cryoSPARC is colored from high local resolution (blue) to low local resolution (orange) on the sharpened 2.2 Å map at 3σ threshold. (b) The 2.2 Å model is colored by regions of high Q-score (blue) and low Q-score (orange). Several factors may contribute to the variation in local resolution and atomic resolvability, including specimen preservation, radiation damage, inherent flexibility, charge distribution, and spatial geometry. Due to the repeated structural arrangement and relatively uniform solvent accessible of RNA, we hypothesized that inherent flexibility was the major source of variation in local resolution and atomic resolvability across the ribozyme. (c-d) Flexibility of the structure with flexible regions colored orange, as indicated by (c) Root Mean Square Deviation (RMSD) of all heavy atoms between the 2.2 and 2.3 Å models, and (d) Root Mean Square Fluctuation (RMSF) of all heavy atoms estimated from 30 400 ns MD simulations. (e) Plot of per-residue Q-score and RMSF with domain colors matching Fig. 1. (f-g) For each nucleotide, (f) the RMSF of the simulations and (g) the B-factor of the simulations (8π23RMSF2) of the nucleotide in MD simulation is plotted against the average Q-score of the nucleotide in the 2.2 and 2.3 Å model. Spearman’s rank correlation coefficient is reported, with a strong statistically significant negative correlation, calculated with a two-sided hypothesis test for no ordinal rank between the variables (P = 1.1 × 10−116), supporting the hypothesis that inherent flexibility is the primary attribute explaining poor resolvability in peripheral regions of the ribozyme. The 2.2 and 2.3 Å models differed most in these poorly resolved, highly flexible regions; the classification scheme used in the image processing successfully distinguished the differences in the highly flexible regions of the RNA. (h) The Spearman’s rank correlation coefficient was calculated between pairs of per-residue values, including the additional values of average local resolution value at the nucleotide position, RMSD between the 2.2 and 2.3 Å models, and the Q-score of the average structure from simulation in a simulation density map (simQ).
Extended Data Fig. 4
Extended Data Fig. 4. Assessment of SWIM criteria.
(a-h) Assessment of the SWIM criteria on ~89,000 randomly sampled positions in the solvent shell (1.8–3.5 Å away from RNA that has a Q-score > 0.6 indicating high reliability of the RNA model) in the (a,c,e,g) 2.2 and (b,d,f,h) 2.3 Å maps. The distribution of (a-d) Q-score in each half-map, (e-f) Q-score in full map, and (g-h) map density-value are plotted. Cutoff values used for SWIM in this study are labeled with a gray dotted line (0.70 Q-score in full and half maps and 5σ above map mean value). The percent of randomly sampled solvent shell positions above these thresholds are labeled black. Then combining the criteria, the red number reports the number of positions that pass all the SWIM criteria. Our analysis showed that the SWIM criteria are stringent; only 0.6% of positions in the solvent shell of the maps pass all SWIM criteria. (i) The SWIM criteria are systematically varied, the number of waters identified in each map, the number of consensus waters between the two-map and the F1-score between the set of waters identified in the two maps are reported. (j-k) Distribution of Q-scores for SWIM-modeled water and Mg2+ ions. Expected Q-score at resolution for water and ion labeled as gray dashed line and the SWIM imposed Q-score threshold is labeled as a black dashed line. (l-m) As in J-K, but the water and Mg2+ ions are split by the number of interacting (<3.5 Å) RNA atoms. A trend shows an increase in Q-score with more interacting atoms but the trend is not statistically significant (linear regression, two-sided t = 1.826, p = 0.067). (n-o) Distribution of distances between water and Mg2+ ion and nearest atom. Thresholds used by SWIM are labeled as a black dashed line.
Extended Data Fig. 5
Extended Data Fig. 5. Comparison of SWIM-modeled water and Mg2+ ions to previous models.
(a-e) Comparing the waters and Mg2+ ions modeled in (a,d) the 2.2 Å model to the 2.3 Å model, (b) the 2.2 and 2.3 Å models to ~3 Å cryo-EM models,,,, and (c,e) the 2.2 and 2.3 Å models to X-ray models,,. Water and Mg2+ ions that bind the same RNA atoms (criterion 1) and are within 1 Å after local superposition (criterion 2) are red and green, respectively; only meet criterion 1 are orange and purple, respectively; those that only meet the criterion 2 are brown and blue, respectively; those that bind one of the same RNA atoms are light orange and light purple, respectively and those with no overlap are white. RNA is colored by model overlap as evaluated by (a,b,d) average RMSD between structures and (c,e) the number of models that contain each nucleotide (since the X-ray structures are not the full length ribozyme). (f-g) Consensus of (f) Mg2+ ion and (g) water from the structures in this study and previous structures. The diagonal of the plot notes how many water or Mg2+ ions pass the current distance criteria used in this study (2.5 Å and 3.5 Å respectively), only these Mg2+ ions and water are compared. Note that although other structures did model Mg2+ ions that bind RNA in their second coordination shell (through a water), these were not considered. On the off diagonal the number of water or Mg2+ ions bound to the same RNA atoms is reported and colored by the percent of the total water or Mg2+ ions from the reference structure on that row. The final rows and columns of (F) compare to the 34 Mg2+ ions in both the 2.2 or 2.3 Å models, 94 Mg2+ ions in either the 2.2 or 2.3 Å models, the 138 Mg2+ any previous cryo-EM model with resolution better that 3.2 Å, the 299 Mg2+ in any previous cryo-EM models, and the 50 Mg2+ found in any X-ray models. The final rows and columns of (G) compare to the 268 waters in both the 2.2 and 2.3 Å models, 536 waters in either the 2.2 and 2.3 Å models, and the 229 waters found in any X-ray models.
Extended Data Fig. 6
Extended Data Fig. 6. Water and Mg2+ ion binding sites.
Water (red spheres) and Mg2+ ions (green spheres) found in both cryo-EM maps are displayed. Only some of the contacts for each water molecule and Mg2+ ion may be shown in each case. (a-j) highlight a selection of regions from the 2.3 Å map and model. The identical regions but in the 2.2 Å map and model can be found in Fig. 3. (a) Mg2+ ion found in previous X-ray and cryo-EM structures, which binds the phosphates of U273 and A256. (b) A water anchors the base of A183 in the P5a domain to the P5c domain by bridging the amine (N6) of A183 to the phosphate of U168. This water was previously modeled in chain B of the crystal structure 1hr2. (c) The backbone of A183 is further involved in the previously described metal ion core in the A-rich bulge of domain P5a. The second Mg2+ ion of the metal ion core was also modeled in both maps (not shown). Mg2+ ions are integral to folding of the P4-P6 domain, shielding the negative charge of the phosphate backbone. (k-m) There were additional peaks, present in both maps, that raised more ambiguity in assignment, particularly Mg2+ ions bound to sugars. (k) SWIM modeled a density peak 2.2/2.4 Å away from the 2’ hydroxyl group of the G313 sugar which was too close for water so, due to limitations mentioned previously, we have modeled it as a Mg2+ ion, although the identity could be a different ion. (l) SWIM identified a peak in both maps that is 2.1/2.3 Å away from a 2’ hydroxyl suggesting a Mg2+ ion, but 2.7/2.8 Å away from a phosphate, suggesting a water. SWIM would have modeled a Mg2+ ion, but this position was too near to another Mg2+ ion, so this position was left unmodeled. This position was modeled as a water in a crystal structure of the P4-P6 domain (PDB: 1hr2). (m) Elsewhere in the model, a peak is observed in a similar chemical environment to (l) although the longer bond length clearly identifies this peak as water. This water displayed how, even within a region where nucleotides do not interact directly, water bridges the backbone of nucleotides to stabilize the RNA fold which brings these nucleotides in close proximity. Finally, (n-p) show the same regions in the 2.2 Å, 2.3 Å, and 3.1 Å (EMDB-31385, PDB: 7ez0) maps with contour noted below each panel and possible binding sites are marked with a *.
Extended Data Fig. 7
Extended Data Fig. 7. Analysis of water and ion RNA binding motifs.
To obtain an overview of chemical binding motifs identified in cryo-EM maps of RNA in vitreous ice, we compared the prevalence of binding motifs of water and Mg2+ ions from the consensus waters and ions between the two cryo-EM maps presented here, the MD simulations, and a published curated set of 489 X-ray PDB structures with 15,334 Mg2+ ions called MgRNA. (a) Diagram of atoms in RNA backbone and nucleotides. (b-c) The frequency of binding motifs for (b) Mg2+ ions and (c) water defined as RNA atoms within a 2.5 and 3.5 Å distance, respectively. The cryo-EM counts are labeled for consensus and the maps individually, the number of unique Mg2+ and water binding sites in MD, for Mg2+, the binding counts in the curated set of PDB Structures MgRNA, and finally the binding site count in just P4P6 (PDB 1HR2 and 1GID,). It is colored by percent frequency of that interaction type. (d) Same as (b-c) but now separated by every atom type. Our cryo-EM structures bind single phosphate more frequently than multiple phosphates whereas the PDB contains more Mg2+ ions bound to multiple phosphates. But when limiting the PDB dataset to just the P4-P6 subdomain of the ribozyme, there are similar binding preferences between cryo-EM, MD, and previous experimental results,, indicating that motif frequencies are dependent on the RNA probed and are consistent across techniques for the Tetrahymena ribozyme. (e) In red is the average cryo-EM density (>1.8 Å from modeled RNA) and the average MD density for the same residues as calculated from 30 400 ns simulations for every A, U, G, and C in the ribozyme respectively.
Extended Data Fig. 8
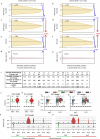
Extended Data Fig. 8. Analysis of overlap solvent shell density.
(a-b) Description of how SWIM-assigned waters (a) from the 2.2 Å model match the 2.3 Å model and map and (b) water from the 2.3 Å model match the 2.2 Å model and map. The top pie chart describes how the waters overlap with waters or ions in the other model after a local superposition, with red indicating overlap, same binding site and superimposable, with water in the other model, orange indicating the same binding site only and brown indicating superimposable only (Methods). Likewise for Mg2+ ions in the other model, the same categories are colored green, purple, blue respectively. For the waters with no overlap in the model, the bottom pie chart describes whether the water when placed in the other map has a geometry (purple), density value (> 5σ, green), and/or resolvability (Q-score > 0.70, blue, brown, yellow for full, both half maps, one half map respectively) that pass the SWIM criteria. (c) A specific example of how a Mg2+ ion can overlap with a water displayed as in Fig. 5. The cryo-EM densities have the star-shaped shape indicative of a Mg2+ ion with a full-coordination shell. The MD agrees that this site contains a Mg2+ ion coordinated to the two phosphate and 4 waters. Due to the blurring of density automated SWIM identified two different peak positions within the diffuse density, and modeled a Mg2+ ion in the 2.2 Å map and a water in the 2.3 Å map. (d–i) The agreement between the reference map, the 2.2 Å cryo-EM map, and the comparison maps, 2.3 Å cryo-EM map (blue), 2.2 Å model (orange; created by molmap), the MD water density (red), and the 2.2 Å cryo-EM map with the voxel values shuffled (gray). The blue line represents experimental uncertainty while the gray represents performance of a random algorithm. Voxels are defined as “positive” if they have a value above the given contour, 3σ for (d-e), in the reference map and “negative” otherwise. Other metrics are tabulated in Supplementary Table 2. (d-e) The contour of the comparison map is varied to plot (d) Precision-recall (PRC) and (e) receiver operating characteristic (ROC) curves. The Area Under the Curve (AUC) is labeled. (f) The AUC is calculated for a variety of reference map, the 2.2 Å cryo-EM map, contours and for the solvent shell. Trends are consistent over reasonable contours of the reference map, the 2.2 Å map. (g) The model is colored by per-nucleotide experimental precision, defined as the AU-PRC for the independent map. This shows precision decreasing radially from the center of mass of the molecule. (h-i) The local agreement of (h) the SWIM model and (i) the MD density to the reference map, the 2.2 Å cryo-EM map, is plotted, normalized AU-PRC such that a score of 1 is equal to experimental uncertainty (see Methods). The normalized AU-PRC is plotted on the structure with a view of the catalytic core (top) and the tetraloop receptor (bottom), from low agreement (red) to high agreement (blue). Nucleotides with water structure with high experimental uncertainty (AU-PRCexp < 0.2) are white.
Extended Data Fig. 9
Extended Data Fig. 9. Molecular dynamics simulation stability and water and ion characteristics.
(a) Root-mean-square deviation (RMSD) of snapshots (1 ns) of the MD simulations from the initial 2.2 Å (blue) model and the 2.3 Å (red) model in solid and the 20 ns moving average in light. The top row is from 10 simulations using the DESRES forcefield, the second and third row using the parmBSC0χOL3 force field with the mMg and nMg Mg2+ parameters respectively. The first six columns have extra ions initially randomly placed, the last four columns have extra ions initially placed electrostatically. The simulations were stable as measured by the high similarity to both the cryo-EM structures throughout the 400 ns simulation. The simulations were not biased towards the simulation starting conformation, 2.2 Å model, as seen by the overlap of red and blue lines. Therefore, the simulations were used to interpret both the 2.2 and 2.3 Å cryo-EM structures. (b) Secondary structure diagram of the starting coordinates with each starting interaction colored by what percent of time, through all simulations, the interaction is present. All simulations maintained their tertiary structure except for three (10%) simulations where the P9-P5 interaction broke and P9 shifted away from the core; frames with these high deviations to cryo-EM structures were excluded from further analysis. The MD simulations described above were conducted in explicit solvent and included Mg2+ and Na+ ions. (c) Density plot of minimum distance between Mg2+ ions (green), Na+ ions (purple), or waters (red) and RNA in all molecular dynamics simulations split by force field used (for each force field, 400 ns simulations, N = 10). Waters past 3.5 Å were not measured. The water and Mg2+ ions exhibited expected bond lengths to RNA; water peaked at 2.7−2.8 Å while Mg2+ ions peaked between 1.9 and 2.1 Å in the first shell and at ~4 Å in a second coordination shell. The force fields used differed most in their parameterization of Mg2+ ions where mMg and nMg force fields were designed to enable faster Mg2+ ion exchange to increase sampling of Mg2+ binding,. (d) For each MD Mg2+ ion binding site which is bound to a phosphate, the residence time of a single binding event is plotted against the total occupancy of Mg2+ ions at that binding site. The simulations are separated by force field (rows). We affirmed the difference between force fields; Mg2+ ions resided for shorter times when bound to phosphates and carbonyls of the RNA in the mMg and nMg force fields than the DESRES force field where Mg2+ ions bound to phosphates rarely unbind in the 400 ns time of simulation. (e) The mean water density in the MD simulations (red) is plotted for each water binding site found in the 2.2 or 2.3 Å maps. The highest density within 1 Å of the cryo-EM coordinate was reported. A density value of 55 M is equivalent to the density of bulk water (black line). The minimum and maximum density value between the three force fields used is plotted as error bars. The mean densities, and range of densities across force fields, of Mg2+ ions (green) and Na+ ions (purple) ions are also plotted for these binding sites. (f) Comparison of concentration of Mg2+ ions (green) and Na+ ions (purple) from simulation (dotted horizontal lines) and expected local concentration (solid line) based on non-linear Poisson-Boltzmann theory (NLPB) with APBS using the bulk concentration used in the experiment (dotted horizontal line on right of plot). The shaded error bar represents the 95% confidence interval. The concentration of Na+ ions used in MD simulation is slightly greater than the expected cumulative concentration of Na+ ions from NLPB theory (dotted curve), which is itself known to overpredict bound Na+ ions relative to competing Mg2+ ions in nucleic acids’ ion atmospheres. This observation suggests that MD simulations are unlikely to be underestimating the density of Na+ ions bound to RNA. Combined with the observation of only a handful of Na+ binding sites in MD simulations, this analysis suggests that very few of the cryo-EM density features surrounding the ribozyme should be attributed to Na+ ions. This analysis supports our approximation that those map features are either water or Mg2+ ions, which greatly outnumber Na+ ions.

Update of

References

    1. Meyer, E. Internal water molecules and H-bonding in biological macromolecules: a review of structural features with functional implications. Protein Sci.1, 1543–1562 (1992). - PMC - PubMed
    1. Hermann, T. & Patel, D. J. Stitching together RNA tertiary architectures. J. Mol. Biol.294, 829–849 (1999). - PubMed
    1. Laage, D., Elsaesser, T. & Hynes, J. T. Water dynamics in the hydration shells of biomolecules. Chem. Rev.117, 10694–10725 (2017). - PMC - PubMed
    1. Auffinger, P. & Westhof, E. Hydration of RNA base pairs. J. Biomol. Struct. Dyn.16, 693–707 (1998). - PubMed
    1. Egli, M., Portmann, S. & Usman, N. RNA hydration: a detailed look. Biochemistry35, 8489–8494 (1996). - PubMed

LinkOut - more resources