. 2025 Mar 11;16(1):2414.
doi: 10.1038/s41467-025-57364-x.

Proteogenomic characterization reveals tumorigenesis and progression of lung cancer manifested as subsolid nodules

Affiliations

Proteogenomic characterization reveals tumorigenesis and progression of lung cancer manifested as subsolid nodules

Hang Su et al. Nat Commun. .

Abstract

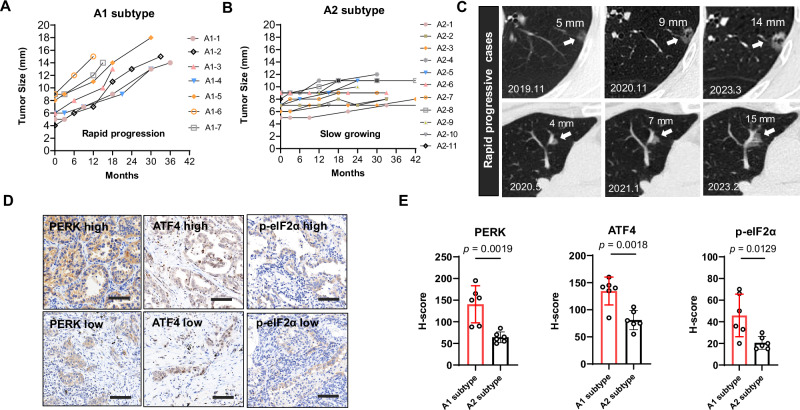
Lung adenocarcinoma (LUAD) radiologically displayed as subsolid nodules (SSNs) is prevalent. Nevertheless, the precise clinical management of SSNs necessitates a profound understanding of their tumorigenesis and progression. Here, we analyze 66 LUAD displayed as SSNs covering 3 histological stages including adenocarcinoma in situ (AIS), minimally invasive adenocarcinoma (MIA) and invasive adenocarcinoma (IAC) by incorporating genomics, proteomics, phosphoproteomics and glycoproteomics. Intriguingly, cholesterol metabolism is aberrantly regulated in the preneoplastic AIS stage. Importantly, target ablation of proprotein convertase subtilisin/kexin type 9 (PCSK9) promotes the initiation of LUAD. Furthermore, sustained endoplasmic reticulum stress is demonstrated to be a hallmark and a reliable biomarker of AIS progression to IAC. Consistently, target promotion of ER stress profoundly retards LUAD progression. Our study provides comprehensive proteogenomic landscape of SSNs, sheds lights on the tumorigenesis and progression of SSNs and suggests preventive and therapeutic strategies for LUAD.


Conflict of interest statement

Competing interests: The authors declare no competing interests.

Figures

Fig. 1
Fig. 1. Proteogenomic Landscape of Lung Adenocarcinomas Manifested as Subsolid Nodules.
A Radiological and histological developmental stages from lung preneoplasia to invasive adenocarcinoma (IAC) manifested as subsolid nodules. From left to right, adenocarcinoma in situ (AIS), minimally invasive adenocarcinoma (MIA) and IAC in that order. Each image is representative of 17 AIS, 24 MIA, and 25 IAC. Scale bar, 50 μm. B Histogram showed the multi-platform data and clinical profiles in this study. White gaps in the schematic represent missing data. CE The number of the identified proteins, phosphosites, and glycopeptides per tumor sample and paired normal adjacent tissue (NAT). F A scatter plot showing the number of glycans identified per glycoprotein versus. the number of glycosites identified for that protein. An y = x line is shown in gray to provide an eye guide for proteins that had a particularly high number of glycans relative to the number of glycosites identified. G Distribution of the number of glycosites per glycoprotein identified. H Distribution of the number of different glycans seen at a given glycosite. I The genomic profiles grouped by histologic stages. bottom: clinical profiles of the patients. Mutation types are demonstrated by a bar plot in the right panel. J Mutational burden. Each dot represents the mutational burden in each tumor (p values were calculated by the two-sided Wilcoxon test). (AIS, n = 17; MIA, n = 24, IAC, n = 25). p = 0.31, AIS versus MIA; p = 0.58, MIA versus IAC; p = 0.2, AIS versus IAC. In the box plot, the center line represents the median, and the box bounds represent the inter-quartile range.
Fig. 2
Fig. 2. Connecting Driver Mutations to Proteome, Phosphoproteome, glycoproteome and Pathways.
AC Significant (FDR < 0.05, Wilcoxon rank-sum test) cis and trans effects of selected mutations (x axis) on the expression of cancer-associated proteins (A), phosphorylation (B) and glycosylation (C). (n = 66). D SHP2 phosphorylation levels in the EGFR mutant cell line (PC-9) and EGFR wild type cell lines (A549, NCI-H226, and NCI-H1730). (n = 3). E Box plots showing phosphorylation of PTPN11 Y62 and glycosylation of SUSD2 N494 in EGFR mutant and wild type (WT) samples in the progression from AIS to IAC. A two-sided Wilcoxon rank-sum test was used. (AIS, n = 17; MIA, n = 24, IAC, n = 25). PTPN11 Y62: p = 0.077 (AIS), p = 0.043 (MIA), p = 0.015 (IAC). SUSD2 N494_N75: p = 0.156 (AIS), p = 0.036 (MIA), p = 0.733 (IAC). SUSD2 N494_N31: p = 0.509 (AIS), p = 0.049 (MIA), p = 0.34 (IAC). In the box plot, the center line represents the median, and the box bounds represents the inter-quartile range.
Fig. 3
Fig. 3. Multi-omics Analysis of Lung Adenocarcinomas for Therapeutic Intervention and Early Detection.
A Integrative classification of tumors into three non-negative matrix factorization-derived clusters (multi-omics cluster 1 [C1] to cluster 3 [C3]). Within each cluster, tumors are sorted by cluster membership scores, decreasing from left to right. The heatmap shows the top 50 differential proteins, phosphoproteins, and glycosylated proteins for each multi-omics cluster. B Selection of the top 250 upregulated intact glycopeptides in each cluster (p < 0.05) for the analysis of glycan distribution within tumor clusters. If the number falls below 250, all qualifying features were included (Fisher’s exact test). (n = 66). C The hierarchal-clustered correlation matrix of intact glycopeptides and glycosylation enzymes. The glycan types and relative abundance of intact glycopeptides among three multi-omics tumor clusters were highlighted in the top rows. The relative abundance of protein expression of selected glycohydrolases among the tumor clusters were represented in the left. D Correlation between six selected glycohydrolases and intact glycopeptides with/without paucimannose glycans (paucimannose and others). A two-sided Wilcoxon rank-sum test was used. Sixty-six tumor samples and paired normal adjacent tissues (NATs) were used in the analysis. p = 0.021 (GBA), p = 0.0044 (GUSB), p = 0.0008 (GLA), p = 0.00023 (FUCA1), p = 0.00014 (HEXB), p = 0.001 (HEXA). E Median phosphosite fold change compared to the protein fold change in adenocarcinoma in situ (AIS) tumor compared to normal adjacent tissues (NATs). F The abundance changes of global protein expression (left panel) and phosphosite of fibroblast growth factor receptor 3 (FGFR 3) in NATs, AIS, minimally invasive adenocarcinoma (MIA) and invasive adenocarcinoma (IAC). A two-sided Wilcoxon rank-sum test was used. (AIS, n = 3; MIA, n = 5, IAC, n = 6, NATs, n = 14). FGFR 3: p = 0.66 (AIS), p = 0.48 (MIA), p = 0.024 (IAC). FGFR 3: p = 0.66 (AIS), p = 0.48 (MIA), p = 0.024 (IAC). FGFR3-S408D: p = 0.001 (AIS), p = 0.00024 (MIA), p = 0.018 (IAC). G The effects of FGFR3-WT, FGFR3-S408D, and FGFR3-S408A on AKT, PI3K, and mTOR phosphorylation levels in PC-9 cells. The numbers below the gel lanes represent the pAKT/AKT protein level. (n = 3). H Heatmaps showing the kinase activity score of selected kinases. Food and Drug Administration (FDA)-approved drug targets were indicated with a red arrow. In the box plot D and F, the center line represents the median, and the box bounds represents the inter-quartile range.
Fig. 4
Fig. 4. Proteogenomic characterization reveals tumorigenesis of lung preneoplasia.
A, B KEGG enrichment analysis of adenocarcinoma in situ (AIS) compared to paired normal adjacent tissues at proteomic (A) and phosphoproteomic (B) levels (Fisher’s exact test) (AIS, n = 17). C Cholesterol metabolic pathway and the expression of target molecules on the pathway by pathview analysis. Red arrows indicated the up-regulated proteins at proteomic level. D The effects of PCSK9 knockdown on LDLR and PCSK9 levels in HCA2-TERT cells. (n = 3). E, F Soft agar assays of anchorage-independent colony formation of HCA2-TERT cells transfected with vectors encoding SV40 large tumor antigen (LT) and HRAS V12 (Ras) together with shCtrl or shPCSK9 followed by plating in soft agar. E 2 × 10⁵ cells were plated in 0.4% Noble agar and colonies were counted 5 weeks after seeding. Each image is representative of 15 fields from 3 independent experiments. F Quantitative data of E. (two-sided Student’s t-test, mean ± SD). n = 3. p = 0.0206 (shPCSK9-1), p = 0.0229 (shPCSK9-2). Scale bar, 90 μm. G Schematic illustration of the workflow for establishing organoids from Kras-LSL-G12D mice lung tissues. H Representative images from bright-field microscopy of organoids after 7 days of culture. Scale bar, 100 μm. I The morphological and histological characteristics (surfactant protein C, SPPTC) of the organoids at day 7. Scale bar, 100 μm. J The organoids were infected with adenovirus-Cre in the absence or presence of PCSK9 inhibitor (Tafolecimab). Scale bar, 100 μm. K The number of organoids formed in the indicated group after infected with adenovirus-Cre 3 weeks. (two-sided Student’s t-test, mean ± SD). n = 3. p = 0.0083. L Bar graph showing quantifications of the diameter in organoids with indicated groups. (two-sided Student’s t-test, mean ± SD). n = 19. p = 0.0022. M The morphology of the organoids formed in the PCSK9 inhibitor group and control group. Scale bar, 100 μm. N Representative images of SFTPC, EpCAM and HMGB1 and Ki 67 on the organoids in PCSK9 inhibitor group and control group by immunohistochemistry (IHC). Scale bar, 100 μm. O Quantitative data of N. (two-sided Student’s t-test, mean ± SD). n = 3. p = 0.0005 (SFTPC), p = 0.0159 (EpCAM), p = 0.0421 (HMGB1), p = 0.0067 (Ki 67). P Association of total cholesterol and risk of lung cancer among 109,884 participants in the Kailuan cohort from 2006-2014. Each image is representative of one organoid from 3 independent experiments in (I, M, N). Each image is representative of 9 fields from 3 independent experiments in (H) and (J). C and G were created in BioRender.
Fig. 5
Fig. 5. Endoplasmic reticulum stress is a hallmark and drug target of ais progress to IAC.
A The differentially regulated proteins, phosphosites and intact glycopeptides between tumors and paired normal adjacent tissues (NATs) and the pathways. B Growth curve of tumors formed by patient-derived xenografts (PDX) from lung adenocarcinoma (PDX-P1) left untreated or treated with CCF642 in BALB/c Nude mice. n = 6 mice per group. p = 0.043. C The effects of CCF642 on the survival of PDX-Bearing mice in (B). Log-rank test was used. n = 6 mice per group. p = 0.0005. D Growth curve of tumors formed by PDX from another lung adenocarcinoma (PDX-P2) left untreated or treated with CCF642 in BALB/c Nude mice. n = 6 mice per group. p = 0.0006. E The effects of CCF642 on the tumor weight formed by PDX (PDX-P2). n = 6. p = 0.0027. F Tumors formed by PDX-P2 implantation left untreated or treated with CCF642 in BALB/c Nude mice. G Drug-response profile of patient-derived tumor-like cell clusters (PTCs) from seventeen lung adenocarcinoma under CCF642. H Growth curve of tumors formed by allografted WT (Lewis Lung Carcinoma) LLC cells left untreated or treated with CCF642 in C57BL/6 mice. n = 7 mice per group. p <0.0001. I The effects of CCF642 on the tumor weight formed in H. n = 7. p = 0.0422. J Tumors formed by allografted WT LLC cells left untreated or treated with CCF642 in C57BL/6 mice (K) The effects of CCF642 on cell proliferation in LLC cells. (two-sided Student’s t-test, mean ± SEM, n = 3). p = 0.0002. L The effects of Pdia3 knockdown on Pdia3 levels in LLC cells. (n = 3). M The effects of Pdia3 knockdown on cell proliferation in LLC cells. (two-sided Student’s t-test, mean ± SEM, n = 3). p = 0.002. N Growth curve of tumors formed by WT and Pdia3 knockdown LLC cells in C57BL/6 mice. n = 5 mice per group. p = 0.055. O The effects of Pdia3 on the tumor weight formed in (N). n = 5. p = 0.0078. P Tumors formed in N. Two-way ANOVA followed by Tukey’s post hoc test, mean ± SEM, was used for B, D, H, N. Two-sided Student’s t-test, mean ± SD, was used for E, I, O.
Fig. 6
Fig. 6. Endoplasmic reticulum stress is a hallmark of AIS progress to IAC in the clinic.
A, B Growth curve of lung adenocarcinoma manifested as SSNs in A1 and A2 subtype by tumor size on CT scans. A1 subtype: n = 7, A2 subtype: n = 11. C Representative CT scans of rapidly progressing cases. Top: All images presented are representative of one tumor among seven tumors classified as A1 subtype. Bottom: All images presented are representative of another tumor among seven tumors classified as A1 subtype. D Representative immunohistochemistry (IHC) stains of PERK, ATF4 and p-eIF2S1 of A1 and A2 subtype tumors. Each image is representative of 30 fields from 6 samples. Scale bar, 100 μm. E The quantification data of PERK, ATF4 and p-eIF2S1 of A1 and A2 subtype tumors. Two-sided Student’s t-test, mean ± SD. n = 6 tumors per group. p = 0.0019 (PERK), p = 0.0018 (ATF4), p = 0.0129 (p-eIF2α).

References

    1. Walter, J. E. et al. New subsolid pulmonary nodules in lung cancer screening: the nelson trial. J. Thorac. Oncol.13, 1410–1414 (2018). - PubMed
    1. Zhang, Y., Fu, F. & Chen, H. Management of ground-glass opacities in the lung cancer spectrum. Ann. Thorac. Surg.110, 1796–1804 (2020). - PubMed
    1. Choi, S., et al. Importance of Lymph Node Evaluation in </=2-cm Pure-Solid Non-Small Cell Lung Cancer. Ann. Thorac. Surg.117, 586–593 (2023). - PubMed
    1. Ye, T. et al. Lung adenocarcinomas manifesting as radiological part-solid nodules define a special clinical subtype. J. Thorac. Oncol.14, 617–627 (2019). - PubMed
    1. Flores, R. M. et al. Computed tomography screening for lung cancer: mediastinal lymph node resection in stage ia nonsmall cell lung cancer manifesting as subsolid and solid nodules. Ann. Surg.265, 1025–1033 (2017). - PMC - PubMed

MeSH terms