. 2025 Mar 11;16(1):2416.
doi: 10.1038/s41467-025-56898-4.

VDAC2 and Bak scarcity in liver mitochondria enables targeting hepatocarcinoma while sparing hepatocytes

Affiliations

VDAC2 and Bak scarcity in liver mitochondria enables targeting hepatocarcinoma while sparing hepatocytes

Shamim Naghdi et al. Nat Commun. .

Abstract

Differences between normal tissues and invading tumors that allow tumor targeting while saving normal tissue are much sought after. Here we show that scarcity of VDAC2, and the consequent lack of Bak recruitment to mitochondria, renders hepatocyte mitochondria resistant to permeabilization by truncated Bid (tBid), a Bcl-2 Homology 3 (BH3)-only, Bcl-2 family protein. Increased VDAC2 and Bak is found in most human liver cancers and mitochondria from tumors and hepatic cancer cell lines exhibit VDAC2- and Bak-dependent tBid sensitivity. Exploring potential therapeutic targeting, we find that combinations of activators of the tBid pathway with inhibitors of the Bcl-2 family proteins that suppress Bak activation enhance VDAC2-dependent death of hepatocarcinoma cells with little effect on normal hepatocytes. Furthermore, in vivo, combination of S63845, a selective Mcl-1 inhibitor, with tumor-nectrosis factor-related, apoptosis-induncing ligand (TRAIL) peptide reduces tumor growth, but only in tumors expressing VDAC2. Thus, we describe mitochondrial molecular fingerprint that discriminates liver from hepatocarcinoma and allows sparing normal tissue while targeting tumors.


Conflict of interest statement

Competing interests: C.B.T. is a founder of Agios Pharmaceuticals and a member of the Board of Directors of Regeneron and Charles River Laboratories. The remaining authors declare no competing interests.

Figures

Fig. 1
Fig. 1. Differential sensitivity to tBid-induced cyto c release and ∆ψm loss in primary hepatocytes and liver cancer cell lines.
A Representative time-lapse imaging of TMRE-loaded permeabilized HepG2 and primary rat and human hepatocytes before and 600 s after treatment with truncated Bid (tBid) (25 nM) (Upper panels). Plots (lower panels) show the mean TMRE fluorescence of the cell population in the imaging field. Chemical uncoupler, FCCP (5 µM), was added at the end of each run to fully depolarize the mitochondria. Experiments were repeated three times with similar results. B Representative immunoblots of permeabilized cell suspensions of equal cellular protein aliquots were treated with 25 nM tBid or with 600 μg/ml digitonin for 10 min. Cyto c release from the mitochondria assayed by rapidly separating membrane and cytosolic fractions (upper and lower panels, respectively). Experiments were repeated three times with similar results. C Representative time lapse recordings of ΔΨm in permeabilized cell suspensions by TMRE dequenching. HepG2 and PLC cells and primary human hepatocytes were treated with tBid at the indicated concentrations. Digitonin (600 μg/ml) was added to human hepatocytes as a positive control. Experiments were repeated three times with similar results. D Representative ΔΨm traces of isolated HepG2 mitochondria treated with varying concentrations of tBid measured by Rhod123 quenching (upper panel). Western blot shows the release of cyto c in the supernatant fraction following treatment (lower panel). Experiments were repeated three times with similar results. E Representative ΔΨm traces of isolated mitochondria from rat and mouse liver treated with tBid (25 nM) or oligomeric Bax (150 nM) and western blots of released cyto c from the same experiments. Experiments were repeated three times with similar results. Source data are provided in the Source Data file.
Fig. 2
Fig. 2. Elevated VDAC2 and Bak expression in tBid-sensitive liver tumors.
A Immunoblots of VDAC1, VDAC2 and Bak in the membrane fractions of permeabilized HepG2 and primary rat and human hepatocytes. Prohibitin, an inner mitochondrial membrane protein is used as control of mitochondrial content. Experiments were repeated three times with similar results. B VDAC2 and Bak immunoblots of mitochondria isolated from livers and subcutaneous HepG2 tumor xenografts from the same mouse; Tom40 as loading control; VDAC2 blot is cropped between the 25 and 37 kDa molecular weight markers. Experiments were performed in 5 mice total with similar results. C Immunoblots of VDAC2 in pellets of permeabilized human hepatocytes, HepG2, Huh7, Huh1, and PLC cells; mtHSP70 as loading control. Relative normalized VDAC2 levels are indicated above. Representative images; the experiment was repeated 3 times with similar results. D Heatmap of protein abundances in liver cancer cell lines from quantitative proteomics of the Cancer Cell Line Encyclopedia. Data was extracted via the depmap.org interface. E Images of livers from diethylnitrosamine (DEN)-treated and control mice. F Representative time course ΔΨm measurements of mitochondria isolated from DEN-induced liver tumors and control livers treated with 37 nM tBid. G Immunoblot of cyto c in rapidly separated supernatants (tc: time control). H Immunoblots of VDAC2 and Bak in mitochondria isolated from DEN-induced tumors (left) and Aflatoxin-induced tumors (right) with corresponding control livers; Tim23 as loading control; VDAC2 blots are cropped between the 25 and 37 kDa molecular weight markers. DEN and Aflatoxin experiments (E-H) were performed with two pairs of animals each. Source data are provided in the Source Data file.
Fig. 3
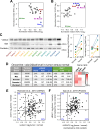
Fig. 3. Elevated VDAC2 and Bak expression in human liver cancer.
A Relative VDAC2 and Bak1 protein levels in 31 normal human tissues by quantitative mass spectrometry, normalized by the estimated mitochondrial content of each tissue. Values for brain samples from cerebellum and cortex and heart samples from atrium and ventricle are indicated. B Relative VDAC1 and VDAC2 protein levels in human tissues, normalized by the estimated mitochondrial content as in (A). C Immunoblots (left) of VDAC2 and Bak in paired HCC and normal tissue samples resected from patients (see Supplementary Table 1); prohibitin as mitochondrial loading control. Quantification of changes in VDAC2:prohibitin and Bak:prohibitin, normalized by the average log2 ratio of the normal samples. Statistical significance from two-sided paired t-test is indicated. SDS-PAGE and immunoblot was performed twice with similar results. D vdac2 and bak gene expression fold increases and percentage ranks in normal versus cancer comparisons across five mRNA databases available from Oncomine as of 2018. At right, heatmap for rank of each gene; hsp9a (mitochondrial HSP70) was used as a mitochondrial gene control. Gray indicates that the transcript was not measured in the Chen study. p values from Wilcoxon Rank Sum test. E Differences in vdac2 and bak mRNA in 214 HCC patients from the Roessler Liver 2 dataset, calculated by subtracting the log2 values (normalized using the Robust Multi-Array Average method and global median centering) in tumor from the value in the liver sample taken from the same patient. Percentages represent the fraction of patients in that quadrant. F Differences in VDAC2 and Bak protein levels (after normalization for mitochondrial content) in 159 paired tumor and liver samples from. Source data are provided in the Source Data file.
Fig. 4
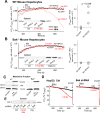
Fig. 4. VDAC2-dependent sensitivity to tBid in hepatocytes and HCC cells.
A Representative time course measurements of ΔΨm in tBid-treated, permeabilized rat hepatocytes infected with adenovirus encoding VDAC2 or GFP (left) and dot plot showing the changes in TMRE fluorescence during the treatment period (n = 4 experiments with 1 or 2 technical replicates per experiment; p = 0.0039, two-tailed t-test). B As in (A) but treatment with 75 nM Bax instead of tBid; n = 2 experiments. C Immunoblot of cyto c in the supernatant fraction from ΔΨm measurements in (A) and (B). D Representative immunoblots of VDAC2 and Bak in membrane fractions and (E) Bax in whole cell lysates of rat hepatocytes infected with Ad-VDAC2 and Ad-GFP. Prohibitin and Actin used as loading controls. VDAC2 blot is cropped between the 25 and 37 kDa molecular weight markers. Experiments were repeated 4 times with similar results. F Representative time course measurements of ΔΨm in permeabilized tBid-treated WT and VDAC2 knockout HepG2 cells. The experiment was repeated twice with similar results G Time course measurements of ΔΨm in permeabilized tBid-treated WT and VDAC2 knockout PLC/PRF/5 cells. The experiment was repeated 4 times with similar results. Source data are provided in the Source Data file.
Fig. 5
Fig. 5. Bak is required for VDAC2-dependent tBid sensitivity.
A Representative time course measurements of ΔΨm in permeabilized mouse hepatocytes infected with adenovirus encoding VDAC2 or GFP and treated with 3.7 nM tBid (left) and dot plot showing the changes in TMRE fluorescence during the treatment period (n = 3 experiments with 1 or 2 technical replicates per condition; p = 0.049, two-tailed t-test). Left inset shows the cyto c release by western blot of the cytosolic fraction. B As in (A) but using hepatocytes of a Bak-/- mouse. High digitonin (600 µg/ml) was used as a reference for cyto c release in the western blot. Dot plot: n = 2 experiments with 1 or 2 technical replicates per condition. C Representative immunoblots of VDAC2 and Bak in the membrane fractions of permeabilized WT and Bak-/- hepatocytes from (A) and (B); Tim23 as loading control; VDAC2 blots are cropped between the 25 and 37 kDa molecular weight markers D Representative time-course ΔΨm measurements in control and Bak shRNA treated HepG2 cells treated with 0.5 nM tBid after removal of the cytosol. Traces are normalized between the initial and fully depolarized (FCCP) values. E Immunoblots of cyto c in the supernatant of the permeabilized control and Bak shRNA treated cells; * indicates an empty lane. (DE) The experiments were repeated 4 times with similar results. Source data are provided in the Source Data file.
Fig. 6
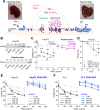
Fig. 6. Selective killing of tumor cells by pharmacological targeting of VDAC2-Bak dependent cell death.
A Schematic representation of the pharmacological targeting strategy-employing an inhibitor of anti-apoptotic Bcl-2 family protein Mcl-1, S63845 together with an activator of the Bid pathway (TRAIL), tumor cells can be selectively killed. B Western blots of cyto c release in intact HepG2 and primary hepatocytes treated with 300 nM S63845 for 48 h with TRAIL (50 or 200 ng/ml) added in the final 3 h. The fraction of release, relative to high digitonin, was estimated by densitometry analysis of the western blot bands (% values above each band). Similar results were found in two biological replicates. C TRAIL dose-response curves of cell viability for HepG2 and hepatocytes with and without 48 h pre-treatment with 300 nM S63845. Cells were treated with TRAIL at the indicated concentrations for 8 h and viability was assessed by imaging propidium iodide exclusion. N = 5 biological replicates (3 technical replicates each) for 0 and 50 ng/ml TRAIL and 4 biological replicates (3 technical each) for 100 and 200 ng/ml TRAIL; statistical significance calculated by two-way ANOVA with Holm-Sidak post-hoc pairwise comparisons; statistically significant interaction between S63845 and TRAIL: p < 0.001. See p-values for pairwise comparisons in Supplementary Data 1. D Time dependence of cell killing by TRAIL (50 ng/ml) in cells with or without S63845 pre-treatment (300 nM, 48hrs). N = 2, 3 and 5 biological replicates at 2 h, 4 h, and 8 h, respectively, with 3 technical replicates within each experiment; statistical significance for the effects of time and S63845 was calculated by two-way ANOVA with Holm-Sidak post-hoc pairwise comparisons; statistically significant interaction between S63845 and time with 50 ng/ml TRAIL: p < 0.001. See p-values for pairwise comparisons in Supplementary Data 1. E TRAIL dose-response curves of WT and VDAC2KO HepG2 cell viability after 48 h pre-treatment with varying concentrations of S63845. Cells were treated with TRAIL at indicated concentrations for 4 h and viability was determined by luminescence assay, normalized to solvent-treated cells (N = 2 biological replicates). F TRAIL dose-response curves of WT and VDAC2KO PLC cell viability after 48 h pre-treatment with varying concentrations of S63845. Cells were treated with TRAIL at indicated concentrations for 4 h and viability was determined by luminescence assay, normalized to solvent-treated cells (N = 3 biological replicates). CF Data are plotted as means ± SEM of multiple experiments; *p < 0.05, **p < 0.01, ***p < 0.001, ns: not significant; details of statistical analyzes and p-values are compiled in Supplementary Data 1. Source data are provided in the Source Data file.
Fig. 7
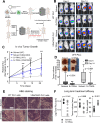
Fig. 7. S63845-TRAIL combination treatment of WT and VDAC2KO tumor xenografts.
A Graphic showing the experimental design for testing S63845-TRAIL combination treatment in vivo. Control and VDAC2KO PLC cells expressing luciferase were injected subcutaneously into the right flank of SCID-NOD mice. The tumor growth was monitored every week using in vivo bioluminescence imaging. After 4 weeks, the animals were either treated with a combination of S63845 and TRAIL or with solvent. Created in BioRender. Hajnoczky, G. (2025) https://BioRender.com/h28f802. B Representative bioluminescence images of the tumors of 3 mice per group before treatment and at 14 d after the start of the treatment period, with constant radiance (p/s/cm2/sr) scale. C Graph showing the change in tumor size from the beginning of the treatment period, measured by bioluminescence flux; Data are shown as means of all animals ± SEM, N = 29 mice for each treatment in the WT PLC group and 9/8 for solvent/S63845 + TRAIL in the VDAC2KO PLC group. ***: p < 0.001, S + TRAIL vs. solvent in WT PLC based on the estimated marginal means with Sidak adjustment multiple comparisons from a general linear model with repeated measures. D Box plots of change in tumor volumes at days 6 and 14 estimated by caliper measurement with representative images of tumor sizes from the solvent and treatment group in the WT PLC group (N = 19/27 mice, solvent/S63845 + TRAIL). Boxes indicate the median, 25th and 75th percentiles, whiskers show 10th and 90th percentiles. p < 0.001 for S63845 + TRAIL vs. solvent overall from two-way repeated measure ANOVA. Holm-Sidak pairwise post-hoc values as indicated. E Representative images of hematoxylin and eosin (H&E)-stained tissue slices of tumors from two mice per group, dissected at 21 d after the start of the treatment period. For each treatment group, 8 samples each from mice injected with WT cells, and 5 each from VDAC2KO were randomly selected for H&E staining (scale bar: 200 µm). F Box plots showing the difference in tumor load as measured by bioluminescence imaging (left) and caliper measurements (middle), and the animals’ body weight (right) as a percentage of Day1 of treatment. (N = 6/8 mice solvent/S + TRAIL; p-values as indicated from two-sided rank sum test). Details of statistical analyzes and p-values for (C, D, F) are compiled in Supplementary Data 1. Source data are provided in the Source Data file.

References

    1. Colombini, M. The VDAC channel: molecular basis for selectivity. Biochimica et. biophysica acta1863, 2498–2502 (2016). - PubMed
    1. Becker, T. & Wagner, R. Mitochondrial outer membrane channels: emerging diversity in transport processes. BioEssays: N. Rev. Mol., Cell. developmental Biol.40, e1800013 (2018). - PubMed
    1. Naghdi, S. & Hajnoczky, G. VDAC2-specific cellular functions and the underlying structure. Biochimica et. biophysica acta1863, 2503–2514 (2016). - PMC - PubMed
    1. Maldonado, E. N. & Lemasters, J. J. Warburg revisited: regulation of mitochondrial metabolism by voltage-dependent anion channels in cancer cells. J. Pharmacol. Exp. therapeutics342, 637–641 (2012). - PMC - PubMed
    1. De Pinto, V., Reina, S., Gupta, A., Messina, A. & Mahalakshmi, R. Role of cysteines in mammalian VDAC isoforms’ function. Biochimica et. biophysica acta1857, 1219–1227 (2016). - PMC - PubMed

MeSH terms

Substances