. 2025 Mar 12;16(1):2446.
doi: 10.1038/s41467-025-57667-z.

Structure and function relationships of mucociliary clearance in human and rat airways

Affiliations

Structure and function relationships of mucociliary clearance in human and rat airways

Doris Roth et al. Nat Commun. .

Abstract

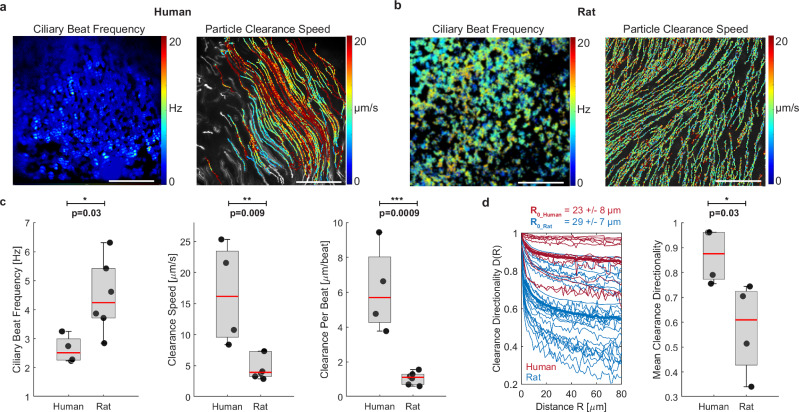
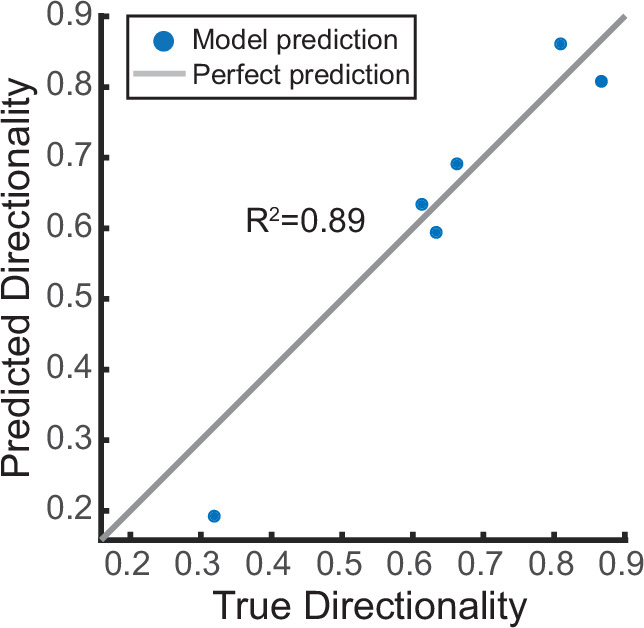
Mucociliary clearance is a vital defense mechanism of the human airways, protecting against harmful particles and infections. When this process fails, it contributes to respiratory diseases like chronic obstructive pulmonary disease (COPD) and asthma. While advances in single-cell transcriptomics have revealed the complexity of airway composition, much of what we know about how airway structure impacts clearance relies on animal studies. This limits our ability to create accurate human-based models of airway diseases. Here we show that the airways in female rats and in humans exhibit species-specific differences in the distribution of ciliated and secretory cells as well as in ciliary beat, resulting in significantly higher clearance effectiveness in humans. We further reveal that standard lab-grown cultures exhibit lower clearance effectiveness compared to human airways, and we identify the underlying structural differences. By combining diverse experiments and physics-based modeling, we establish universal benchmarks to assess human airway function, interpret preclinical models, and better understand disease-specific impairments in mucociliary clearance.


Conflict of interest statement

Competing interests: The authors declare no competing interests.

Figures

Fig. 1
Fig. 1. Luminal epithelial cell type composition differs along the human and rat airway tree.
a Airway branching generations in human and rat investigated in this study included BG0-6 in humans and BG0-5 in rats. b Workflow for imaging luminal epithelial cell type composition and ciliary beat and clearance function in airway samples. Schematic: Created in BioRender. Nawroth, J. (2025) https://BioRender.com/a01i578). c Example IF staining of cilia (ATUB, magenta) and secretory cells (SCGB1A1, green; MUC5AC, gray) in human and rat airway epithelium in BG0 (trachea) and BG5/6. Scale bar: 20 µm. d Quantification of luminal cell proportions labeled with ATUB (ciliated cells) or with MUC5AC and/or SCGB1A1 (secretory cells) as a function of airway branching generation in human and rat airway epithelium. Inset: Percentage of human secretory cell population positive for only MUC5AC (gray), only for SCGB1A1 (green), or for both (white) as a function of branching generation. Solid line: mean, shaded region: SEM. Numbers of human donors (2–3 FOVs each): BG0, n = 3; BG1, n = 3; BG2, n = 5; BG3, n = 3; BG4, n = 7; BG5, n = 2; BG6, n = 2; Numbers of rat donors (2–3 FOVs each): BG0, n = 5; BG1, n = 3; BG2, n = 2; BG4, n = 1; BG5, n = 1. For full donor information see Supplementary Tables 1 and 2. Source data for (d) are provided as a Source Data file.
Fig. 2
Fig. 2. Ciliary beat and particle clearance function differ between human and rat airway.
a Representative measurement of ciliary beat frequency (CBF) and associated particle clearance trajectories and speed in a human airway epithelial sample (BG2). b Same measurements in rat airway epithelial sample (BG1). Scalebar in (a, b): 100 µm. c Quantification of average CBF, particle clearance speed, and clearance per beat (CPB) in human airways BG0-6 and rat airways BG0-1. Number of human donors: n = 4. Number of rat donors: n = 6. d left: Clearance directionality as a function of distance in human (red) and rat (blue) airways. Thick lines are average curves. Right: Mean directionality over a flow distance of 80 µm. Number of human donors n = 4; number of rat donors: n = 4. Boxplots: Each solid dot is the mean value of one donor (1–3 BGs, 2–4 FOVs each); red line indicates median, bottom and top edges of the box indicate 25th and 75th percentiles, whiskers indicate minimum and maximum; significance was assessed with two-sided unpaired t-test. Source data for (c, d) are provided as a Source Data file.
Fig. 3
Fig. 3. Quantitative analysis of ciliary beat parameters and their impact on clearance function.
a Cell-level analysis of ciliary beat orientation based on beat trajectories (scalebar: 20 µm), ciliary beat amplitude based on kymograph span (scalebar: 10 µm), and cilia length based on histology sections (scalebar: 10 µm). b Tissue-level analysis of ciliation gap size λ using spatial correlation function C(R) of ciliated regions in multiple fields of view (left plot) where the first local maximum of the mean correlation curve reveals mean λ (right plot). Scalebar: 20 µm. c Average cilia coverage, ciliary beat order, ciliary beat amplitude, cilia length, ciliation gap size and crystalline order parameter measured in human BG0-6 and rat BG0-1. Numbers of human donors from left to right: n = 11, 4, 3, 9, 4, 4. Numbers of rat donors from left to right: n = 9, 4, 4, 5, 7, 6. Boxplots: Each solid dot is the mean value of one donor (1–3 BGs, 2–4 FOVs each); red line indicates median, bottom and top edges of the box indicate 25th and 75th percentiles, whiskers indicate minimum and maximum except outliers, red crosses denote outliers (defined as exceeding ±2.7 times standard deviation). Significance was assessed with two-sided unpaired t-test. Schematic of ciliary input metrics on cell- and tissue-level used to predict output metrics of tissue-level clearance using physics-based computational model. e Predicted and measured clearance per beat and clearance directionality in human (red, BG0-6) and rat (blue, BG0-1). Solid line represents mean prediction, shaded area shows uncertainty based on spread of input metrics, and individual data points indicate measurements from human and rat airways. Different marker shapes indicate different donors (n = 3 human donors; n = 4 rat donors), illustrating presence of two different ciliation levels in trachea of same rat donor (e.g., blue circles). Black data points and error bars represent experimental human and rat benchmark (mean ± SEM of individual data points), indicating a reasonable match of the model predictions. Source data for (bd) are provided as a Source Data file.
Fig. 4
Fig. 4. Cell culture media determine in vitro luminal cell type composition.
a Representative IF-images of primary human airway epithelial cultures from 1 donor grown in different differentiation media for 28 days at ALI and stained for cilia (ATUB, magenta) and secretory cell markers (SCGB1A1, green; MUC5AC, white). Scalebar, 40 µm. b Average luminal cell type composition based on IF-staining (in vitro: N = 4–7 donors, 2 inserts each with 3–8 FOVs each; ex vivo: 9 donors, 1–3 BGs, 2–3 FOVs each). c Mapping of IF-staining data of in vitro and ex vivo samples onto three dimensions. y-axis: percentage of MUC5AC+ cells; x-axis: cilia coverage, i.e., percentage of ciliated (ATUB + ) cells; circle diameter: ratio of SCGB1A1+ to MUC5AC+ cell percentages. d Average percentage of MUC5B expressing cells and e relative percentage of MUC5B expressing cells that also express either SCGB1A1 or MUC5AC from IF-stainings (in vitro: n = 2 (SAGM, BD) to n = 4 (PC, PC-S, mAir) donors, 1–2 inserts each with 1–6 FOVs each; ex vivo: n = 3 donors, BG0, 2–4 FOVs each). Boxplot: Each dot represents mean of one donor; red line indicates median, bottom and top edges of the box indicate 25th and 75th percentiles, whiskers indicate minimum and maximum. Source data for (be) are provided as a Source Data file.
Fig. 5
Fig. 5. Cell culture media dramatically impact in vitro ciliary beat and clearance function.
a Quantitative analysis of particle CPB and directionality in primary human airway epithelial cultures grown in different differentiation media for 28 days at ALI compared to human and rat benchmark data. Number of donors (2–3 inserts each with 6 FOVs each) for BD, mAir, SAGM, PC, PC-S, respectively: n = 5, 4, 4, 5, 4. b Quantitative analysis of ciliary beat metrics in airway cells cultured and visualized as in (a). Number of donors (2–3 inserts each with 6 FOVs each) for BD, mAir, SAGM, PC, PC-S, respectively: Cilia Coverage, n = 7, 4, 4, 7, 4; Ciliary Beat OP, n = 4, 4, 2 (1 not measurable), 4, 4; Ciliary Beat Amplitude: n = 4, 4, 3, 4, 4; Cilia Length, n = 4, 4, 4, 4, 4; Ciliation Gap, n = 4, 4, 3, 4, 4; Crystalline OP, n = 4, 4, 3, 4, 4. Boxplots in (a, b): Each solid dot is the mean value of one donor (1–3 BGs, 2–4 FOVs each); red line indicates median, bottom and top edges of the box indicate 25th and 75th percentiles, whiskers indicate minimum and maximum. Dotted lines indicate average human and rat benchmark values. c Top: Predicted CPB and clearance directionality in in vitro cultures compared to predicted human airway performance (red). Shaded regions indicate uncertainty based on spread of input metrics. Measured mean values per donor are overlaid (dots). Bottom: Predicted change in CPB and directionality of in vitro cultures in different media if an individual cilia input parameter is set to match ex vivo values. Source data for (ac) are provided as a Source Data file.
Fig. 6
Fig. 6. Clearance prediction from cell type composition.
Linear regression model predicting average clearance directionality in human airway epithelia (in vitro and ex vivo) using as input the average values of cilia coverage and secretory cell percentage (incl. SCGB1A1 + , MUC5AC + , and MUC5B+ cells). Source data are provided as Source Data file.
Fig. 7
Fig. 7. Structural and functional benchmarking of the mucociliary machinery.
a Clearance per beat map comparing different human in vitro and rodent ex vivo models to human and rat benchmark data. D, day at ALI; P, postnatal day; Vtx, Vertex ALI medium; iALI, human iPSC-derived differentiated airway epithelium. Orange markers indicate original data (iALI, Vtx and Vtx +IL13, proof-of-concept from N = 1 donor each, 2–3 inserts, 3-6 FOVs each); black markers indicate data sourced from literature, see methods for details. Red line and shaded region: Human model predictions; blue line and shaded region: rat BG0-1 model predictions. Shaded regions indicate uncertainty based on spread of input metrics. b Cellular composition map comparing different human in vitro models to human and rat benchmarks with y-axis: percentage of MUC5AC+ cells; x-axis: cilia coverage, i.e., percentage of ciliated (ATUB + ) cells; circle diameter: ratio of SCGB1A1+ to MUC5AC+ cell percentages. Solid markers indicate original data (human BGs as Fig. 4.; iALI, Vtx and Vtx +IL13, proof-of-concept from N = 1 donor each, 2–3 inserts, 3-6 FOVs each); black unfilled markers indicate data sourced from literature. Note that y-axis is in log-scale. Source data for panels a and b are provided as a Source Data file.

Update of

References

    1. Wanner, A., Salathé, M. & O’Riordan, T. G. Mucociliary clearance in the airways. Am. J. Respir. Crit. Care Med.154, 1868–1902 (1996). - PubMed
    1. Bustamante-Marin, X. M. & Ostrowski, L. E. Cilia and mucociliary clearance. Cold Spring Harb. Perspect. Biol.9, a028241 (2017). - PMC - PubMed
    1. Nawroth, J. C., van der Does, A. M., Ryan Firth, A. & Kanso, E. Multiscale mechanics of mucociliary clearance in the lung. Philos. Trans. R. Soc. B: Biol. Sci.375, 20190160 (2020). - PMC - PubMed
    1. Whitsett, J. A. Airway epithelial differentiation and mucociliary clearance. Ann. ATS15, S143–S148 (2018). - PMC - PubMed
    1. Satir, P. & Sleigh, M. A. The physiology of cilia and mucociliary interactions. Annu. Rev. Physiol.52, 137–155 (1990). - PubMed

LinkOut - more resources