. 2025 Mar 12;13(1):33.
doi: 10.1038/s41413-025-00414-3.

LATS1-modulated ZBTB20 perturbing cartilage matrix homeostasis contributes to early-stage osteoarthritis

Affiliations

LATS1-modulated ZBTB20 perturbing cartilage matrix homeostasis contributes to early-stage osteoarthritis

Xue Hao et al. Bone Res. .

Abstract

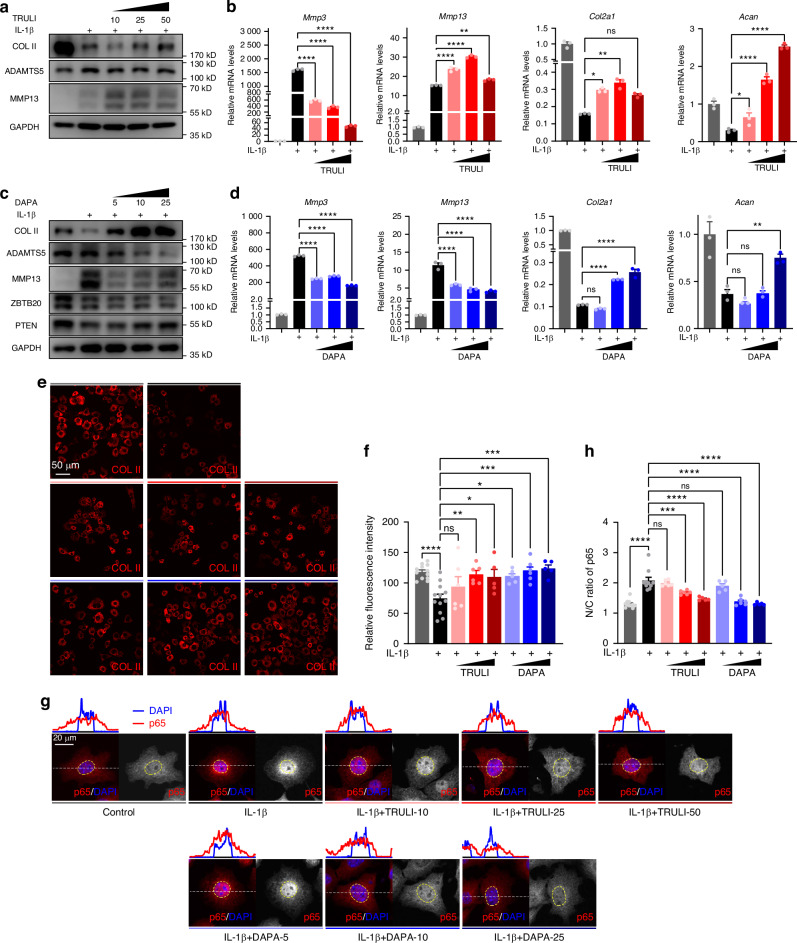
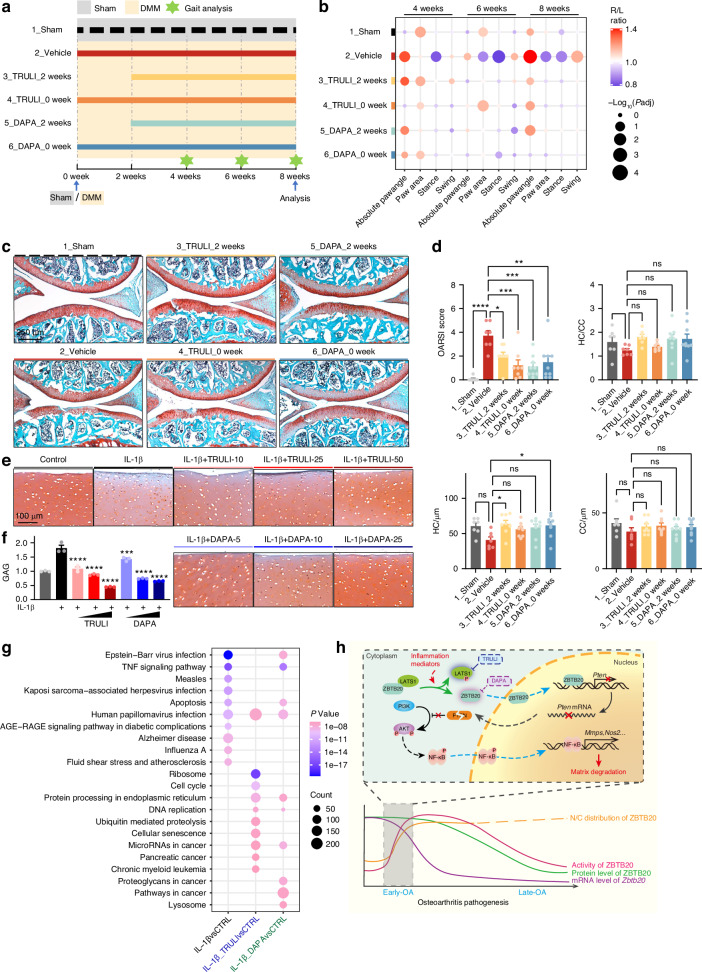
Osteoarthritis (OA) is one of the most common degenerative joint diseases in the elderly, increasing in prevalence and posing a substantial socioeconomic challenge, while no disease-modifying treatments available. Better understanding of the early molecular events will benefit the early-stage diagnosis and clinical therapy. Here, we observed the nucleus accumulation of ZBTB20, a member of ZBTB-protein family, in the chondrocytes of early-stage OA. Chondrocytes-specific depletion of Zbtb20 in adult mice attenuated DMM-induced OA progress, restored the balance of extracellular matrix anabolism and catabolism. The NF-κB signaling mediated disturbance of ECM maintenance by ZBTB20 requires its suppression of Pten and consequent PI3K-Akt signaling activation. Furthermore, the subcellular localization of ZBTB20 was modulated by the kinase LATS1. Independent approaches to modulating ZBTB20 via utilizing TRULI and DAPA can restore ECM homeostasis, improving the abnormal behavior and moderating cartilage degeneration. The compounds TRULI and DAPA modulating ZBTB20 may serve as anti-OA drugs.


Conflict of interest statement

Competing interests: The authors declare no competing interests.

Figures

Fig. 1
Fig. 1
Transcription factor ZBTB20 is activated in early-OA. a Heatmap showing density of annotated ATAC-seq reads 1 kb around the transcription start sites (TSS). b Representative enriched TF binding motifs in chondrocytes treated by IL-1β for 6 h. c Heatmap of enriched motifs in chondrocytes under IL-1β stimulation for 0/6/48 h. ac n = 3 replicates. d Dot plot graph showing the relative expression level and percentage of ZBTB-containing sub-family members in cell populations. e Representative images of immunofluorescence staining of ZBTB20 in articular cartilage of mice underwent DMM or Sham surgery for 2/4/8 weeks. Panels on the right are high magnifications of the boxed regions in the left panels. The dashed circles marked the edge of nuclei. n = 8, 10, 8, 7, 7, 5 mice. f Statistical analysis of the expressions of ZBTB20 in indicated groups of mice in (e). The top panel is quantification of relative fluorescence intensity of ZBTB20. The bottom panel is the statistical analysis for ZBTB20 cellular distribution. g Western blot of COL II, MMP13 and ZBTB20 in chondrocytes treated with IL-1β for 0-72 h. n = 3 biological independent experiments. h Curves of COL II, MMP13 and ZBTB20 expressions in (g). i Schematic diagram of cartilage tissues of the tibial plateau from patients. j Representative images of Safranin O/Fast Green and immunohistochemistry (IHC) staining for COL II and ZBTB20 in the relative damaged and undamaged cartilage from OA patients
Fig. 2
Fig. 2
ZBTB20 icKO in chondrocytes alleviates OA. a Safranin O/Fast Green staining of articular cartilage from Zbtb20-icKO or corresponding control mice underwent DMM or Sham surgery for 8/12 weeks. Panels in the upper right corner are high magnifications of images. The arrows indicated the hypertrophy-like chondrocytes. n = 8, 9, 9, 9, 4, 3, 4, 3 mice. b Statistical analysis of OARSI scores, thickness of hyaline cartilage (HC), calcified cartilage (CC) and ratio of HC to CC in indicated groups of mice in (a). c Representative images of knee joint osteophytes (top panel) and subchondral bone plate (bottom panel) reconstructed by MicroCT analysis from indicated group of mice. n = 4, 3, 4, 3 mice. d Statistical analysis of volume of osteophytes (panel on the left) and SBP thickness (panel on the right) in indicated groups of mice in (c). e IF staining of COL II, ACAN, MMP13, and ADAMTS5 in the tibial cartilage from indicated group of mice. The dashed lines mark the edge of cartilage or the tidemark. The arrows mark the MMP13+ or ADAMTS5+ chondrocytes. f Statistical analysis of IF signal in indicated groups of cells in (e). n = 3, 3, 3, 3 mice. g Western blot of ZBTB20, COL II, MMP13, and ADAMTS5 in IL-1B treated zbtb20f/f primary chondrocytes transduced with Ad-GFP or Ad-Cre-GFP. h Relative mRNA levels of Zbtb20, Col2α1, Mmp3 and Adamts5 in chondrocytes described in (g). i Western blot of ZBTB20, COL II, MMP13, and ADAMTS5 in IL-1B treated primary chondrocytes transfected with Ad-GFP or Ad-mZbtb20-GFP. j Relative mRNA levels of Zbtb20, Col2α1, Mmp3, and Adamts5 in chondrocytes described in (i). gj n = 3 biological independent experiments
Fig. 3
Fig. 3
Activation of NF-κB signaling by ZBTB20 requires suppression of Pten. a Scatter plot graph showing the expression changes of DEGs from each comparison. b Dot plot graph of the top 10 enriched KEGG pathways of DEGs from each comparison. a, b n = 3 replicates. c Western blot of pAKT-T308, pAKT-S473, and AKT in indicated chondrocytes. d Statistical analysis of the bands in (c). e Representative tracks of CUT&Tag-seq analysis showing the enrichment of ZBTB20 around Pten’s promoter in chondrocytes. f Relative enrichment of ZBTB20 on binding regions compared to IgG in chondrocytes treated by IL-1β or not analyzed by ChIP-qPCR. g Western blot of PTEN, pp65-S536 and p65 in IL-1B treated zbtb20f/f primary chondrocytes transduced with Ad-GFP or Ad-Cre-GFP. h Relative mRNA levels of Zbtb20 and Pten in chondrocytes described in (g). i Western blot of PTEN, pp65-S536 and p65 IL-1B treated primary chondrocytes transduced with Ad-GFP or Ad-mZbtb20-GFP. j Relative mRNA levels of Zbtb20 and Pten in chondrocytes described in (i). k, l Relative mRNA levels of Zbtb20, Mmp3, and Col2α1 in indicated groups of chondrocytes treated with IL-1β or/and SC79/ MK2206. cl n = 3 biological independent experiments
Fig. 4
Fig. 4
LATS1 regulates the cellular distribution of ZBTB20 in chondrocytes. a Representative images of immunofluorescence staining of ZBTB20 in primary chondrocytes exposed to IL-1β at concentrations ranging from 1 to 5 ng/mL. n = 3 biological independent experiments. b Statistical analysis of the cellular distribution of ZBTB20 in indicated groups of cells in (a). n = 6 views per group for one biological replicate. The left panel is quantification of N/C ratio of ZBTB20. The right panel is the statistical analysis for ZBTB20 cellular distribution. c Western blot of ZBTB20 in nucleus or cytoplasm extraction of chondrocytes treated with IL-1β ranging from 0 to 5 ng/mL. d Curves showing the cellular distribution of ZBTB20 in (c). e Western blot of COL II, LATS1 and pLATS1 in chondrocytes exposed to IL-1β. f Statistical analysis of fluorescence signal of LATS1 and pLATS1 in articular cartilage from mice underwent Sham or DMM surgery for 2/4/8 weeks. n = 3 mice per group. g Co-immunoprecipitation of Fg-ZBTB20 and Myc-LATS1. h Proximity labeling with TurboID and TurboID-ZBTB20 in chondrocytes. i Statistical analysis of bands of LATS1 in (h). j Representative images of immunofluorescence staining of ZBTB20 in primary chondrocytes upon IL-1β or/and TRULI stimulation. n = 3 biological independent experiments. k Statistical analysis of N/C ratio of ZBTB20 in (j). n = 6, 6, 5 views for one biological replicate. ce, gi n = 3 biological independent experiments
Fig. 5
Fig. 5
Both TRULI and DAPA are capable to restore ECM homeostasis. a Western blot of COL II, ADAMTS5, and MMP13 in chondrocytes treated with IL-1β, supplement with increased dosage of TRULI. b Relative mRNA levels of Mmp3, Mmp13, Col2α1 and Acan in chondrocytes described in (a). c Western blot of COL II, ADAMTS5, and MMP13 in chondrocytes treated with IL-1β, supplement with increased dosage of DAPA. d Relative mRNA levels of Mmp3, Mmp13, Col2α1 and Acan in chondrocytes described in (c). e Representative images of immunofluorescence staining of COL II in chondrocytes treated with IL-1β, supplement with increased dosage of TRULI or DAPA. f Statistical analysis of the relative fluorescence intensity of COL II in indicated groups of cells in (e). g Representative images of immunofluorescence staining of p65 in chondrocytes treated with IL-1β, supplement with increased dosage of TRULI or DAPA. Curves on the top of images showing the fluorescence intensity profile of crop section indicated by the white dashed line. The dashed circles mark the nucleus. h Statistical analysis of the cellular distribution of p65 in indicated groups of cells in (g). ae, g n = 3 biological independent experiments. f, h n = 12, 12, 6, 6, 5, 5, 6, 5 views for one biological replicate
Fig. 6
Fig. 6
Both TRULI and DAPA may serve as anti-OA drugs. a Schematic diagram of administration of TRULI and DAPA in mice in injury induced OA model. b Dot plot graph showing the behavior abnormality indicated by ratios of the parameters between the right hind paw and left hind paw in each group of mice. c Representative images of Safranin O/Fast Green staining of articular cartilage from indicated groups of mice. d Statistical analysis of OARSI scores, thickness of hyaline cartilage (HC), calcified cartilage (CC) and ratio of thickness of HC to CC in indicated groups of mice described in (a). ad n = 7, 7, 8, 8, 9, 9 mice. e Representative images of Safranin O/Fast Green staining of cultured cartilage explants from patient exposed to IL-1β, supplement with increased dosage of TRULI or DAPA. f Statistical analysis of released GAG into medium by DMMB assay in cultures described in (e). e, f n = 3 biological independent experiments. g Dot plot graph of the top 10 enriched KEGG pathways of DEGs from each comparison in human primary chondrocytes. g n = 4 replicates. h Schematic diagram representing molecular mechanisms modulating inflammation and ECM maintenance via LATS1-ZBTB20-PTEN axis

References

    1. Hunter, D. J. & Bierma-Zeinstra, S. Osteoarthritis. Lancet393, 1745–1759 (2019). - PubMed
    1. Leifer, V. P., Katz, J. N. & Losina, E. The burden of OA-health services and economics. Osteoarthr. Cartil.30, 10–16 (2022). - PMC - PubMed
    1. Salmon, J. H. et al. Economic impact of lower-limb osteoarthritis worldwide: a systematic review of cost-of-illness studies. Osteoarthr. Cartil.24, 1500–1508 (2016). - PubMed
    1. Sharma, L. Osteoarthritis of the Knee. N. Engl. J. Med.384, 51–59 (2021). - PubMed
    1. Mahmoudian, A., Lohmander, L. S., Mobasheri, A., Englund, M. & Luyten, F. P. Early-stage symptomatic osteoarthritis of the knee - time for action. Nat. Rev. Rheumatol.17, 621–632 (2021). - PubMed