. 2025 Dec;17(1):2474141.
doi: 10.1080/19490976.2025.2474141. Epub 2025 Mar 11.

Microbiota and metabolite-based prediction tool for colonic polyposis with and without a known genetic driver

Affiliations

Microbiota and metabolite-based prediction tool for colonic polyposis with and without a known genetic driver

Bryson W Katona et al. Gut Microbes. 2025 Dec.

Abstract

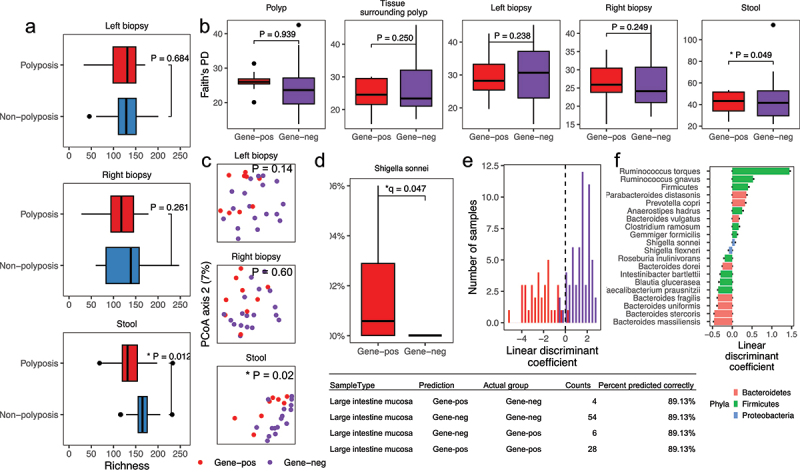
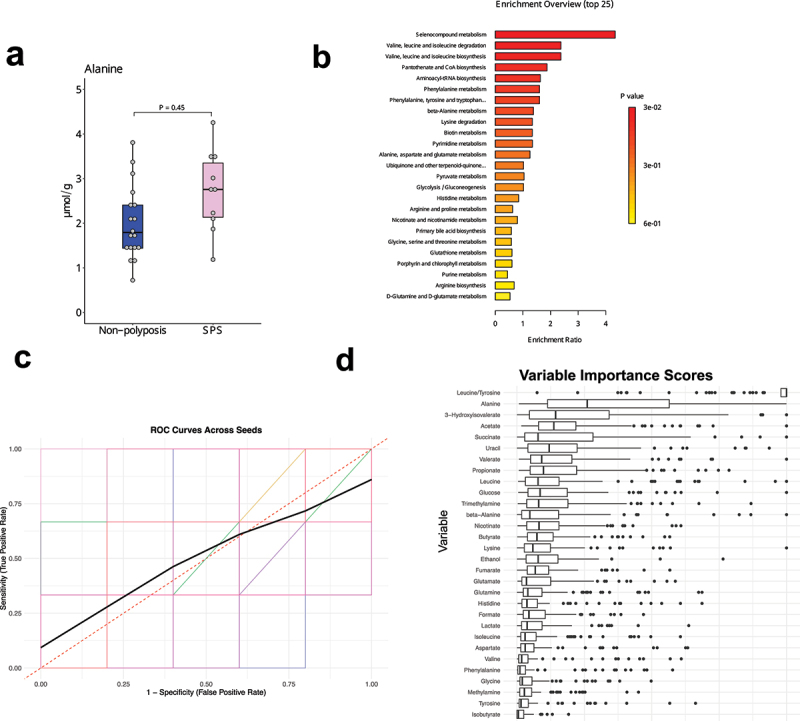
Despite extensive investigations into the microbiome and metabolome changes associated with colon polyps and colorectal cancer (CRC), the microbiome and metabolome profiles of individuals with colonic polyposis, including those with (Gene-pos) and without (Gene-neg) a known genetic driver, remain comparatively unexplored. Using colon biopsies, polyps, and stool from patients with Gene-pos adenomatous polyposis (N = 9), Gene-neg adenomatous polyposis (N = 18), and serrated polyposis syndrome (SPS, N = 11), we demonstrated through 16S rRNA sequencing that the mucosa-associated microbiota in individuals with colonic polyposis is representative of the microbiota associated with small polyps, and that both Gene-pos and SPS cohorts exhibit differential microbiota populations relative to Gene-neg polyposis cohorts. Furthermore, we used these differential microbiota taxa to perform linear discriminant analysis to differentiate Gene-neg subjects from Gene-pos and from SPS subjects with an accuracy of 89% and 93% respectively. Stool metabolites were quantified via 1H NMR, revealing an increase in alanine in SPS subjects relative to non-polyposis subjects, and Partial Least Squares Discriminant Analysis (PLS-DA) analysis indicated that the proportion of leucine to tyrosine in fecal samples may be predictive of SPS. Use of these microbial and metabolomic signatures may allow for better diagnostric and risk-stratification tools for colonic polyposis patients and their families as well as promote development of microbiome-targeted approaches for polyp prevention.

Keywords: Polyposis; alanine; biomarker; colonic adenomatous polyposis of unknown etiology; leucine; metabolome; microbiome; serrated polyposis syndrome; tyrosine.


Conflict of interest statement

No potential conflict of interest was reported by the author(s). All authors reviewed and approved the final manuscript

Figures

Figure 1.
Figure 1.
Sample collection and participant groups. a) During colonoscopy or flexible sigmoidoscopy non-targeted biopsies were obtained from the proximal and distal colon, and in select cases a polyp was collected along with biopsies of the surrounding mucosa. A stool sample was collected prior to the endoscopic procedure. b) Flow chart of participant groups.
Figure 2.
Figure 2.
Microbiota comparisons and a linear discriminant prediction model differentiating between Gene-pos and Gene-neg polyposis groups. a) Box plots of richness of different sample types in polyposis and non-polyposis subjects. Line indicates the median and boxes indicate the first and third quartiles. b) Box plots of richness of different sample types in Gene-pos and Gene-neg subjects. Line indicates the median and boxes indicate the first and third quartiles. c) Unweighted UniFrac principal coordinates analysis of different sample types using 16S rRNA gene-tagged sequencing. d) Box plot showing difference in relative abundance of taxa with q < 0.05. e) Histogram showing linear discriminant analysis (LDA) separation of the sample populations, with predictive values depicted in the table. f) Taxa with top discriminant scores used to predict groups based on LDA. * indicates p < 0.05 as assessed by fixed linear model.
Figure 3.
Figure 3.
Microbiota comparisons and a linear discriminant prediction model differentiating between the SPS and Gene-neg groups. a) Box plots of richness of different sample types in SPS and Gene-neg subjects. Line indicates the median and boxes indicate the first and third quartiles. b) Histogram showing linear discriminant analysis (LDA) separation of the sample populations, with actual predictive values depicted in the table. c) Taxa with top discriminant scores used to predict groups based on LDA. * indicates p < .05 as assessed by fixed linear model.
Figure 4.
Figure 4.
Untargeted metabolomics on stool samples. a) Quantitative measurement of metabolites using 1H NMR showed differences between non-polyposis and SPS groups. Metabolite concentrations were normalized to wet weight of stool. The statistical significance between groups were tested using student’s t-test. b) Pathway-based enrichment analysis using metabolite set enrichment analysis (MSEA) showed top 25 affected pathways in the SPS group compared to the non-polyposis group. c) Receiver operating characteristic (ROC) curves for predictive modeling across 100 random seeds. The plot displays ROC curves (colored lines) generated from repeated 5-fold cross-validation, with each random seed represented by a different color. The bold black curve represents the average ROC curve across all iterations, summarizing the overall model performance. The red dashed line indicates the line of no discrimination (AUROC = 0.5), serving as a baseline reference. d) The boxplot illustrates the distribution of importance scores (frequency of variable selection) for each variable across multiple iterations of the model. Variables are listed on the y-axis, while their respective importance scores are plotted on the x-axis. The boxplots display the median, interquartile range (IQR), and potential outliers for each variable, with individual dots representing scores from specific iterations. Higher importance scores indicate a greater contribution to the predictive model. Notably, “leucine/tyrosine,” “alanine,” and “3-hydroxyisovalerate” all have higher importance scores.

References

    1. Siegel RL, Wagle NS, Cercek A, Smith RA, Jemal A.. Colorectal cancer statistics, 2023. CA Cancer J Clin. 2023;73(3):233–14. doi:10.3322/caac.21772. - DOI - PubMed
    1. Long JM, Powers JM, Katona BW. Evaluation of classic, attenuated, and oligopolyposis of the colon. Gastrointest Endosc Clin N Am. 2022;32(1):95–112. doi:10.1016/j.giec.2021.08.003. - DOI - PMC - PubMed
    1. Peters BA, Dominianni C, Shapiro JA, Church TR, Wu J, Miller G, Yuen E, Freiman H, Lustbader I, Salik J, et al. The gut microbiota in conventional and serrated precursors of colorectal cancer. Microbiome. 2016;4(1):69. doi:10.1186/s40168-016-0218-6. - DOI - PMC - PubMed
    1. Keku TO, Dulal S, Deveaux A, Jovov B, Han X. The gastrointestinal microbiota and colorectal cancer. Am J Physiol-Gastroint Liver Physiol. 2015;308(5):G351–G63. doi:10.1152/ajpgi.00360.2012. - DOI - PMC - PubMed
    1. Goodwin AC, Destefano Shields CE, Wu S, Huso DL, Wu X, Murray-Stewart TR, Hacker-Prietz A, Rabizadeh S, Woster PM, Sears CL, et al. Polyamine catabolism contributes to enterotoxigenic bacteroides fragilis-induced colon tumorigenesis. Proc Natl Acad Sci USA. 2011;108(37):15354–15359. doi:10.1073/pnas.1010203108. - DOI - PMC - PubMed

Substances

LinkOut - more resources