. 2025 Mar 11;16(1):2434.
doi: 10.1038/s41467-025-57592-1.

The DEAD-box helicase eIF4A1/2 acts as RNA chaperone during mitotic exit enabling chromatin decondensation

Affiliations

The DEAD-box helicase eIF4A1/2 acts as RNA chaperone during mitotic exit enabling chromatin decondensation

Ramona Jühlen et al. Nat Commun. .

Abstract

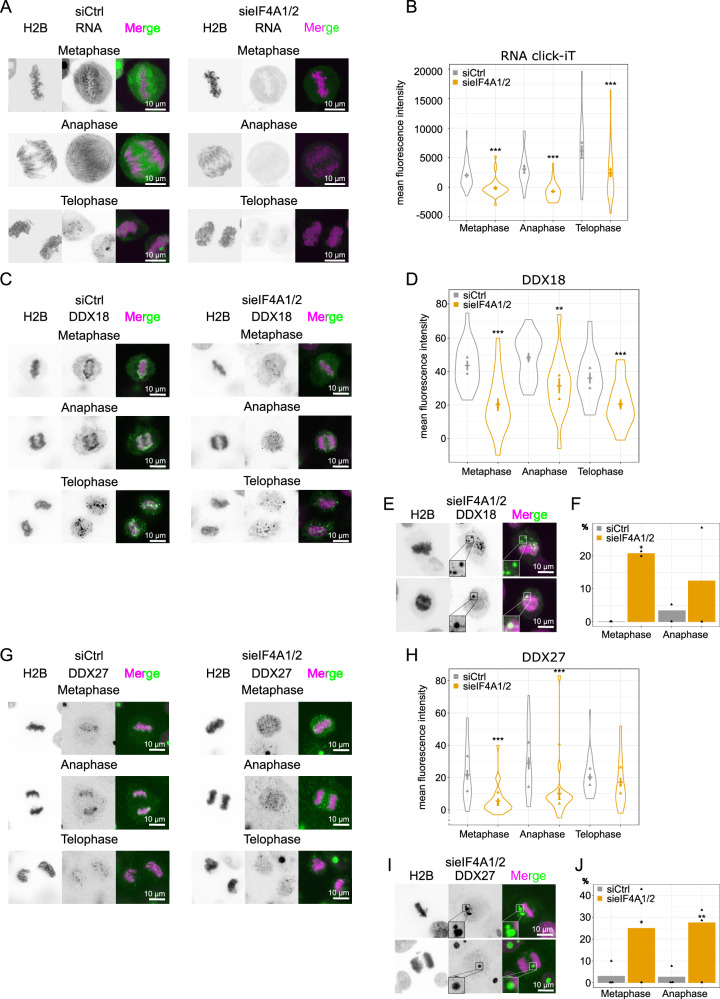
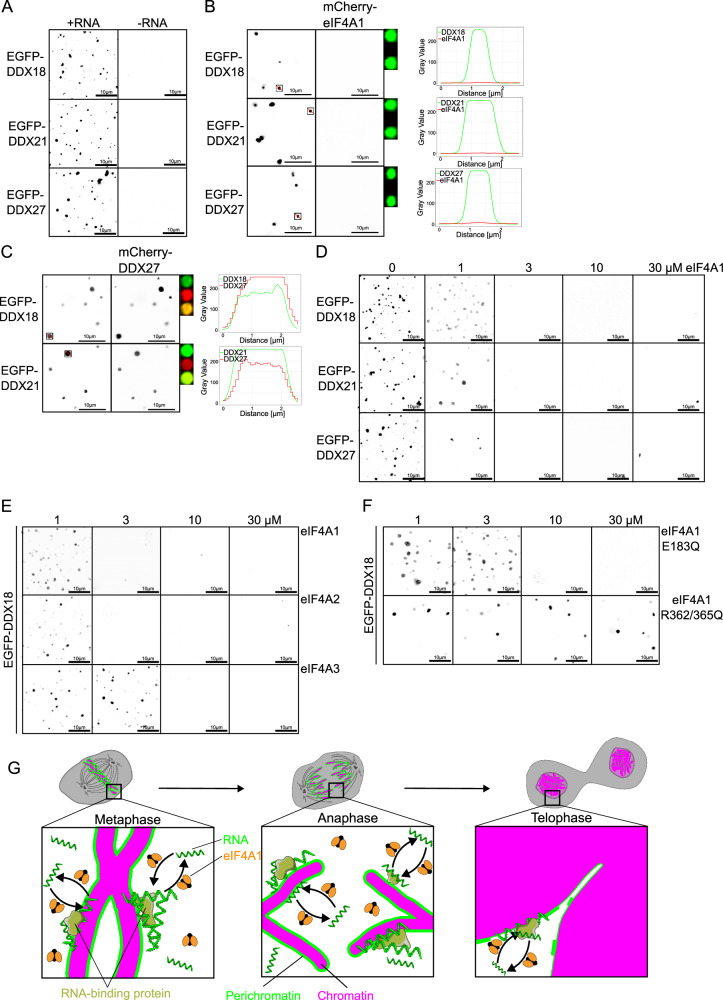
During mitosis, chromosomes condense and decondense to segregate faithfully and undamaged. The exact molecular mechanisms are not well understood. We identify the DEAD-box helicase eIF4A1/2 as a critical factor in this process. In a cell-free condensation assay eIF4A1/2 is crucial for this process, relying on its RNA-binding ability but not its ATPase activity. Reducing eIF4A1/2 levels in cells consistently slows down chromatin decondensation during nuclear reformation. Conversely, increasing eIF4A1/2 concentration on mitotic chromosomes accelerates their decondensation. The absence of eIF4A1/2 affects the perichromatin layer, which surrounds the chromosomes during mitosis and consists of RNA and mainly nucleolar proteins. In vitro, eIF4A1/2 acts as an RNA chaperone, dissociating biomolecular condensates of RNA and perichromatin proteins. During mitosis, the chaperone activity of eIF4A1/2 is required to regulate the composition and fluidity of the perichromatin layer, which is crucial for the dynamic reorganization of chromatin as cells exit mitosis.


Conflict of interest statement

Competing interests: The authors declare no competing interests.

Figures

Fig. 1
Fig. 1. eIF4A1/2 is important for in vitro chromatin decondensation.
A Mitotic chromatin clusters were decondensed in control‐ (Mock) and eIF4A1/2‐depleted (ΔeIF4A1/2) Xenopus egg extracts supplemented with buffer or recombinant Xenopus eIF4A1, eIF4A2 or eIF4A3. Samples were fixed after 2 h with 4% PFA and 0.5% glutaraldehyde, stained with DAPI, and analyzed by confocal microscopy. B For decondensation quantification, the boundary smoothness of the chromatin was analyzed. Means of two independent experiments (triangles), overall mean ± s.e.m. of in total more than 50 chromatin substrates for each condition as in (A). At some points, errors might be too small to be visible. Two-tailed unpaired Mann-Whitney U test (ΔeIF4A1/2, ***P = 3.3 × 1018; +eIF4A3, ***P = 2.63 × 1018). C Western blot analysis with a Xenopus eIF4A1/2 antibody of Mock‐ and eIF4A1/2‐depleted extracts, without or with the addition of recombinant Xenopus eIF4A1, eIF4A2 or eIF4A3. Nup62 is used as a loading control. D Mitotic chromatin clusters were decondensed and analyzed as in (A) but supplemented with buffer or recombinant wild-type eIF4A1, the ATPase deficient E183Q, or the RNA-binding deficient R362/365Q mutant. E The violin plot of the chromatin border smoothness. Means of three independent experiments (triangles), overall mean ± s.e.m. of in total more than 50 chromatin substrates for each condition as in (D). At some points, errors might be too small to be visible. Two-tailed unpaired Mann-Whitney U test (ΔeIF4A1/2, ***P = 7.65 × 1019; + eIF4A1 R362/365Q, ***P = 4.96 × 1019). F Western blot analysis with a Xenopus eIF4A1/2 antibody of Mock-, eIF4A1/2‐depleted, or eIF4A1/2‐depleted extracts supplemented with the indicated eIF4A1 proteins. Nup62 is used as a loading control. G Mitotic chromatin clusters were decondensed in Xenopus egg extracts in the absence or presence of 0.05 mg/ml RNA supplemented with buffer, 5 or 15 µM recombinant Xenopus eIF4A1 or 50 µg/ml RNase A and analyzed as in (A). H Violin plot shows the means of three independent experiments (triangles) and the overall mean ± s.e.m., of in total more than 40 chromatin substrates for each condition as in (E). At some points, errors might be too small to be visible. Two-tailed unpaired Mann-Whitney U test ( + RNA, ***P = 1.63 × 1018; + RNA + eIF4A1 5 µM, ***P = 1.63 × 1018). Source data are provided as a Source Data file. Scale bars: 10 µm.
Fig. 2
Fig. 2. Downregulation of eIF4A1/2 decelerates mitotic chromatin decondensation in cells.
A Telophase duration in H2B-mCherry HeLa cells, transfected with 20 nM siRNA control or against PP2A, eIF4A1 (three different oligos), eIF4A2 or a combination of eIF4A1 (oligo A) and eIF4A2, analyzed by live cell imaging 48–63 h post-transfection. Mean telophase time of at least 150 mitotic events per condition from three independent experiments with the individual (triangles) and overall means ± s.e.m. Two-tailed unpaired t test with Welch’s correction (sieIF4A1/2, *P = 0.02). B Chromatin area analysis from (A) with at least 90 mitotic events per condition, normalized to the first anaphase frame. Lines represent means ± s.e.m. C Nuclear area of interphase cells, defined by 10 frames before interphase-prophase transition, from (A), 90 cells per condition. Means of three independent experiments (triangles) and overall mean ± s.e.m. with values for each transfection. Two-tailed unpaired t test with Welch’s correction (sieIF4A1-A, *P = 0.01). D eIF4A1/2 Western blot of H2B-mCherry HeLa cells, 72 h post-transfection with 20 nM siRNA oligos, corresponding to (AC), with eIF4A1 antibodies (upper) or antibodies recognizing eIF4A1 and eIF4A2 (lower panel). Actin serves as loading control. Signal intensity, normalized to actin, of four independent experiments (triangles) and overall mean ± sd. Two-tailed unpaired t test with Welch’s correction (eIF4A1, ***P = 6.73 × 104; eIF4A1/2, **P = 3.58 × 103). E Time-lapse images of H2B-mCherry HeLa cells, transfected with 20 nM control or a combination of eIF4A1 and eIF4A2 siRNA oligos for 72 h, normalized to the first anaphase frame. F Analysis of the experiments as in (E). Dots represent mean ± s.e.m. from 11 (siCtrl) and 10 (sieIF4A1/2) cells per condition. G Chromatin area quantification of H2B-mCherry HeLa cells, co-transfected with eIF4A1-EGFP or siRNA resistant eIF4A1-EGFP and 40 nM control or a combination of eIF4A1 and eIF4A2 siRNA oligos for 48 h, normalized to the first anaphase frame. Dots represent mean ± s.e.m. from each condition with 47 (eIF4A1-EGFP+ siCtrl), 57 (eIF4A1-EGFP + sieIF4A1/2), 72 (eIF4A1res-EGFP + siCtrl) or 43 (eIF4A1res-EGFP + sieIF4A1/2) daughter chromatin masses. H eIF4A1/2 western blot of H2B-mCherry HeLa cells, 48 h post-transfection with 40 nM siRNA oligos and eIF4A1-EGFP or eIF4A1res-EGFP. Actin serves as loading control. Source data are provided as a Source Data file. Scale bars: 10 µm.
Fig. 3
Fig. 3. Downregulation of eIF4A1/2 affects the RNA content and RNA helicases of the perichromosomal layer.
A High-resolution imaging of EU-labeled RNA (green in overlay) in fixed H2B-mCherry HeLa cells (magenta in overlay), transfected with 20 nM control or a combination of eIF4A1 and eIF4A2 siRNA oligos for 72 h. B RNA mean fluorescence intensity on the chromatin in metaphase, anaphase, and telophase. The violin plots show the means of two independent experiments (triangles) each including at least 26 cells per condition and the overall mean ± sd. Two-tailed unpaired Mann-Whitney U test (metaphase, ***P = 1.3 × 106; anaphase, ***P = 3.8 × 107; telophase, ***P = 9.6 × 104). C DDX18 immunostaining (green) of H2B-mCherry HeLa cells (magenta), transfected with 20 nM control or a combination of eIF4A1 and eIF4A2 siRNA oligos for 72 h. D DDX18 mean fluorescence intensity on the chromatin in metaphase, anaphase, and telophase as in (C). The violin plots show the means of two independent experiments (triangles) each including at least 7 cells per condition and the overall mean ± s.e.m. Two-tailed unpaired t test with Welch’s correction (metaphase, ***P = 1.7 × 10-5; anaphase, **P = 4.0 × 10−3; telophase, ***P = 9.4 × 104). E Example images of cytoplasmic DDX18 foci in the eIF4A1/2 knockdown in metaphase and anaphase. F Percentage of cells showing big cytoplasmic DDX18 foci as in (C). Means of two independent experiments (triangles). Two-sided Fisher’s exact test (metaphase, *P = 1.11 × 102). G DDX27 immunostaining (green) of H2B-mCherry HeLa cells (magenta) transfected with 20 nM control or a combination of eIF4A1 and eIF4A2 siRNA oligos for 72 h. H Quantitation of the DDX27 mean fluorescence intensity as in (D). The violin plots show the means of three independent experiments (triangles) each including at least 3 cells per condition and the overall mean ± s.e.m. Two-tailed unpaired Mann-Whitney U test (metaphase, ***P = 6.6 × 10-6; anaphase, ***P = 9.5 × 105; telophase, ns P = 0.06). I Example images of cytoplasmic DDX27 foci in the eIF4A1/2 knockdown in metaphase and anaphase. J Percentage of cells showing big cytoplasmic DDX27 foci. Means of three independent experiments (triangles). Two-sided Fisher’s exact test (metaphase, *P = 1.63 × 102, anaphase, **P = 8.1*103). Source data are provided as a Source Data file. Scale bars: 10 µm.
Fig. 4
Fig. 4. Downregulation of eIF4A1/2 affects the perichromosomal layer.
A Time-lapse images of HeLa cells stably expressing H2B-mPlum and EGFP-CCDC137, transfected with a combination of 20 nM eIF4A1 and eIF4A2 siRNA oligos for 72 h showing cytosolic EGFP-CCDC137 aggregates (red arrowhead) seen in 3 independent experiments. Time is normalized to the first anaphase frame. B High-resolution imaging of fixed HeLa cells stably expressing H2B-mPlum (magenta in overlay) and EGFP-CCDC137 (green in overlay), transfected with 20 nM control, a combination of eIF4A1 and eIF4A2 or Ki-67 siRNA oligos for 72 h showing cytosolic EGFP-CCDC137 aggregates (red arrowheads). Line scans presented in (C) are indicated. C Line scans of the EGFP-CCDC137 fluorescence intensity in the cells shown in (B). Line scans are drawn across 200 pixels in each cell, and the EGFP-CCDC137 signal is presented in gray values. D Quantitation of EGFP-CCDC137 localization from one experiment as in (B) showing cell percentage with more than 90 cells per condition. E Time-lapse images of HeLa cells expressing EGFP-Ki-67 transfected with 20 nM control or a combination of eIF4A1 and eIF4A2 siRNA oligos for 72 h and treated with 250 nM SiR-DNA for 2 h to visualize chromatin. Time is normalized to the first anaphase frame. Red arrowheads indicate unsegregated chromatin masses seen in 5 independent experiments. F Ki-67 immunostaining (green in overlay) of HeLa cells stably expressing H2B-mCherry (magenta in overlay) transfected with 20 nM control or a combination of eIF4A1 and eIF4A2 siRNA oligos for 72 h at different stages of mitotic exit. G Quantitation of the Ki-67 mean fluorescence intensity in anaphase and telophase from three independent experiments as in F. The violin plots show the means of three independent experiments (triangles) each including 18 (siCtrl) and 10 (sieIF4A1/2) cells for early/late anaphase and 22 (siCtrl) and 15 (sieIF4A1/2) cells for late telophase and the overall mean ± s.e.m. Significance was tested by a two-tailed unpaired t test with Welch’s correction (early/late anaphase, ***P = 1.35 × 10-5; early telophase, ***P = 7.95 × 10−5). Scale bars: 10 µm. Source data are provided as a Source Data file.
Fig. 5
Fig. 5. eIF4A1/2 is rapidly excluded from the reforming nucleus.
A eIF4A1/2 immunostaining (green in overlay) of HeLa cells stably expressing H2B-mCherry (magenta in overlay) at mitotic different stages, representative for 4 independent experiments. Scale bars: 10 µm. B eIF4A1/2 immunostaining (green in overlay) of interphase HeLa cells stably expressing H2B-mCherry (magenta in overlay), untransfected or transfected with 20 nM control or a combination of eIF4A1 and eIF4A2 siRNA oligos for 72 h, representative for 4 independent experiments. Scale bars: 10 µm. C Fixed samples of different mitotic stages of HeLa cells expressing H2B-mCherry (magenta in overlay) and GFP or eIF4A1-EGFP (green in overlay), representative for 2 independent experiments. Scale bars: 10 µm. D Fixed samples of interphase HeLa cells expressing H2B-mCherry (magenta in overlay) and GFP or eIF4A1-EGFP (green in overlay), representative for 2 independent experiments. Scale bars: 10 µm. E Time-lapse images of H2B-mCherry HeLa cells expressing eIF4A1-EGFP, the corresponding ATPase deficient mutant eIF4A1 E183Q or the RNA-binding deficient R362Q mutant, EGFP, eIF4A2-EGFP, eIF4A3-EGFP, EGFP-eIF4B, EGFP-eIF4G1 or EGFP-eIF4H, representative for 3 independent experiments per construct. Time is normalized to the first anaphase frame. Scale bars: 10 µm.
Fig. 6
Fig. 6. Tethering of eIF4A1/2 to chromosomes accelerates chromatin decondensation.
A Time-lapse images of H2B-mPlum-FKBP HeLa cells expressing EGFP-FRB-eIF4A1 after adding 200 nM DMSO (control, - rapamycin) or rapamycin. Time is normalized to the first anaphase frame. Scale bars: 10 µm. B Time-dependent quantitation of the chromatin area of the experiments as in (A), normalized to the first anaphase frame. Dots represent mean ± s.e.m. from 12 (-rapamycin) and 14 (+ rapamycin) cells. C Same as in (A) but with the ATPase deficient mutant of eIF4A1 E183Q. D Same as in (B) but with the ATPase deficient mutant of eIF4A1 E183Q from 7 (-rapamycin) and 9 (+ rapamycin) cells. E Same as in (A) but with the RNA-binding mutant of eIF4A1 R362Q. F Same as in (B) but with the RNA-binding mutant of eIF4A1 R362Q from 9 (-rapamycin) and 10 (+ rapamycin) cells. G Same as in (A) but with EGFP-FRB-eIF4A2. H Same as in (B) but with EGFP-FRB-eIF4A2 with 15 (-rapamycin) and 17 (+ rapamycin) cells. I Same as in (A) but with EGFP-FRB-eIF4A3. J Same as in (B) but with EGFP-FRB-eIF4A3 with 10 (+ rapamycin) and 10 (-rapamycin) cells. K Time-dependent quantification of the chromatin area normalized to the first anaphase frame. HeLa cells stably expressing H2B-mCherry were co-transfected with GFP or eIF4A3-GFP and 40 nM control or a combination of eIF4A1 and eIF4A2 siRNA oligos for 48 h. Dots represent mean ± s.e.m. from each condition with 53 (EGFP + siCtrl), 37 (EGFP + sieIF4A1/2), 71 (eIF4A3-EGFP + siCtrl) or 45 (eIF4A3-EGFP + sieIF4A1/2) daughter chromatin masses. L Western blot showing the downregulation of eIF4A1/2 at 48 h post-transfection with 40 nM siRNA oligos and EGFP or eIF4A3-EGFP in HeLa cells stably expressing H2B-mCherry. Samples were analyzed with antibodies recognizing human eIF4A1/2. Actin serves as loading control. Source data are provided as a Source Data file.
Fig. 7
Fig. 7. eIF4A1/2 destabilizes RNA condensates.
A In vitro phase separation of 10 µM recombinant EGFP-DDX18, EGFP-DDX21, or EGFP-DDX27 in the presence or absence of 1 mg/ml RNA. Confocal images are representative of three independent experiments. B In vitro phase separation of 10 µM recombinant EGFP-DDX18, EGFP-DDX21, or EGFP-DDX27 (green in the presence of 1 mg/ml RNA and 0.5 µM mCherry-eIF4A1. Confocal images are representative of three independent experiments. Single RNA condensates are marked and shown as a close-up in the EGFP (green), mCherry (red), and merged channel (yellow as an overlay of red and green). On the right, line scans through a condensate is shown (EGFP signal in green, mCherry signal in red). Scale bars: 10 µm. C In vitro phase separation of 10 µM recombinant EGFP-DDX18 or EGFP-DDX21 and mCherry-DDX27 in the presence of 1 mg/ml RNA. Confocal images are representative of three independent experiments. Single RNA condensates are marked and shown as a close-up in the EGFP (green), mCherry (red), and merged channel (yellow as an overlay of red and green). On the right line, scans through a condensate is shown (EGFP signal in green, mCherry signal in red). D In vitro phase separation in the presence of RNA of the experiments as in (A) with increasing concentration of recombinant eIF4A1. Confocal images are representative of three independent experiments. E In vitro phase separation of 10 µM recombinant EGFP-DDX18 in the presence of 1 mg/ml RNA with increasing concentration of recombinant eIF4A1, eIF4A2, or eIF4A3. Confocal images are representative of three independent experiments. F In vitro phase separation of 10 µM recombinant EGFP-DDX18 in the presence of 1 mg/ml RNA with increasing concentration of the recombinant ATPase deficient E183Q or RNA-binding deficient R362/365Q mutant of eIF4A1. Confocal images are representative of three independent experiments. G Working model of eIF4A1/2 function as RNA mobilizers: As cytosolic RNA chaperone, eIF4A1 /2 facilitates the formation and/or maintenance of the perichromatin layer by enhancing RNA dynamics, thereby promoting their integration into the perichromatin layer. Scale bars: 10 µm. Source data are provided as a Source Data file.

References

    1. Nigg, E. A. Mitotic kinases as regulators of cell division and its checkpoints. Nat. Rev. Mol. Cell Biol.2, 21–32 (2001). - PubMed
    1. Walczak, C. E. & Heald, R. Mechanisms of mitotic spindle assembly and function. Int. Rev. Cytol.265, 111–158 (2008). - PubMed
    1. Paulson, J. R., Hudson, D. F., Cisneros-Soberanis, F. & Earnshaw, W. C. Mitotic chromosomes. Semin. Cell Dev. Biol.117, 7–29 (2021). - PMC - PubMed
    1. Antonin, W. & Neumann, H. Chromosome condensation and decondensation during mitosis. Curr. Opin. Cell Biol.40, 15–22 (2016). - PubMed
    1. Goloborodko, A., Imakaev, M. V., Marko, J. F. & Mirny, L. Compaction and segregation of sister chromatids via active loop extrusion. ELife5, 10.7554/elife.14864 (2016). - PMC - PubMed

MeSH terms

LinkOut - more resources