. 2025 Mar 11;3(1):38.
doi: 10.1038/s44271-025-00221-w.

Automatic multisensory integration follows subjective confidence rather than objective performance

Affiliations

Automatic multisensory integration follows subjective confidence rather than objective performance

Yi Gao et al. Commun Psychol. .

Erratum in

Abstract

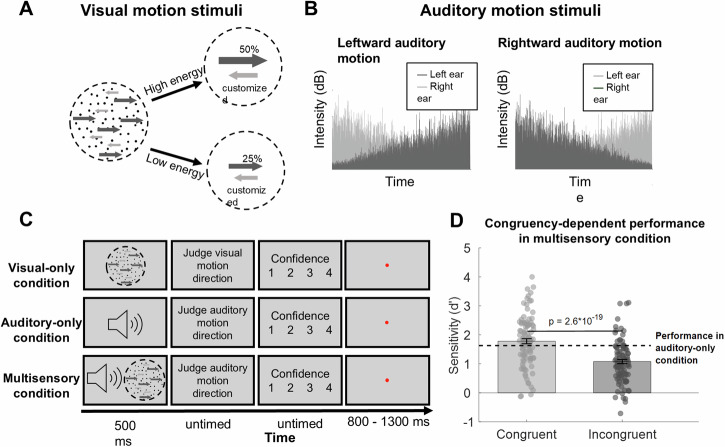
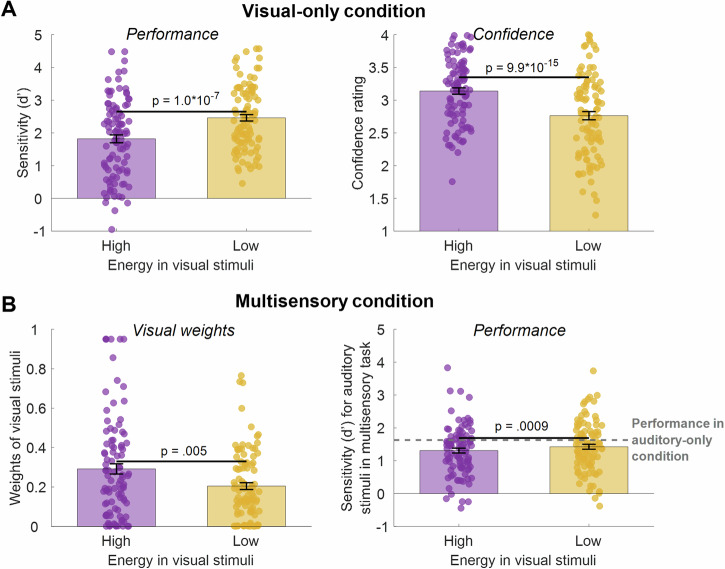
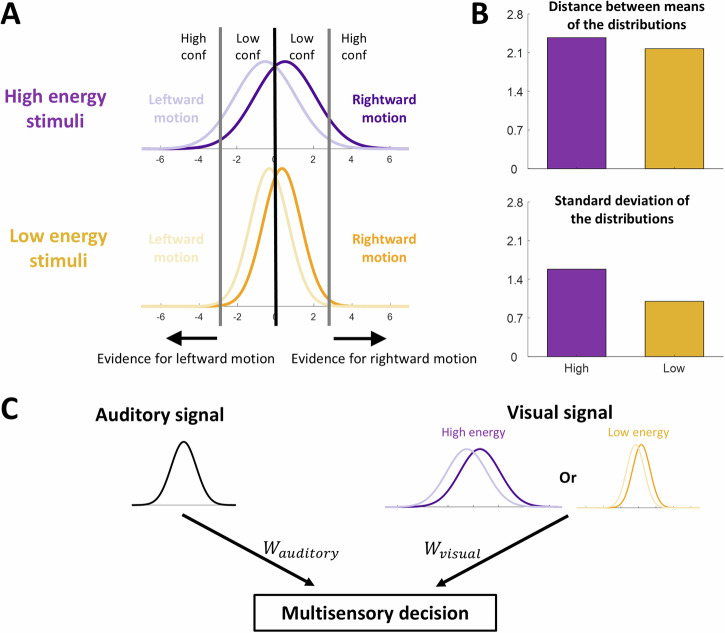
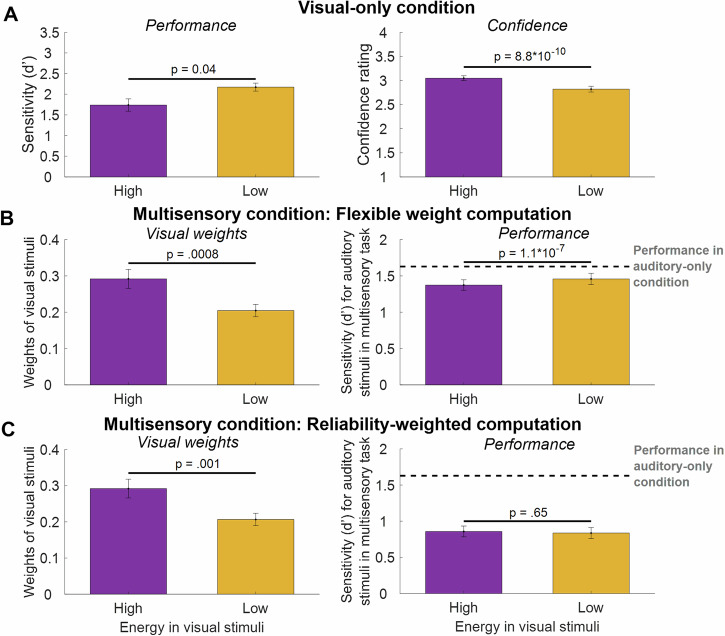
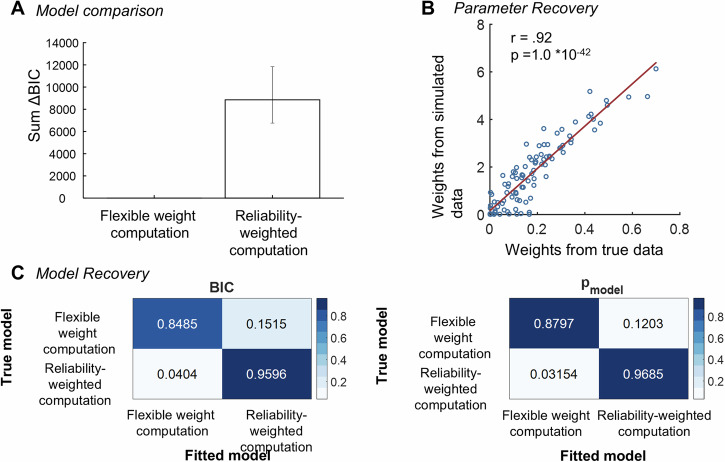
It is well known that sensory information from one modality can automatically affect judgments from a different sensory modality. However, it remains unclear what determines the strength of the influence of an irrelevant sensory cue from one modality on a perceptual judgment for a different modality. Here we test whether the strength of multisensory impact by an irrelevant sensory cue depends on participants' objective accuracy or subjective confidence for that cue. We created visual motion stimuli with low vs. high overall motion energy, where high-energy stimuli yielded higher confidence but lower accuracy in a visual-only task. We then tested the impact of the low- and high-energy visual stimuli on auditory motion perception in 99 participants. We found that the high-energy visual stimuli influenced the auditory motion judgments more strongly than the low-energy visual stimuli, consistent with their higher confidence but contrary to their lower accuracy. A computational model assuming common principles underlying confidence reports and multisensory integration captured these effects. Our findings show that automatic multisensory integration follows subjective confidence rather than objective performance and suggest the existence of common computations across vastly different stages of perceptual decision making.


Conflict of interest statement

Competing interests: The authors declare no competing interests.

Figures

Fig. 1
Fig. 1. Experimental paradigm and main results.
A Visual stimuli used in the experiments. The visual stimuli were random-dot kinematograms that consisted of dots moving in a dominant direction (either leftward or rightward for each trial), a non-dominant direction (always opposite to the dominant direction), and random directions. The number of dots moving in the dominant direction was fixed to 50% of the total number of dots for the high-energy stimuli and 25% for the low-energy stimuli. The number of dots moving in the non-dominant direction was customized in different ways for different participants (see Methods). Note that the high coherence in the dominant direction was consistently paired with high coherence in the non-dominant direction. This relationship results in a dissociation between confidence and accuracy. The total number of dots was constant for stimuli with different energy levels. B Auditory stimuli used in the experiments. We used cross-faded white noise as auditory motion stimuli. For leftward motion, the sound played to the left ear faded in (i.e., the sound intensity increased over time), while the sound in the right ear faded out (i.e., the sound intensity decreased over time). The opposite was true for rightward motion. C Trial structure. Each trial started with motion stimuli (visual-only, auditory-only, or a combination of visual and auditory). Participants then judged the direction of motion (left vs. right) and provided confidence on a 4-point scale. In the multisensory condition, participants judged the auditory motion, but their judgments were typically influenced by the visual motion. The next trial started after a fixation interval of 800–1300 ms. D Performance was better for congruent vs. incongruent trials in the multisensory condition (N = 99).
Fig. 2
Fig. 2. Experimental results.
A In the visual-only condition, high-energy visual stimuli led to lower performance (left) but higher confidence (right). B In the multisensory condition (with congruent and incongruent trials combined), high-energy visual stimuli were weighed more heavily in judgments (left), and both multisensory conditions had lower d’ than the auditory-only condition (dashed line), with a larger decrease for high-energy stimuli (right). Shaded symbols indicate individual data (N = 99). Error bars indicate SEM.
Fig. 3
Fig. 3. Computational model.
A Internal distributions of evidence for high- vs. low-energy stimuli. The model assumes that the distribution for high-energy stimuli has a larger variability compared to that of low-energy stimuli, resulting in more trials falling in the range in the tails with higher confidence. The distributions shown in the figure are the average distributions obtained after fitting the model to the data. B Standard deviation (SD) and difference between the two distributions’ means from panel A, showing that high-energy visual stimuli produce internal evidence distributions with a significantly larger variance but only a slightly larger distance between the means of the left and right stimulus distributions than low-energy stimuli. C Multisensory-decision model. Visual signals are combined directly with auditory signals without any normalization, such that xmultisensory=wxvisual+1wxauditory. We tested two main computations underlying multisensory integration. The Flexible weight computation treats the parameter w as a free parameter. The Reliability-weighted computation fixes the parameter w to the value that would result in weighing each sensory signal according to its reliability.
Fig. 4
Fig. 4. Model fits.
A The model successfully reproduced lower multisensory d’ for the high-energy stimuli compared to the low-energy stimuli, consistent with the associated higher confidence but lower accuracy for the high-energy stimuli. B The Flexible weight computation well reproduced the higher estimated weight and the overall lower multisensory d’ and for the high- compared to the low-energy visual stimuli. C The Reliability-weighted computation produced higher weight for the high- compared to the low-energy visual stimuli (left panel). However, it produced similar multisensory d’ for the high- compared to the low-energy visual stimuli. Error bars indicate SEM.
Fig. 5
Fig. 5. Model comparison, parameter recovery, and model recovery.
A Comparison of model performance between the Flexible weight computation and the Reliability-weighted computation based on BIC values. The Flexible weight computation outperformed the Reliability-weighted computation. Error bars indicate 95% confidence intervals (CIs) generated using bootstrapping. B Parameter recovery for the weight parameter (w) of the Flexible weight computation. Pearson’s correlation between weights fitted from simulated data and true data demonstrates effective parameter recovery. The red line represents the fit using a linear regression model. C Model recovery analysis for the Flexible weight and Reliability-weighted computations. Model recovery was assessed using standard fixed-effects analyses (left) and using random-effects modeling (right). In both cases, we observe excellent model recovery showing that the two computations are clearly distinguishable from each other.

Update of

Similar articles

References

    1. Alais, D. & Burr, D. The ventriloquist effect results from near-optimal bimodal integration. Curr. Biol.14, 257–262 (2004). - PubMed
    1. Ernst, M. O. & Banks, M. S. Humans integrate visual and haptic information in a statistically optimal fashion. Nature415, 429–433 (2002). - PubMed
    1. Fetsch, C. R., Pouget, A., Deangelis, G. C. & Angelaki, D. E. Neural correlates of reliability-based cue weighting during multisensory integration. Nat. Neurosci.15, 146–154 (2012). - PMC - PubMed
    1. Kim, R., Peters, M. A. K. & Shams, L. 0 + 1 > 1: how adding noninformative sound improves performance on a visual task. Psychol. Sci.23, 6–12 (2012). - PubMed
    1. Landy, M. S., Banks, M. S. & Knill, D. C. Ideal-observer models of cue integration. In Sensory Cue Integration (eds. Trommershäuser, J., Kording, K. & Landy, M. S.) 5–29 (Oxford University Press, 2011).

LinkOut - more resources