. 2025 Mar 11;8(1):348.
doi: 10.1038/s42003-025-07717-5.

Induction of MASH-like pathogenesis in the Nwd1-/- mouse liver

Affiliations

Induction of MASH-like pathogenesis in the Nwd1-/- mouse liver

Seiya Yamada et al. Commun Biol. .

Abstract

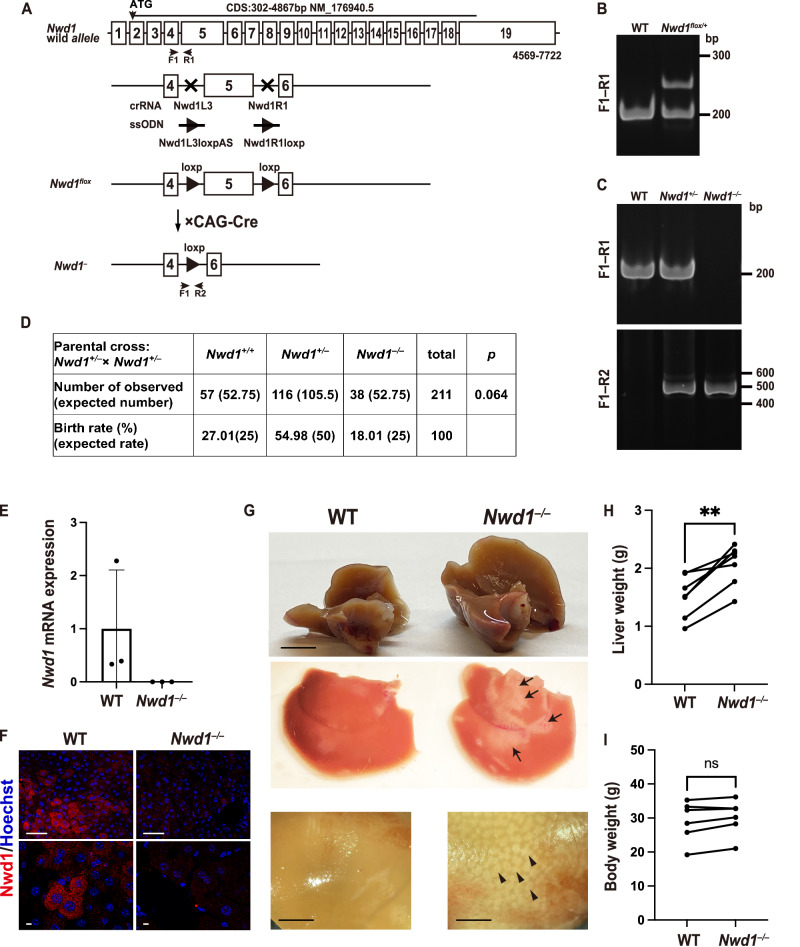
Endoplasmic reticulum (ER) stores Ca2+ and plays crucial roles in protein folding, lipid transfer, and it's perturbations trigger an ER stress. In the liver, chronic ER stress is involved in the pathogenesis of metabolic dysfunction-associated steatotic liver disease (MASLD) and metabolic dysfunction-associated steatohepatitis (MASH). Dysfunction of sarco/endoplasmic reticulum calcium ATPase (SERCA2), a key regulator of Ca2+ transport from the cytosol to ER, is associated with the induction of ER stress and lipid droplet formation. We previously identified NACHT and WD repeat domain-containing protein 1 (Nwd1) localized at the ER and mitochondria. However, the physiological significance of Nwd1 outside the brain remains unclear. In this study, we revealed that Nwd1-/- mice exhibited pathological manifestations comparable to MASH. Nwd1 interacts with SERCA2 near ER membranes. Nwd1-/- livers exhibited reduced SERCA2 ATPase activity and a smaller Ca2+ pool in the ER, leading to an exacerbated state of ER stress. These findings highlight the importance of SERCA2 activity mediated by Nwd1 in the pathogenesis of MASH.


Conflict of interest statement

Competing interests: The authors declare no competing interests.

Figures

Fig. 1
Fig. 1. Generation of Nwd1 knockout mice.
A Schematic diagram of the Nwd1 wild-type allele (top) and the conditional allele of Nwd1flox (middle), in which LoxP sequences were inserted into the introns on both sides (crRNA targeting sites: Nwd1L3 and Nwd1R1) of exon 5 via two rounds of genomic editing using ssODNs (Nwd1L3loxpAS and Nwd1R1loxP). Nwd1flox mice were crossed with CAG-Cre transgenic mice harboring CAG promoter-driven Cre recombinase to generate the Nwd1 null allele (bottom). Upon elimination of the floxed Nwd1 critical exon (exon 5), this allele generates a truncated RNA lacking the NACHT domain of the open-reading frame of Nwd1. B PCR genotyping of wild-type or Nwd1flox/+ tail genomic DNA. The specific primers (primer pair F1‒R1 depicted in A) were used to detect wild-type (189-bp amplicon) and Nwd1flox (229-bp amplicon) alleles. PCR products were separated by 5% SDS-PAGE. C PCR genotyping of wild-type, Nwd1+/−, and Nwd1−/− mice. Specific primers (primer pairs F1‒R1 and F2‒R2 depicted in A) were used to detect wild-type (189-bp amplicon) and Nwd1 (431-bp amplicon) alleles. PCR products were separated by 5% SDS-PAGE. D The table presents the genotypes and birth rates observed in 211 adult mice born from crosses between Nwd1+/− males and females. Numbers in parentheses represent the expected number of offspring and birth rate according to the Mendelian ratio. E Loss of Nwd1 mRNA expression in Nwd1−/− livers. The mRNA isolated from wild-type (n = 3) and Nwd1−/− (n = 3) adult livers were subjected to qRT–PCR targeting for exon 5, and Nwd1 expression was normalized to that of β-actin mRNA. The graph shows the mean ± SD. F Immunostaining of 10–12 month-old male liver tissues with antibody to Nwd1 (red). Nuclei were counterstained with Hoechst dye (blue). Lower panels are magnified views showing individual hepatocytes. G Gross anatomical observation of the 7-month-old male liver. Nwd1−/− livers exhibited hepatomegaly (upper), fiber-like structures on the surface (middle, arrows), and numerous abnormal hepatic lobules that turned whitish (lower, arrowheads). Liver (n = 7) (H) and body weight (n = 6) (I) of 2–9-month-old male Nwd1−/− mice and their wild-type littermates were compared by a paired t-test. Individuals connected by solid lines represent siblings. ns, not significant; **, P < 0.01. Black dots represent each independent biological replicate. Scale bars, 200 μm (F, upper), 5 μm (F, lower), 5 mm (G, upper) or 2 mm (G, lower).
Fig. 2
Fig. 2. MASH-like phenotype in the adult Nwd1−/− mouse liver.
AI Histological analyses of the 2–7-month-old male and female mouse liver. H& E (A, B), oil red O (C, D), and Sirius red (E, F) staining of Nwd1−/− or wild-type livers. Nuclei were counterstained with hematoxylin (C, upper). Welch’s t-test was used to compare the number of swollen hepatocytes (%) (n = 9) (B), oil red O+ area (%) (n = 4) (D), and Sirius red+ fibrotic area (%) (n = 6) (F). Arrows denote swollen hepatocytes in (A) and Sirius red+ fibrotic pathology in (E). G Double staining with anti-cleaved caspase-3 antibody (green) and TUNEL (red). H Immunostaining using anti-cleaved caspase-1 (red) antibody. Nuclei were stained with Hoechst dye (blue). I Comparison of the number of cleaved caspase-3+ cells (%), TUNEL+ cells (%), and cleaved caspase-1+ cells (%). Welch’s t-test, WT: n = 4, Nwd1−/−: n = 6. J Analysis of leukocyte and monocyte counts in peripheral blood (relative number) of 5–9 month-old male and female mice. Welch’s t-test, n = 3. K Liver tissues of 12-month-old male mice immunostained with anti-F4/80 (red). Nuclei were stained with Hoechst dye (blue). L Mean number of F4/80+ cells of total hepatocytes in 10–12-month-old male livers (%) (Welch’s t-test, n = 3). M Triglycerides and total cholesterol content in 9–13 month-old male Nwd1−/− or wild-type livers. Welch’s t-test, WT: n = 6, Nwd1−/−: n = 7. N Triglycerides secretion into the peripheral blood after the Triton WR-1339 administration. Triglycerides and total cholesterol levels in the plasma of 7–11-month-old male and female mice were measured before (0) and 1 and 2 h after the Triton WR-1339 injection. Welch’s t-test, n = 4. ns, not significant; *, P < 0.05; **, P < 0.01; ***, P < 0.001. Black and magenta dots represent each independent biological replicate, and all graphs show the mean ± SD. Scale bars, 40 (A [upper]), 20 (A [lower]) and (E [lower]), 50 (C, E [upper] and K), or 100 µm (G, H).
Fig. 3
Fig. 3. Accumulation of lipid droplets and vacuolar structures in Nwd1−/− hepatocytes.
Electron microscopy of 2–7-month-old male wild-type (A) and Nwd1−/− (B) mouse liver. Arrows in (A) indicate the secretion of lipid droplets from hepatocytes into the wild-type liver sinusoid. B Nwd1−/− hepatocytes contained numerous large vacuolar structures (black arrowheads) partially or entirely filled with electron-dense lipid droplets (red arrows). Lipid droplet staining with Bodipy dye (green) in 2–7-month-old male wild-type (C) and Nwd1−/− livers (D). Cytoplasmic F-actin was stained with phalloidin (magenta), and nuclei were counterstained with Hoechst dye (blue). E Vesicular structures observed in Nwd1−/− hepatocytes were classified into three types: type A, a typical lipid droplet surrounded by a membrane; type B, a vacant vacuole lacking Bodipy+ lipids; and type C, a lipid droplet partially or fully detached from the surrounding vacuolar membrane. The bars denote the distributions of types A, B, and C vesicles in wild-type and Nwd1−/− hepatocytes. EI Quantification of the area occupied by lipid droplets (WT: n = 112, Nwd1−/−: n = 163) (F), the number and size of lipid droplets (G), the area occupied by vacuolar space (WT: n = 54, Nwd1−/−: n = 100) (H), and the number of vacuoles (I) in 2–7-month-old male wild-type and Nwd1−/− hepatocytes. Welch’s t-test, ***, P < 0.001. Black dots represent individual value, and all graphs show the mean ± SD. Scale bars, 2 (A, B), 50 (C [upper] and D [upper]), or 5 µm (C [lower] and D [lower]).
Fig. 4
Fig. 4. Increased ER stress in Nwd1−/− livers.
A WB of wild-type and Nwd1−/− livers from 3–9 month-old males and females using the indicated antibodies. The blot was probed with anti-α-tubulin antibody to confirm equal loading. B Quantitative comparison of protein expression between an Nwd1−/− mouse and its wild-type littermate (paired t-test, n = 6–12). C Survival curves of 3-month-old Nwd1−/− (n = 10) and wild-type (n = 6) mice after TM treatment. D WB of SERCA2 and KDEL proteins in ER fractions prepared from livers with or without TM treatment. E Quantitative comparison of the expression of KDEL protein in D. One-way ANOVA followed by Welch’s t-test with Holm–Bonferroni correction (WT: n = 4, Nwd1−/−: n = 4, WT TM: n = 4, Nwd1−/− TM: n = 6). ns, not significant; *, P < 0.05; **, P < 0.01. Black dots represent each independent biological replicate, and the graph shows the mean ± SD. F, G Electron microscopy of 3-month-old Nwd1−/− and wild-type hepatocytes treated with TM. After TM treatment, a significantly increased number of small vacuoles (black arrowheads) and large lipid droplets (red arrows) were observed in both wild-type and Nwd1−/− livers. H, I Lipid (Bodipy, green) and ER (anti-KDEL, magenta) staining of wild-type and Nwd1−/− livers with or without TM treatment. Nuclei were counterstained with Hoechst dye (cyan). Scale bars, 2 μm (F, G), 50 μm (H, I).
Fig. 5
Fig. 5. Nwd1 binds to SERCA2.
A Purification of Halo-Nwd1 recombinant protein expressed in HEK293T cells. CBB staining of the SDS-PAGE gel of the cell lysate and purified protein. B Identification of Halo-Nwd1-binding proteins by nanoLC-MS/MS. The list of representative Nwd1-binding proteins presents the gene symbols, spectral counts in proteomic analysis, and UniProt database entry numbers. C GO enrichment and KEGG pathway analyses of Nwd1-binding proteins. D HEK293T cells expressing Flag-Nwd1. ICC with anti-Nwd1 (green) and anti-KDEL (red) antibodies, revealing the colocalization of Nwd1 with the ER. E Immunoelectron microscopy showing the localization of Flag-Nwd1 in the vicinity of the ER. HeLa cells were transfected with Flag-Nwd1 and immunostained with anti-Flag antibody (gold particle). Arrows indicate the Nwd1 signals on or near the ER membranes. MT, mitochondria. F Analysis of the Nwd1 region required for localization to the ER. HEK293T cells were transfected with mCherry-Sec61B and Flag-Nwd1, Flag-Nwd1-N, or Flag-Nwd1-C. Cells were stained with anti-Flag (green) antibody. G Structure and topology of mouse SERCA2b protein (1044 amino acids, accession number NP_733765.1). Blue boxes denote the cytosolic regions comprising the A (amino acids 1–43 and 124–235), N (amino acids 360–600), and P domains (amino acids 330–359 and 601–739), which are involved in ATPase activity. Black boxes denote 11 transmembrane domains, and white boxes denote the ER luminal regions. The red and yellow lines represent SERCA2b–N (amino acids 1–787) and SERCA2b–C (amino acids 788–1044), the deletion mutants of SERCA2b produced in this study. H Colocalization of Nwd1 and SERCA2 at the ER. HEK293T cells were transfected with EGFP-Nwd1 and stained with anti-SERCA2 (red) antibody. I HEK293T transfected with EGFP-Nwd1 and Flag-SERCA2, Flag-SERCA2-N, or Flag-SERCA2-C were stained with anti-Flag (green) antibody. Scale bars, 5 μm (D, F, H, I) or 100 nm (E).
Fig. 6
Fig. 6. SERCA2 ATPase activity and ER Ca2+ storage are suppressed in the Nwd1−/− liver.
A SERCA2 ATPase activity in the ER fractions of 9-month-old male wild-type (n = 10) and Nwd1−/− (n = 7) livers. Ca2+ storage in the ER (B) or mitochondrial (C) fractions of 3–9-month-old male wild-type and Nwd1−/− livers (n = 6). Welch’s t-test, ns, not significant; **, P < 0.01; ***, P < 0.001. Black dots represent each independent biological replicate, and all graphs show the mean ± SD. D Summary of MASH-like hepatic pathogenesis caused by Nwd1 deficiency and a model for dysfunction of the SERCA2 Ca2+ pump in the Nwd1−/− liver ER. Decreased activity of SERCA2 in the Nwd1−/− liver induces ER stress by reducing Ca2+ stores in the ER, leading to diverse hepatic pathologies, including the accumulation of ER-derived vacuolar structures with lipid droplets, fibrosis, and pyroptosis. The ER membranes of Nwd1−/− livers featured an increased population of SERCA2 with no or reduced pump activity (indicated by crosses and thin arrows), lowering Ca2+ stores inside the ER.

References

    1. Rinella, M. E. et al. A multisociety Delphi consensus statement on new fatty liver disease nomenclature. Hepatology78, 1966–1986 (2023). - DOI - PMC - PubMed
    1. Friedman, S. L., Neuschwander-Tetri, B. A., Rinella, M. & Sanyal, A. J. Mechanisms of NAFLD development and therapeutic strategies. Nat. Med.24, 908–922 (2018). - DOI - PMC - PubMed
    1. Gluchowski, N. L., Becuwe, M., Walther, T. C. & Farese, R. V. Jr. Lipid droplets and liver disease: from basic biology to clinical implications. Nat. Rev. Gastroenterol. Hepatol.14, 343–355 (2017). - DOI - PMC - PubMed
    1. Scorletti, E. & Carr, R. M. A new perspective on NAFLD: focusing on lipid droplets. J. Hepatol.76, 934–945 (2022). - DOI - PubMed
    1. Ben-Moshe, S. et al. Spatial sorting enables comprehensive characterization of liver zonation. Nat. Metab.1, 899–911 (2019). - DOI - PMC - PubMed

Substances