. 2025 Mar 11;8(1):410.
doi: 10.1038/s42003-025-07828-z.

Mitochondrial dysfunction drives a neuronal exhaustion phenotype in methylmalonic aciduria

Affiliations

Mitochondrial dysfunction drives a neuronal exhaustion phenotype in methylmalonic aciduria

Matthew C S Denley et al. Commun Biol. .

Abstract

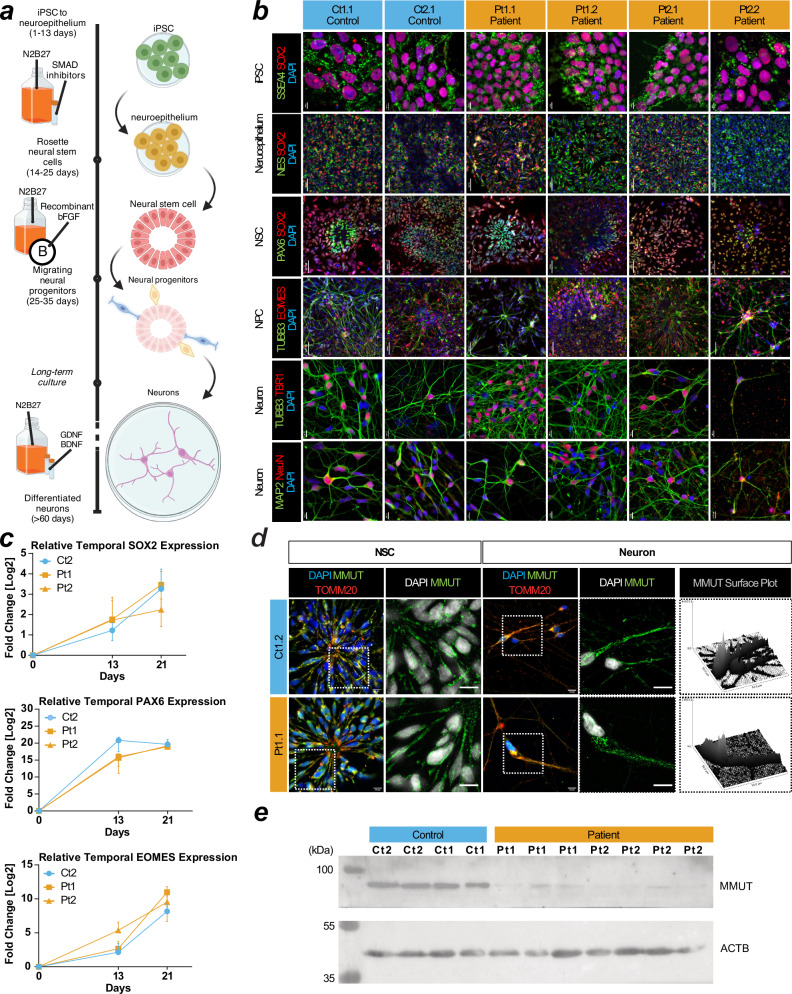
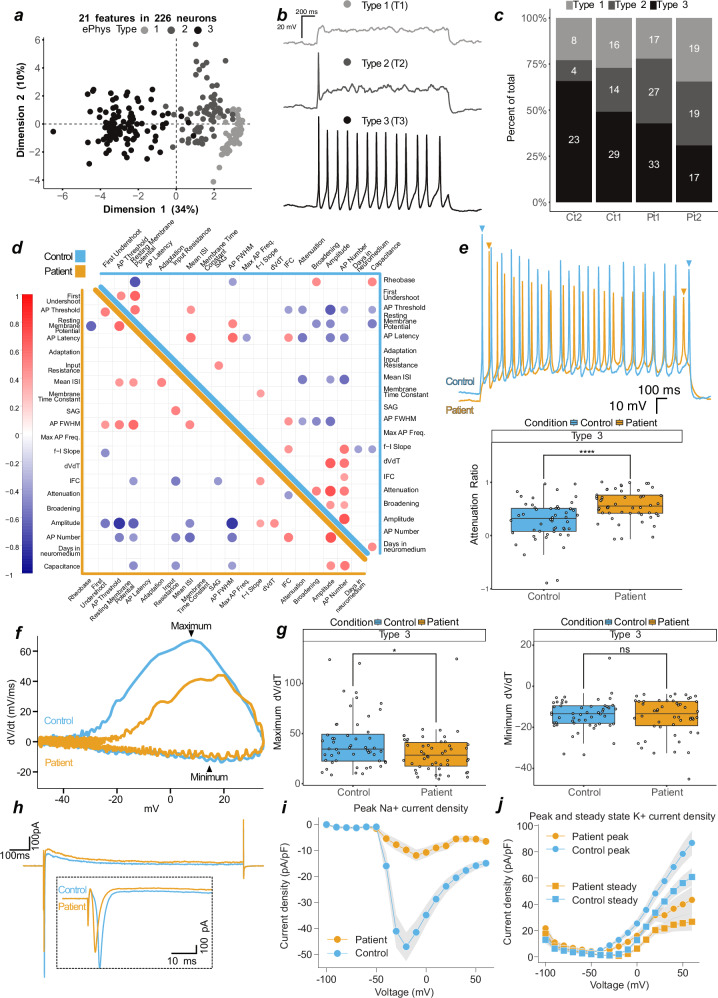
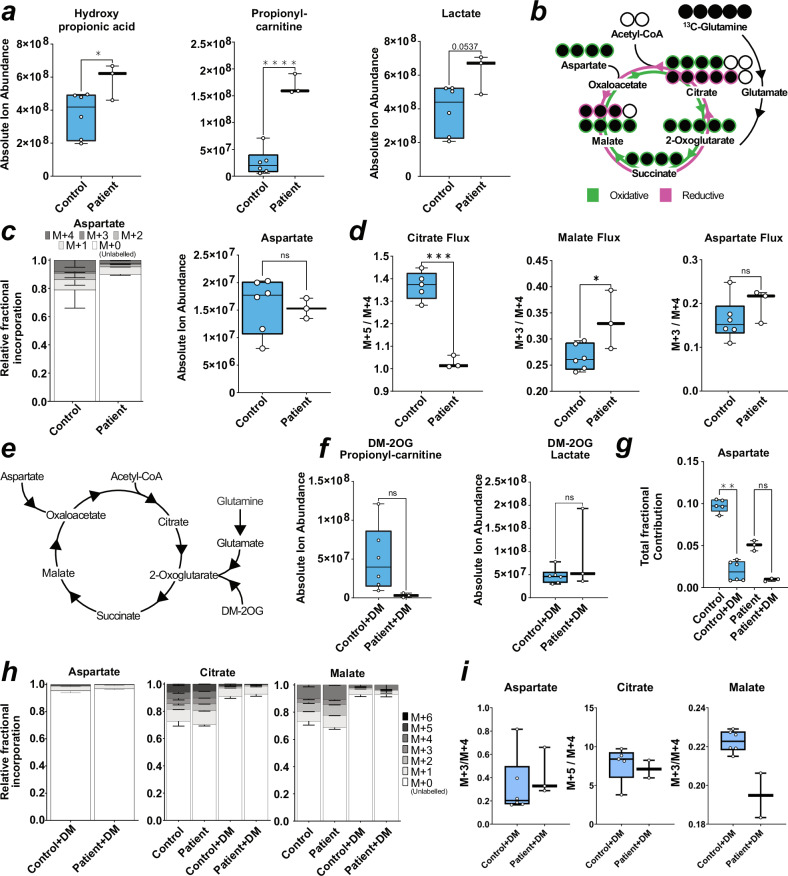
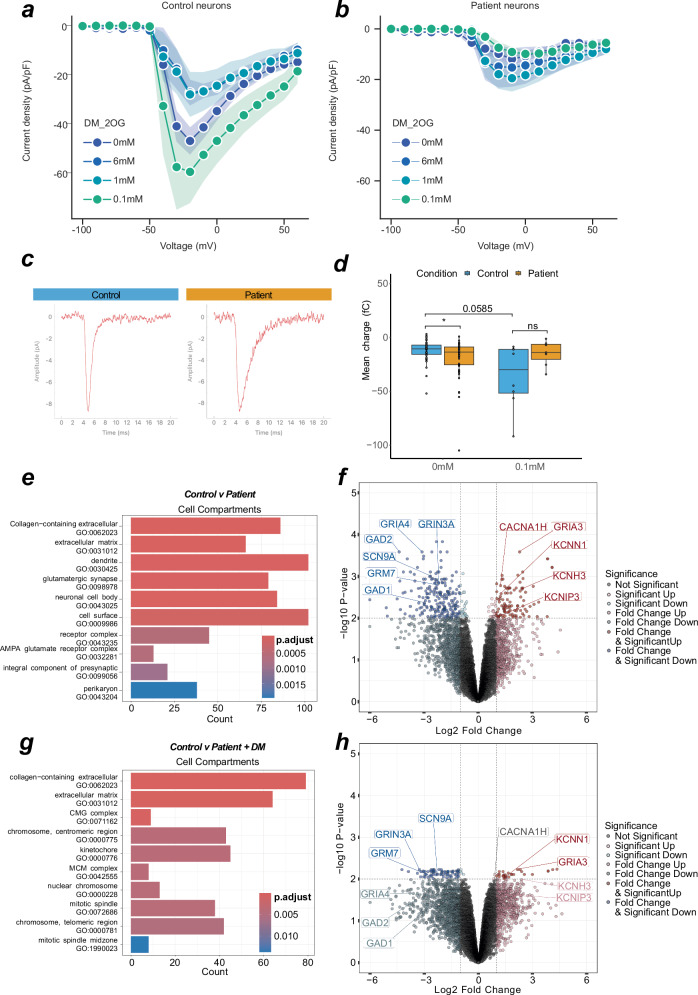
Methylmalonic aciduria (MMA) is an inborn error of metabolism resulting in loss of function of the enzyme methylmalonyl-CoA mutase (MMUT). Despite acute and persistent neurological symptoms, the pathogenesis of MMA in the central nervous system is poorly understood, which has contributed to a dearth of effective brain specific treatments. Here we utilised patient-derived induced pluripotent stem cells and in vitro differentiation to generate a human neuronal model of MMA. We reveal strong evidence of mitochondrial dysfunction caused by deficiency of MMUT in patient neurons. By employing patch-clamp electrophysiology, targeted metabolomics, and bulk transcriptomics, we expose an altered state of excitability, which is exacerbated by application of dimethyl-2-oxoglutarate, and we suggest may be connected to metabolic rewiring. Our work provides first evidence of mitochondrial driven neuronal dysfunction in MMA, which through our comprehensive characterisation of this paradigmatic model, enables first steps to identifying effective therapies.


Conflict of interest statement

Competing interests: The authors declare no competing interests.

Figures

Fig. 1
Fig. 1. Generation of iPSC-derived MMUT-deficient neurons from individuals with methylmalonic aciduria.
a Schematic of the affected metabolic pathway in MMUT deficiency. Created in BioRender. b Brightfield and epifluorescent acquisitions of pluripotency (NANOG, SSEA4, SOX2) and proliferation (Ki67) markers in representative iPSC cultures from control and patient lines. Scale, 50 μm. c Ectoderm lineage indicated by beta-tubulin III (TUJ1) and nestin (NES) positive cells after 12 days in vitro (DIV). Endoderm lineage indicated by anti-α-Fetoprotein (AFP) positive cells after 4 days in vitro (DIV). Mesoderm lineage indicated by alpha-smooth muscle actin (SMA) and brachyury positive cells after 4 DIV. Scale, 10 μm. d Comparison of the anti-MMUT (green) staining pattern from representative patient fibroblast-derived iPSCs compared to controls. Representative images come from cell line Ct1.2 and Pt1.1 For reference, anti-TOMM20, a mitochondrial protein, is also shown (red). Scale, 50 μm. e Western blotting analysis of derived iPSCs using anti-MMUT. MMUT is anticipated at 83 kDa. The loading control ACTB is anticipated at 42 kDa. Uncropped membranes are available in Supplementary Fig. 12. f Propionate incorporation of two Ct1.1 and Ct1.2 wildtype iPSC sub-clones and Pt1 and Pt2 patient cell lines. Data points represent independent measurements taken from 3 separate cultures per cell line. Mean control iPSC incorporation values were 22.71 and 24.36 pmol/mg.protein/16 h. Patient iPSC incorporation values were 0.77 pmol/mg.protein/16 h in Pt1 and 0.44 pmol/mg.protein/16 h in Pt2. P-value was tested using Mann–Whitney U-test (**, < 0.01). Error is presented as standard deviation.
Fig. 2
Fig. 2. Derivation of cortical neurons from iPSCs affected by methylmalonic aciduria.
a Schematic of the 2D neuron differentiation protocol used in this article. Created using BioRender Forny, P. (2025) https://BioRender.com/w70y299. b Staining for SSEA4 and SOX2 at day 0 for pluripotent stem cells (iPSC). Staining for Nestin (NES) and SOX2 at day 13 for neuroepithelium. Staining for PAX6 and SOX2 at day 21 for neural stem cells (NSCs). Staining for TUBB3 and EOMES at day 40 for cortical progenitors. Staining for TUBB3/TBR1 and MAP2/NeuN at day 50 signal postmitotic deep layer cortical neurons and pan-neuronal molecular markers in cultures, respectively. Scale: iPSCs and neurons have 10 µm bars. Neuroepithelium, NSC, and NPCs have 50 µm bars. c RT-qPCR of SOX2, PAX6, and EOMES in iPSCs at day 0, neuroepithelium day 13, and NSCs day 21. Datapoints are representative of at least 3 independent experiments and error is reported as standard deviation. Expression values are relative to measurements at day 0 for each cell line. d Immunocytochemistry of patient and control NSC and neurons. Scale, 10 μm. e Western blotting analysis of neurons using anti-MMUT. MMUT is anticipated at 83 kDa. The loading control ACTB is anticipated at 42 kDa. Uncropped membranes are available in Supplementary Fig. 12.
Fig. 3
Fig. 3. Patient neurons show mitochondrial dysfunction that overlaps with loss of MMUT protein.
a Left and middle: MMUT+ signal (green) and TOMM20+ mitochondrial signal (red). Right: TOMM20+ signal (magenta) and colocalization with MMUT (white). Representative images were selected from Ct1.2 and Pt1.2 cell lines. Orthogonal representative slices are also shown. Scale is 10 μm. b Pearson correlation coefficient of TOMM20+ regions of interest (ROIs). One data point represents a Pearson’s coefficient from one ROI. 3–5 ROIs per image, total images used from control n = 6 (18 total ROIs) and from patient n = 11 (50 total ROIs). P-value determined by one-way ANOVA with multiple testing (ns, >0.05; ****, <0.0001) Datapoints represent Ct1.2, Ct2, Pt1.1, Pt1.2, and Pt2.1. Error is plotted as min. to max. c Neuronal mitochondria stained with MMUT and TMRM (both grey). Scale is 10 μm. Representative images were selected from Ct2, Pt1.1, and Pt2.1. d TMRM+ ROIs selected from non-overlapping confocal images. Cumulative data is representative of n = 6 in control without rotenone, n = 4 in control with rotenone, n = 8 in patient without rotenone, n = 9 in patient with rotenone. One datapoint represents one background/size-corrected ROI. P-value determined by Kruskal–Wallis with multiple testing (ns, >0.05; *, <0.05; ****, <0.0001). Datapoints represent Ct2, Pt1.1, and Pt2.1. Bar represents the median value. e Western blotting analysis of MMUT, caspase-3 (CASP3), its cleaved product, and ß-actin (ACTB) in total cell lysate from untreated neurons. Each column represents an independent lysate. Uncropped membranes are available in Supplementary Fig. 12. f Quantification of DAPI+ apoptotic cells determined from representative, non-overlapping, epifluorescent images acquired using a 63x objective. Images were taken of fixed untreated neurons at day 50 in vitro. Datapoints in control represent Ct1.2 and Ct2, and datapoint in patient represent Pt1.1, Pt1.2, Pt2.1, and Pt2.2. Cumulative data is representative of n = 43 (776 cells) in control and n = 87 (1317 cells) in patient images. Significance is assessed by Mann–Whitney test (****, < 0.0001). Error is standard deviation. Dunn’s multiple comparisons test used in (b, d).
Fig. 4
Fig. 4. Patient neurons show action potential exhaustion driven by reduced sodium currents.
a First two dimensions (44% variance explained) of a principal component analysis of 21 measured features from patient (n = 132 (Pt1 n = 77, Pt2 n = 55)) and control (n = 94 (Ct1 n = 59, Ct2 n = 35)) neurons. Greyscale represents 3 identified neuronal types, type 1 (light grey, T1, n = 60), type 2 (dark grey, T2, n = 64), and type 3 (black, T3, n = 102). b Current-clamp, representative traces from T1, T2, or T3 neurons in response to depolarizing current injection. c Proportional generation of classified neurons of control (Ct1, Ct2) and patient (Pt1, Pt2). d Correlation matrix of 21 features in patient (bottom-left, orange) and control (top-right, blue) neurons. Positive correlations indicated by red and negative by blue. Features with significance P = < 0.01 are displayed on the matrix, values above are blank. e Top, overlayed traces from T3 control and patient neurons. Bottom, attenuation ratio from 102 measured T3 neurons. f Phase plots of 2 overlayed single action potentials from representative T3 control and patient neurons. g Depolarisation (left, maximum dV/dt) and repolarisation (right, minimum dV/dt) velocities. h Voltage-clamp, representative overlay of currents evoked by step to −30 or −20 mV in control and patient neurons, respectively. Inset is an enlarged section of the initial segment. i Peak control (n = 67) and patient (n = 66) sodium current densities. j Peak and steady control (n = 67) and patient (n = 66) potassium current densities. In (ij), current densities are normalised to capacitance, and variation is SD and present as shaded area. In e and g, datapoints represent one neuron, data are pooled into control (2 independent lines) and patient (2 independent lines), significance is by t-test and reported with p-value adjustment using Holm, and whiskers represent 1.5·IQR.
Fig. 5
Fig. 5. Metabolomics reveal dysregulated glutamate and glutamine neuronal metabolism.
a Box plots of absolute ion abundance of disease-related metabolites. P-value is reported as one-way ANOVA for hydroxypropionic acid, and unpaired t-test for propionyl-carnitine, and lactate. b Schematic of labelled 13C-glutamine metabolism into the TCA cycle. Labelled carbons = filled black circles. c Stacked bar chart of contribution of labelled glutamine carbons to aspartate (left) and box plot of absolute ion abundance of aspartate pool (right). P-value calculated via unpaired t-test. d Box plot of ratio between M + 5 to M + 4 labelled citrate fractions (left) and box plot of ratio between M + 3 to M + 4 labelled malate or aspartate fractions (right). P-value is reported as unpaired t test. e Representative schematic for the entry of dimethyl-2-oxoglutarate (DM-2OG) into the TCA cycle and selected anaplerotic entry points. f Box plot of absolute ion abundance of propionyl-carnitine and lactate in DM-2OG treated neurons. P value is reported as unpaired t test. g Box plot of total fractional contribution of carbons to untreated and DM-2OG treated neuronal abundance of aspartate. P-value is reported as Mann–Whitney (left). h Stacked bar chart of contribution of labelled carbons to untreated and DM-2OG treated neuronal abundance of malate (left) and citrate (right). i Box plots of ratio between M + 3 to M + 4 labelled aspartate and malate fractions (left and right) in DM-2OG treated neurons and box plot of ratio between M + 5 to M + 4 labelled citrate fractions (middle) in DM-2OG treated neurons. In (a, c, d, f, g, h), error = min/max (box plot) or SD (fractional bar plot). Each datapoint represents 3 technical replicates from one independent sample. Genotype conditions are pooled into control (blue) and patient (no colour). In significance tests: ns ≥ 0.05, * ≤ 0.05, *** ≤ 0.001, **** ≤ 0.0001. In all panels, control is represented by Ct1.2 and Ct2. Patient is represented by Pt1.2 and Pt2.2.
Fig. 6
Fig. 6. Metabolic rewiring affects glutamatergic synaptic transmission.
a Line graph indicating maximum current density at evoked voltages in control neurons with various DM-2OG treatments. Datapoint represents at least 5 independent samples, error = SD represented by shading. b Line graph indicating maximum current density at evoked voltages in patient neurons with various DM-2OG treatments. Datapoint represents at least 6 independent samples, error = SD represented by shading. c Representative averaged traces of spontaneous synaptic currents from single control (n events = 114) or patient (n events = 36) neurons in voltage-clamp. d Box plot of spontaneous synaptic event charge of individual neurons in voltage-clamp. P value is calculated via mann–whitney. e Over-representation analysis of top 10 up and down-regulated GO terms from untreated control (n = 5) and patient (n = 6) derived neurons. Count refers to number of contributing genes. f Volcano plot of differential regulation between untreated control (n = 5) and patient (n = 6) neurons. g Over-representation analysis of top 10 up- and down-regulated GO terms. Count refers to number of contributing genes from untreated control (n = 5) and 0.1 mM DM-2OG treated patient (n = 4) derived neurons. h Volcano plot of differential regulation between untreated control (n = 5) and 0.1 mM DM-2OG treated patient (n = 4) neurons. In (c, d), each datapoint represents one independent sample. Genotypes are control (blue) and patient (orange). In (a, b) centre is the mean and error are SD. In (c, e) colour represents P value magnitude. In (f, h) values are FDR, genes highlighted contribute to a top differentially regulated GO term. Dotted lines indicate Log2 fold change of 1 and -log10 P-value of 0.01. In (d), box plot is median and min/max. In panels (ad), control is represented by Ct1 and Ct2, and patient is represented by Pt1 and Pt2. In panels (eh), control is represented by Ct1.2 and Ct2, and patient is represented by Pt1.1, Pt1.2, Pt2.1, and Pt2.2.

References

    1. Rath, S. et al. MitoCarta3.0: an updated mitochondrial proteome now with sub-organelle localization and pathway annotations. Nucleic Acids Res.49, D1541–D1547 (2021). - DOI - PMC - PubMed
    1. Schaefer, A., Lim, A. & Gorman, G. Epidemiology of Mitochondrial Disease. In: Diagnosis and Management of Mitochondrial Disorders (eds. Mancuso, M. & Klopstock, T.) 63–79 (Springer International Publishing, 2019). 10.1007/978-3-030-05517-2_4.
    1. Rahman, S. Mitochondrial disease in children. J. Intern. Med.287, 609–633 (2020). - DOI - PubMed
    1. Rahman, J. & Rahman, S. Mitochondrial medicine in the omics era. Lancet Lond. Engl.391, 2560–2574 (2018). - DOI - PubMed
    1. Wajner, M. Neurological manifestations of organic acidurias. Nat. Rev. Neurol.15, 253–271 (2019). - DOI - PubMed

MeSH terms

Substances

Supplementary concepts

LinkOut - more resources