. 2025 May;7(5):952-965.
doi: 10.1038/s42255-025-01243-8. Epub 2025 Mar 11.

Glycogen drives tumour initiation and progression in lung adenocarcinoma

Affiliations

Glycogen drives tumour initiation and progression in lung adenocarcinoma

Harrison A Clarke et al. Nat Metab. 2025 May.

Abstract

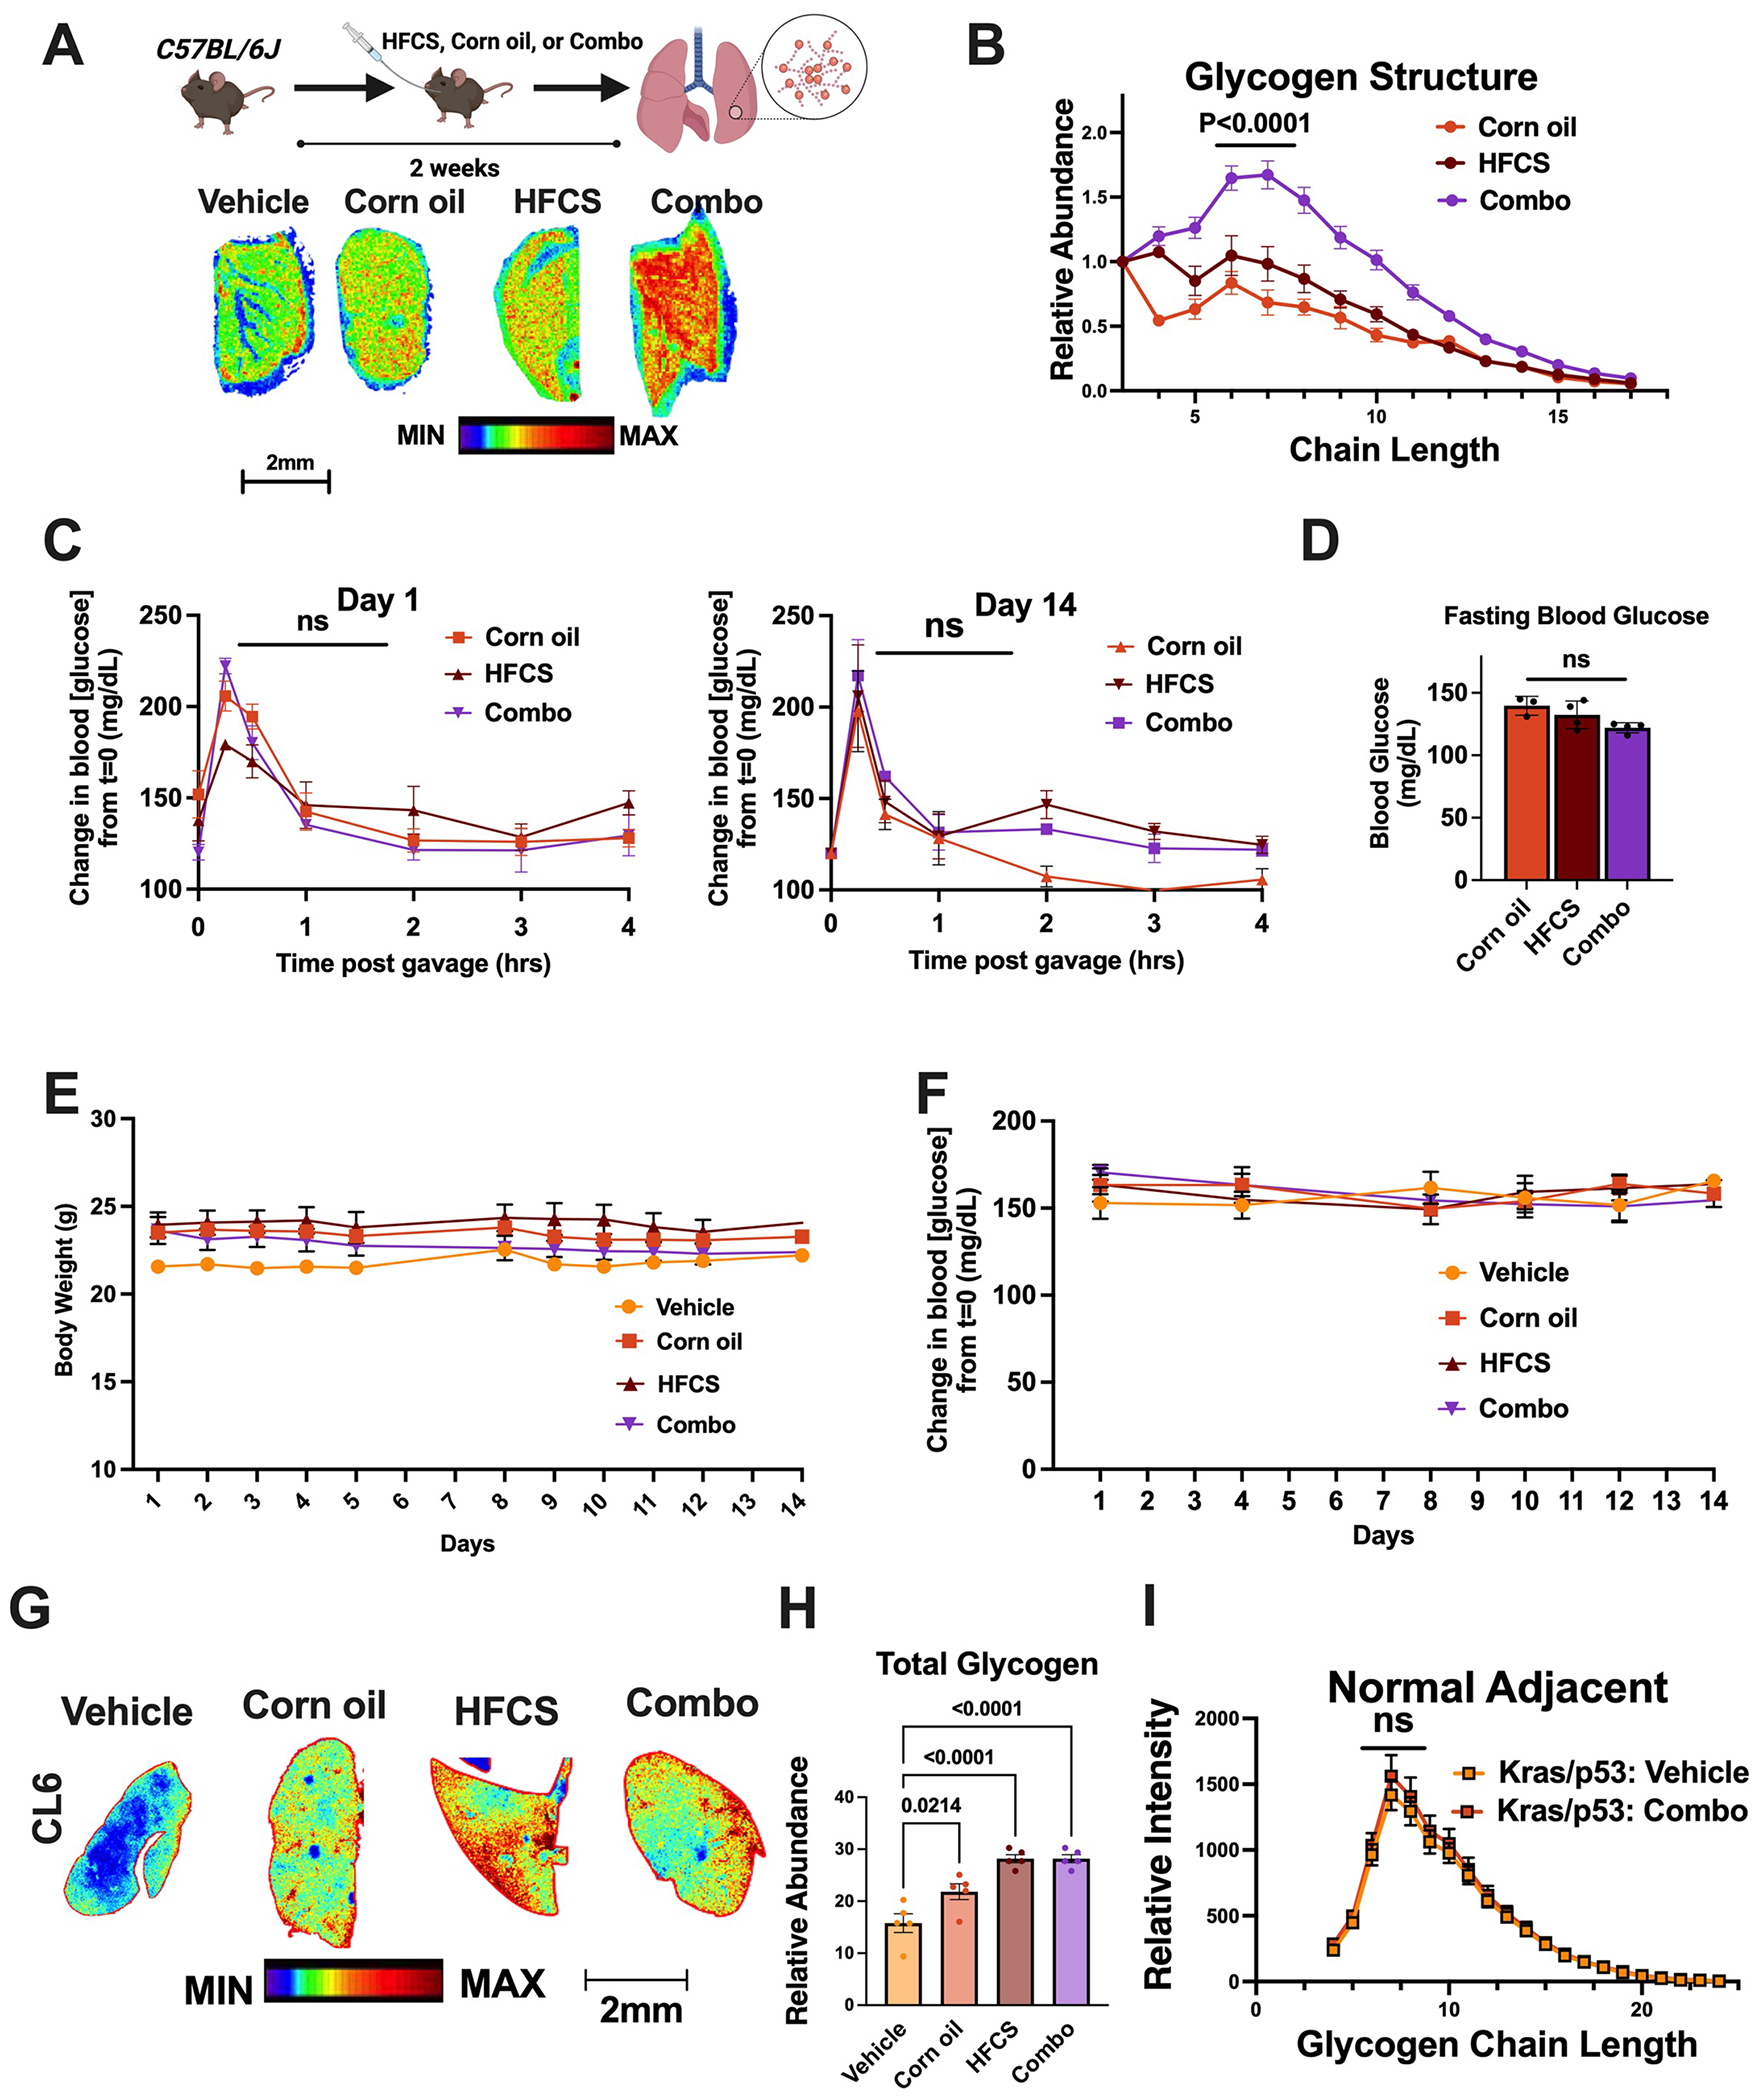
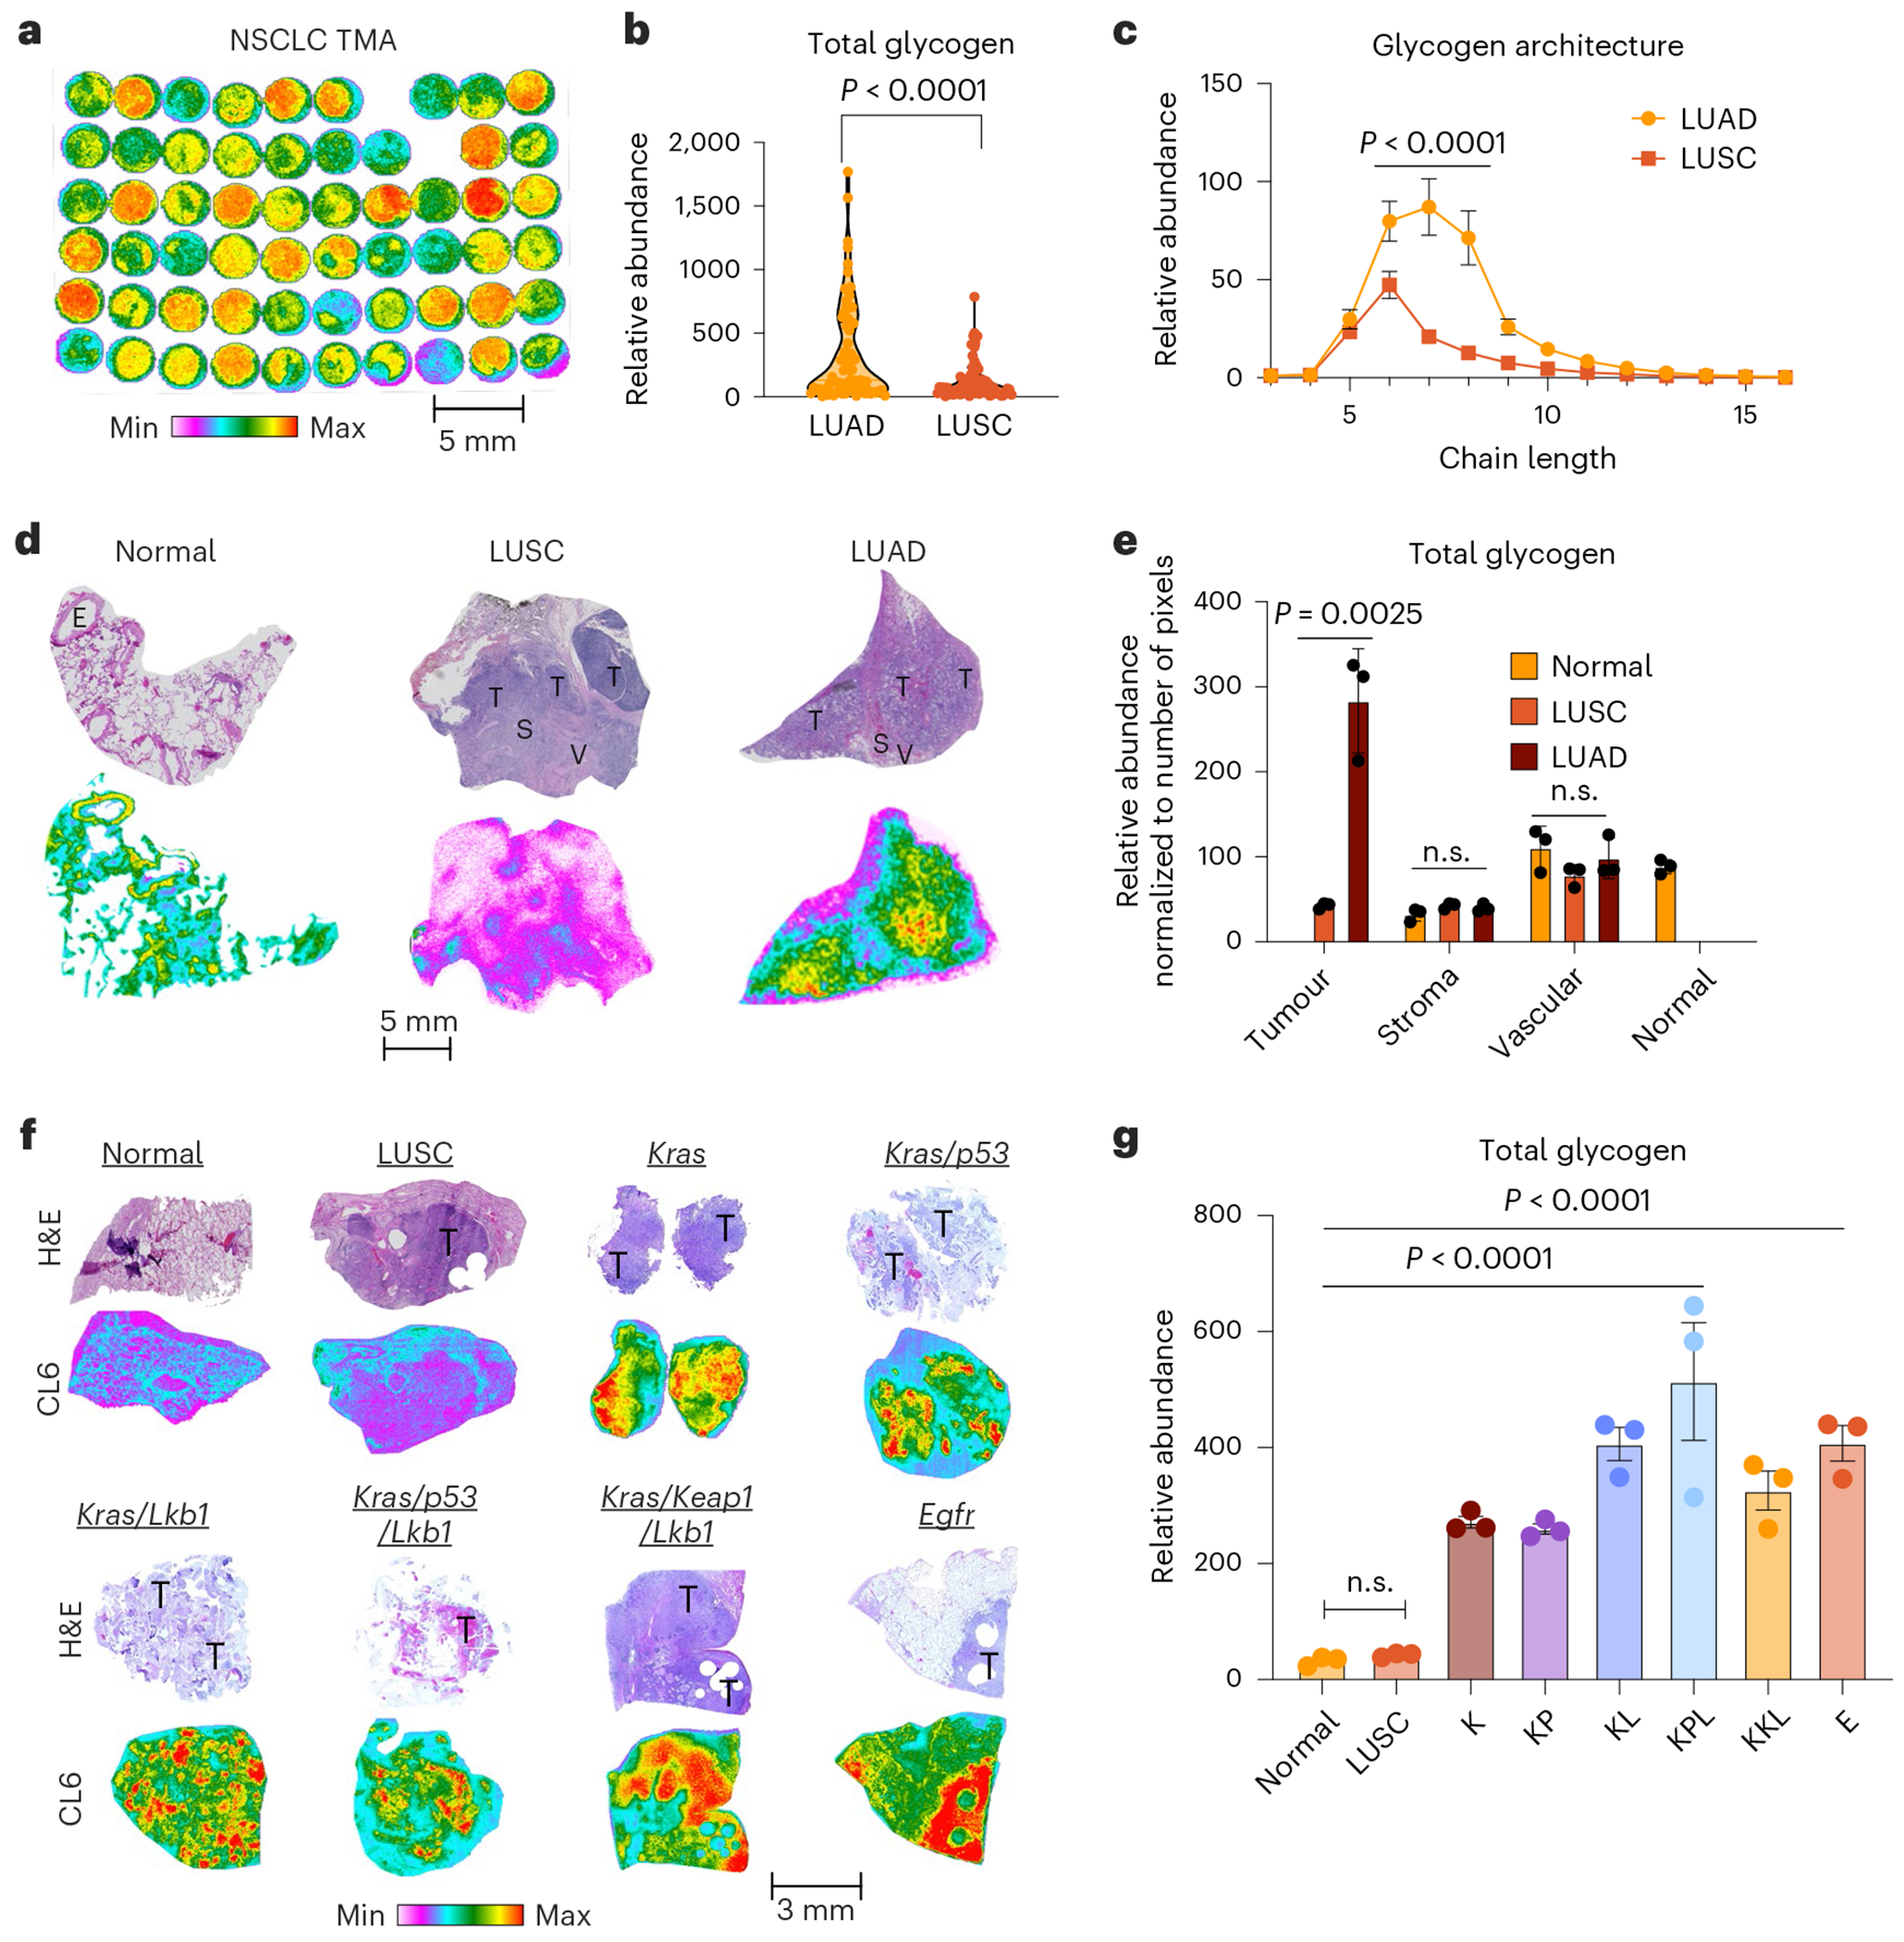
Lung adenocarcinoma (LUAD) is an aggressive cancer defined by oncogenic drivers and metabolic reprogramming. Here we leverage next-generation spatial screens to identify glycogen as a critical and previously underexplored oncogenic metabolite. High-throughput spatial analysis of human LUAD samples revealed that glycogen accumulation correlates with increased tumour grade and poor survival. Furthermore, we assessed the effect of increasing glycogen levels on LUAD via dietary intervention or via a genetic model. Approaches that increased glycogen levels provided compelling evidence that elevated glycogen substantially accelerates tumour progression, driving the formation of higher-grade tumours, while the genetic ablation of glycogen synthase effectively suppressed tumour growth. To further establish the connection between glycogen and cellular metabolism, we developed a multiplexed spatial technique to simultaneously assess glycogen and cellular metabolites, uncovering a direct relationship between glycogen levels and elevated central carbon metabolites essential for tumour growth. Our findings support the conclusion that glycogen accumulation drives LUAD cancer progression and provide a framework for integrating spatial metabolomics with translational models to uncover metabolic drivers of cancer.


Conflict of interest statement

Competing interests: R.C.S. has received research support and consultancy fees from Maze Therapeutics. R.C.S. is a member of the Medical Advisory Board for Little Warrior Foundation. M.S.G. has research support and research compounds from Maze Therapeutics, Valerion Therapeutics and Ionis Pharmaceuticals. M.S.G. also received consultancy fee from Maze Therapeutics, PTC Therapeutics and the Glut1-Deficiency Syndrome Foundation. D.B.A. receives book royalty from Wolters Kluwer. The other authors declare no competing interests.

Figures

Extended Data Fig. 1 |
Extended Data Fig. 1 |. Validation of MALDI glycogen imaging with anti-glycogen antibody staining in lung adenocarcinoma (LUAD) and lung squamous cell carcinoma (LUSC) tissues.
a, Representative images of MALDI glycogen imaging (left) and corresponding anti-glycogen antibody staining (right) in two LUAD and one LUSC patient tissue samples. b, Detailed view of various tumor regions stained with anti-glycogen antibody showing predominately tumors positive for glycogen similar to MALDI analysis. Labels indicate tumor (T), stroma (S), normal adjacent tissue (N), vessels (V), necrosis (Ne), smooth muscle (SM), cartilage (C), and chondrocytes (Cc). c, Tissue overlays combining anti-glycogen antibody staining and MALDI glycogen imaging performed in SCILs software. The upper panels show the antibody staining with outlined regions for zoomed-in views, and the lower panels display the corresponding MALDI imaging overlays. c and c represent three biological replicates (individual patients). Black boxes indicate areas magnified in the zoomed-in images to illustrate the concordance between glycogen imaging and antibody staining.
Extended Data Fig. 2 |
Extended Data Fig. 2 |. MALDI glycogen imaging workflow and profiling of human tissue microarray (TMA) and mouse GEMM tumors.
a, Schematic of the MALDI glycogen imaging workflow. Tissue sections are subjected to antigen retrieval, followed by treatment with isoamylase and application of the CHCA matrix. The isoamylase enzyme digests glycogen into glucose polymers, which are then detected and visualized using MALDI mass spectrometry. Created with BioRender.com. b, Representative H&E staining (top row) and MALDI glycogen imaging (bottom row) of lung adenocarcinoma (LUAD) and lung squamous cell carcinoma (LUSC) tissue cores from a TMA, image represents single run from three repeats, Scale bar: 2 mm. c, Representative H&E staining (top row) and MALDI glycogen imaging (bottom row) of normal lung tissue and various genetically engineered mouse model (GEMM) tumors. The GEMM tumors include K (Kras), KP (Kras; Pten), KL (Kras; Lkb1), and E (Egfr). Scale bar represents 3 mm. d, Quantification of total glycogen levels in normal lung tissue and GEMM tumors, as measured by MALDI glycogen imaging. Bar graph shows the relative abundance of glycogen in normal, K, KP, KL, and E tissues (n = 6/group; mean +/−s.e.m. p-values indicated; one-way ANOVA and Tukey’s multiple comparison test).
Extended Data Fig. 3 |
Extended Data Fig. 3 |. Determination of absolute glycogen concentration using spotted standards by MALDI imaging.
a, Scanned image showing the location of spotted glycogen standards (0.06, 0.18, 0.55, 1.6, and 5 ng) next to a tissue section on a microscope slide. b, Mass spectra of different glycogen concentrations spotted on the slide, indicating the glucose polymer 7 m/z peaks corresponding to varying amounts of glycogen. c, XY plots showing the relationship between glycogen concentration (ng) and relative intensity per pixel for each spotted standard. d, Log-transformed plots of relative intensity versus glycogen concentration for the standards for different glucose chain length indicated above. The linear regression lines indicate the strong correlation used for glycogen quantification. R2 values for each plot are shown, line equations are displayed on top. e, Absolute quantification of glycogen in four human lung adenocarcinoma (LUAD) and one lung squamous cell carcinoma (LUSC) tissue sections (n = 3 ROIs of 500 pixels/tissue; mean +/− s.e.m. p-values indicated; one-way ANOVA adjusted for Tukey’s multiple comparisons).
Extended Data Fig. 4 |
Extended Data Fig. 4 |. Glycogen accumulation correlates with tumor grade and predicts survival outcomes.
a, Representative immunohistochemical staining of glycogen in well differentiated (top) and poorly differentiated (bottom) tumour regions. T, tumour tissue; S, stromal tissue. b, Quantification of normalized glycogen intensity (adjusted for stromal regions) across tumour samples stratified by differentiation status: well, moderate, and poor in 247 LUAD patients (mean +/− s.e.m. p-values indicated). c, Kaplan-Meier survival curves illustrating the relationship between glycogen levels and patient survival. Top: Patients divided by the median glycogen expression level (low vs. high). Bottom: Survival analysis stratified into glycogen low (quartile), mid (50th percentile), and high (quartile) groups. Log-rank test p-value indicates a significant association between high glycogen content and decreased survival (p < 0.0001). d, Predictive performance of a random forest model for glycogen intensity in relation to survival outcomes, shown through the area under the receiver operating characteristic (AUROC = 0.846) and the area under the precision-recall curve (AUPRC = 0.888).
Extended Data Fig. 5 |
Extended Data Fig. 5 |. Impact of different diets on glycogen and glucose metabolism in C57BL/6 J mice.
a, Top: Schematic of the experimental design where C57BL/6 J mice were fed with vehicle, corn oil, high-fructose corn syrup (HFCS), or a combination (Combo) diet for 2 weeks. Created with BioRender.com. Bottom: MALDI glycogen imaging of lung tissues from mice subjected to different dietary treatments. Scale bar: 2 mm. b, Glycogen structure analysis in the lung tissues of WT mice treated with different diets. The graph shows the relative abundance of glycogen chain lengths in mice fed with corn oil, HFCS, or the Combo diet (n = 3 mice; mean +/− s.e.m. p-values indicated; two-way ANOVA adjusted for Tukey’s multiple comparisons). c, Glucose tolerance test results for mice on Day 1 (left) and Day 14 (right) post-treatment. The graphs show changes in blood glucose levels (mg/dL) over time following glucose gavage. No significant differences (ns) were observed among the different diet groups (n = 3 mice; mean +/− s.e.m. p-values indicated; two-way ANOVA adjusted for Tukey’s multiple comparisons). d, Fasting blood glucose levels (mg/dL) in the same cohort of mice. No significant differences (ns) were observed among the different diet groups (n = 3 mice; mean +/− s.e.m. p-values indicated; two-way ANOVA adjusted for Tukey’s multiple comparisons). e, Body weight (g) of mice over the 14-day treatment period, showing no significant differences among the diet groups (n = 3 mice; mean +/− s.e.m. p-values indicated; two-way ANOVA adjusted for Tukey’s multiple comparisons). f, Changes in blood glucose levels (mg/dL) over the 14-day treatment period, showing no differences among the diet groups (n = 3 mice; mean +/− s.e.m. p-values indicated; two-way ANOVA adjusted for Tukey’s multiple comparisons). g, Liver glycogen imaging using CL6 staining in mice fed with vehicle, corn oil, HFCS, or the Combo diet. Scale bar: 2 mm. h, Quantification of total glycogen in liver tissues from mice subjected to different dietary treatments (n = 3 mice; mean +/− s.e.m. p-values indicated; one-way ANOVA adjusted for Tukey’s multiple comparison). i, Glycogen chain length analysis in normal adjacent tissues from KP and KP Combo-treated mice related to Fig. 3. The graph shows the relative intensity of glycogen chain lengths, (n = 6 mice; mean +/− s.e.m. two-way ANOVA for Tukey’s multiple comparison).
Extended Data Fig. 6 |
Extended Data Fig. 6 |. Laforin expression, phosphorylated glycogen analysis, and glycogen dynamics in LKO animals.
a, Representative IHC images of tissue cores and zoomed-in views stained with antibodies against Laforin in LUSC (leftmost), Laforin in LUAD (second from left), GP (glycogen phosphorylase), and GYS (glycogen synthase,), image represents single replicates from three repeats. b, Phosphorylated glycogen chain length analysis in LUAD and LUSC tissue cores from TMA (n = 67 patients for LUAD, 52 for LUSC, mean +/− s.e.m. p-values indicated; two-way ANOVA adjusted for Tukey’s multiple comparisons). c, Glycogen chain length analysis in the lungs of WT and LKO (Laforin knockout) mice over 1-, 2, and 4- months (n = 4 animals/group mean +/−s.e.m. p-values indicated; two-way ANOVA adjusted for Tukey’s multiple comparisons).
Extended Data Fig. 7 |
Extended Data Fig. 7 |. Lung stem cell growth in vitro, H&E and MALDI glycogen imaging of different mouse models.
a, Schematic of isolating bronchoalveolar stem cells and differentiation to bronchiolar and alveolar organoids in matrigel. b, Representative bright field images of bronchiolar and alveolar organoids derived from WT and laforin−/− (LKO) animals. c, Number of colonies and colony size from bronchiolar and alveolar organoids derived from WT and laforin−/− (LKO) animals. Values are presented as mean +/− s.e.m. p-values were calculated using two-tailed t-test. d, Additional representative H&E images and MALDI imaging of an adjacent tissue section showing tumor formation and glycogen levels LSL-KrasG12D/p53fl/fl (KP) and LSL-KrasG12D/p53fl/fl /LKO(KPL) (n = 3 each). e, Additional representative H&E images and MALDI imaging of an adjacent tissue section showing tumor formation and glycogen levels LSL-KrasG12D/p53fl/fl (KP); LSL-KrasG12D/p53fl/fl/Gysfl/fl (KPG); LSL-KrasG12D/p53fl/fl/Gysfl/fl:Vehicle (KPG:V); LSL-KrasG12D/p53fl/fl/Gysfl/fl:Combination diet (KPG/C)animals (n = 2 each). f, Distribution of tumor grades across KP and KPL cohorts of mice (n = 3 mice; mean +/− s.e.m. p-values indicated; one-way ANOVA adjusted for Tukey’s multiple comparisons). g. Kaplan Meier survival analysis for mice in different groups. Log-rank test stated.
Extended Data Fig. 8 |
Extended Data Fig. 8 |. Comparative proteomics, phosphoproteomic, and spatial metabolomics analysis in KP and KPL tumors.
a, left: Principal component analysis (PCA) of 5993 proteins from proteomics data, showing no major changes between KP and KPL tumors. right: Volcano plot of proteomics data, with log2 fold change (log2FC) on the x-axis and −log10 p-value on the y-axis, indicating no significant differential expression between KP and KPL tumors. b, Left: Principal component analysis (PCA) of 5323 proteins from phosphoproteomic data, showing no major changes between KP and KPL tumors. Right: Volcano plot of phosphoproteomic data, with log2 fold change (log2FC) on the x-axis and −log10 p-value on the y-axis, indicating no significant differential phosphorylation between KP and KPL tumors. c, H&E-stained images of adjacent tissue slices used on MALDI analysis from KP (left) and KPL (right) tumors, image represents single analysis from three repeats. d, MALDI imaging of various metabolites in the lungs of KP and KPL GEMM tumors. Metabolites analyzed include glutamate, glycerol-3-phosphate (G3P), aspartate, glutathione (GSH), aconitate, ascorbic acid, uridine monophosphate (UMP), cyclic adenosine monophosphate (cAMP), glutamine, citric acid, adenosine monophosphate (AMP), ADP, malate, succinate, adenosine triphosphate (ATP), pyruvate, glucose/inositol, inosine, lactate, and arachidonic acid.
Extended Data Fig. 9 |
Extended Data Fig. 9 |. Multiplexed spatial metabolomics and glycogen analysis with 13C-glucose tracer enrichment.
a, Schematic of the multiplexed spatial metabolomics and glycogen workflow. Cells grown in chamber are grown in 12C- or 13C-glucose. After enrichment period, cells in chamber wells are imaged for metabolomics with NEDC, followed by antigen retrieval, isoamylase treatment, and CHCA matrix application for glycogen imaging. Created with BioRender.com. b, Layout of tracer enrichment in a chamber well format. Cells are exposed to 12C-glucose or 13C-glucose for 24, 48, and 72 hours in different wells. c, Metabolic pathway of 13C-glucose showing its incorporation into glycolysis and the TCA cycle, and 13C-glycogen formation. Key metabolic intermediates such as pyruvate (P), phosphoenolpyruvate (PEP), citrate (Cit), and oxaloacetate (OAA) are highlighted, along with enzymes pyruvate carboxylase (PC) and pyruvate dehydrogenase (PDH). d, Enrichment of various isotopologues in metabolites of glycolysis, TCA cycle, nucleotides, and glycogen. Fraction labeled graphs for m42 (glycogen), m6 (glucose and G6P), m5 (AMP), m3 (pyruvate, PEP, 3PG, lactate), and m2 (citric acid, GSH, glutamate, glutamine, malate) are shown at 0, 24, 48, and 72 hours. (n = 6697 individual pixels measured by MALDI imaging. e, Representative examples of 13C isotopologues detected through MALDI imaging, with 12C-glucose wells as controls. Metabolites visualized include citric acid, AMP, pyruvate, and glutamate.
Extended Data Fig. 10 |
Extended Data Fig. 10 |. Ion mobility and MALDI imaging of 12C and 13C-labeled glycogen species.
a, Mass spectra showing both 12C and 13C-labeled glycogen-released glucose chain lengths. b, Schematic of ion mobility drift separation for 13C-labeled species. The diagram illustrates how 12C and13C glycogen species are separated based on their drift times in the ion mobility spectrometer. Created with BioRender.com. c, 2D plot of ion mobility drift time versus m/z (mass-to-charge ratio), with a zoomed-in view highlighting the separation between 12C-GP7 and 13C-GP7 species. The plot shows similar drift times for both 12C and 13C glycogen species, indicating effective alignment. d, Overlay of mass spectra from unlabeled (12C) and 13C-glucose labeled wells (24 hours) for glycogen. The overlay highlights the differences in peak intensities, indicating the incorporation of 13C into the glycogen molecules. e, Detailed overlay of 12C and 13C-labeled glycogen species, showing the enrichment of fully labeled 13C-GP7 at m/z 42. Representative MALDI images are included to show the spatial distribution of glycogen species at 0 (12 C), 24, 48, and 72 hours of 13C labeling.
Fig. 1 |
Fig. 1 |. Intratumoural glycogen uniquely accumulates in LUAD.
a, Representative heatmap of MALDI glycogen imaging in a TMA format. b, Relative glycogen abundance correlating to glucose polymer 7 between LUAD (n = 77 patients) and LUSC (n = 68 patients) extracted from MALDI spatial glycogen analysis from the lung cancer TMA shown in a (P value indicated, two-tailed t-test). c, Glycogen chain length analysis between LUAD (n = 77) and LUSC (n = 68) showing the greatest difference between chain lengths 6 and 9 (mean ± s.e.m., P value indicated, two-way ANOVA and Šidák’s multiple-comparison test). d, Representative spatial glycogen analysis in normal lung, LUSC and LUAD tumours. Corresponding haematoxylin and eosin (H&E) images of each tumour are shown above the MALDI heatmap image of glycogen. T, tumour; S, stromal; V, vascular. e, Relative glycogen abundance between normal, LUAD and LUSC subregions such as tumour, stroma and endothelial lining extracted from MALDI spatial glycogen analysis in d (mean ± s.e.m., P value indicated, two-way ANOVA). n = 3 (average of 3 regions of interest of 500 pixels within each region). f, Representative spatial glycogen analysis in LUAD tumours with different driver mutations. LUSC and normal lung are used for control. Corresponding H&E images of each tumour are shown above the MALDI heatmap image of glycogen chain length 6 (CL6) in human patient biopsies. Loss-of-function mutations: KRAS-only (K), KRAS/p53 (KP), KRAS/LKB1 (KL), KRAS/LKB1/p53 (KPL), KRAS/KEAP/LKB1 (KKL) and EGFR-only (E). g, Relative glycogen abundance from human patient LUAD tumours with different driver mutations shown in f. LUSC and normal lung are used for control (n = 3 individual patients; mean ± s.e.m., P values indicated, one-way ANOVA adjusted for Dunnett’s multiple comparison). n.s., not significant.
Fig. 2 |
Fig. 2 |. Higher glycogen drives accelerated tumourigenesis.
a, Schematics of LSL-KrasG12D/p53fl/fl mice undergoing daily oral gavage of vehicle or HFCS + corn oil (combination) for 2 weeks followed by Adeno-Cre introduction for tumour initiation and tumourigenesis for 14 weeks (without gavage). b, Average tumour size and tumour volume in vehicle or HFCS + corn oil (combination) treated mice at the experimental endpoint (n = 6 animals per group; mean ± s.e.m., P values indicated, two-tailed t-test). c, Spatial glycogen analysis of lung extracted from mice gavaged with either vehicle or HFCS + corn oil (combination) treatment before administration of Adeno-Cre. Corresponding H&E images of each lung are shown above the MALDI heatmap image of glycogen CL6. d, Intratumoural glycogen chain length analysis between vehicle and HFCS + corn oil (combination) treatment groups showing major differences between CL5 and CL9 (n = 9 animals per group; mean ± s.e.m., P values indicated, two-way ANOVA and Šidák’s multiple-comparison test). e, The distribution of tumour grades across vehicle or HFCS + corn oil (combination) treatment groups (n = 3 animals per group from b; mean ± s.e.m., P values indicated, two-way ANOVA and Tukey’s multiple-comparison test). f, Immunohistochemical analysis of laforin, glycogen synthase (GYS) and glycogen phosphorylase (GP) from the adjacent TMA sections used in glycogen MALDI imaging (n = 66 patients for LUAD, 81 for LUSC, 12 for normal; mean ± s.e.m., P values indicated, one-way ANOVA and Tukey’s multiple-comparison test). g, Loss of laforin in LUAD corresponds to opposing increase in glycogen phosphate (phosphorylated glucose polymer 7) levels compared with LUSC measured by MALDI (n = 66 patients for LUAD, 77 for LUSC mean ± s.e.m., P value indicated, two-tailed t-test). h, Schematics of induction of tumourigenesis in LSL-KrasG12D/p53fl/fl (KP) and LSL-KrasG12D/p53fl/fl/LKO (KPL) mice followed by tumour analysis. i, Representative H&E images of tumour formation from LSL-KrasG12D/p53fl/fl (KP) and LSL-KrasG12D/p53fl/fl/LKO (KPL) mice. j, Average tumour size and tumour volume in LSL-KrasG12D/p53fl/fl (KP, n = 5) and LSL-KrasG12D/p53fl/fl/LKO (KPL, n = 6) mice at the experimental endpoint (mean ± s.e.m., P values indicated, two-tailed t-test). Panels a and h created with BioRender.com.
Fig. 3 |
Fig. 3 |. Glycogen synthesis is required for tumourigenesis.
a, Schematics of induction of tumourigenesis in LSL-KrasG12D/p53fl/fl (KP); LSL-KrasG12D/p53fl/fl/Gysfl/fl (KPG); LSL-KrasG12D/p53fl/fl/Gysfl/fl (KPG):vehicle (V); LSL-KrasG12D/p53fl/fl/Gysfl/fl (KPG):combination diet (C) mice followed by tumour analysis. b, Representative H&E images and MALDI imaging of an adjacent tissue section showing tumour formation and glycogen levels LSL-KrasG12D/p53fl/fl (KP); LSL-KrasG12D/p53fl/fl/Gysfl/fl (KPG); LSL-KrasG12D/p53fl/fl/Gysfl/fl (KPG):vehicle; LSL-KrasG12D/p53fl/fl/Gysfl/fl (KPG):combination diet animals (n = 2 each). c, Average tumour size and tumour volume in all four cohorts of mice at the experimental endpoint (n = 6 animals for KP, 6 for KPG, 4 for KPG:V and 5 for KPG:C; mean ± s.e.m., P values indicated, one-way ANOVA and Tukey’s multiple comparison). d, The distribution of tumour grades across all four cohorts of mice (n = 6 animals for KP, 6 for KPG, 4 for KPG:V and 5 for KPG:C; mean ± s.e.m., P values indicated, one-way ANOVA adjusted for Tukey’s multiple comparison). e, Intratumoural glycogen chain length analysis for all four cohorts showing major differences between CL5 and CL9 (n = 6 animals for KP, 6 for KPG, 4 for KPG:V and 5 for KPG:C; mean ± s.e.m., P values indicated, two-way ANOVA adjusted for Tukey’s multiple comparison). Panel a created with BioRender.com.
Fig. 4 |
Fig. 4 |. High glycogen supports metabolite pools in KP tumours.
a, Schematics of a multiplexed workflow to study spatial metabolomics and spatial glycogen from a single 10-μm tissue section. NEDC, N-naphthylethylenediamine dihydrochloride; α-KG, α-ketoglutaric acid; OAA, oxaloacetate. b, A representative image of multiplexed imaging of spatial metabolomics (G6P) and glycogen in LSL-KrasG12D/p53fl/fl (KP) and LSL-KrasG12D/p53fl/fl/LKO (KPL) tumours. Data shown are from a single experiment of three repeats. c, Correlative analysis of relative glycogen abundance and metabolite abundance in both LSL-KrasG12D/p53fl/fl (KP) and LSL-KrasG12D/p53fl/fl/LKO (KPL) tumours for glucose, citrate, G6P and ADP. P and R2 values were calculated using simple linear regression. d, Pixel-by-pixel analysis of metabolite pools from KrasG12D/p53fl/fl (KP) and LSL-KrasG12D/p53fl/fl/LKO (KPL) tumours for glucose, citrate, G6P and ADP (mean ± standard error, P values indicated, two-tailed t-test). e, Schematics showing how high glycogen and glycogen metabolism support tumourigenesis. Panel a created with BioRender.com.
Fig. 5 |
Fig. 5 |. Glycogen contribution to cancer metabolism traced with 13C-glucose.
a, Schematic of the experimental workflow in a chamber well format designed to track13C labelling in the metabolome and glycogen. b, Schematic of using acarbose to block glycogen utilization and assess its contribution to cancer metabolism. Left: the pulse phase involves 13C-glucose incorporation, followed by a chase phase to monitor its incorporation from glycogen into other metabolic pathways. Right: glycogen contribution to cancer metabolism can be blocked by the addition of acarbose, a pan inhibitor for glycogen utilization enzymes. c, Layout for the pulse and chase experiment using 13C-glucose to pulse and 12C-glucose with or without acarbose as the chase phase is depicted in a chamber well format. The four experimental conditions are (1) 12C-glucose negative (−) control, (2) 13C-glucose positive (+) control, (3) 12C-glucose wash out after 24 h of 13C-glucose enrichment and (4) 12C-glucose washout after 24 h of 13C-glucose enrichment with acarbose. d, Fraction-labelled metabolites with unique isotopologues in different metabolic pathways between vehicle and acarbose-treated groups. The group numbers correspond to what is shown in c (n = 6,243 unique pixels in 1, 6,387 in 2, 6,411 in 3 and 6,674 in 4; mean ± s.e.m., P values indicated, two-tailed t-test). PGUI, pan-glycogen utilization inhibitor; ND, not detected. Panels a and b created with BioRender.com.

References

    1. Imielinski M et al. Mapping the hallmarks of lung adenocarcinoma with massively parallel sequencing. Cell 150, 1107–1120 (2012). - PMC - PubMed
    1. Russell PA et al. Does lung adenocarcinoma subtype predict patient survival?: a clinicopathologic study based on the new International Association for the Study of Lung Cancer/American Thoracic Society/European Respiratory Society international multidisciplinary lung adenocarcinoma classification. J. Thorac. Oncol 6, 1496–1504 (2011). - PubMed
    1. Dragani TA et al. Lung adenocarcinoma diagnosed at a younger age is associated with advanced stage, female sex, and ever-smoker status, in patients treated with lung resection. Cancers 15, 2395 (2023). - PMC - PubMed
    1. Singh SS, Dahal A, Shrestha L & Jois SD Genotype driven therapy for non-small cell lung cancer: resistance, pan inhibitors and immunotherapy. Curr. Med. Chem 27, 5274–5316 (2020). - PubMed
    1. Zagryazhskaya A, Gyuraszova K & Zhivotovsky B Cell death in cancer therapy of lung adenocarcinoma. Int. J. Dev. Biol 59, 119–129 (2015). - PubMed

LinkOut - more resources