. 2025 Mar;57(3):680-693.
doi: 10.1038/s41588-025-02077-6. Epub 2025 Mar 11.

Alterations in PD-L1 succinylation shape anti-tumor immune responses in melanoma

Affiliations

Alterations in PD-L1 succinylation shape anti-tumor immune responses in melanoma

Long Liang et al. Nat Genet. 2025 Mar.

Abstract

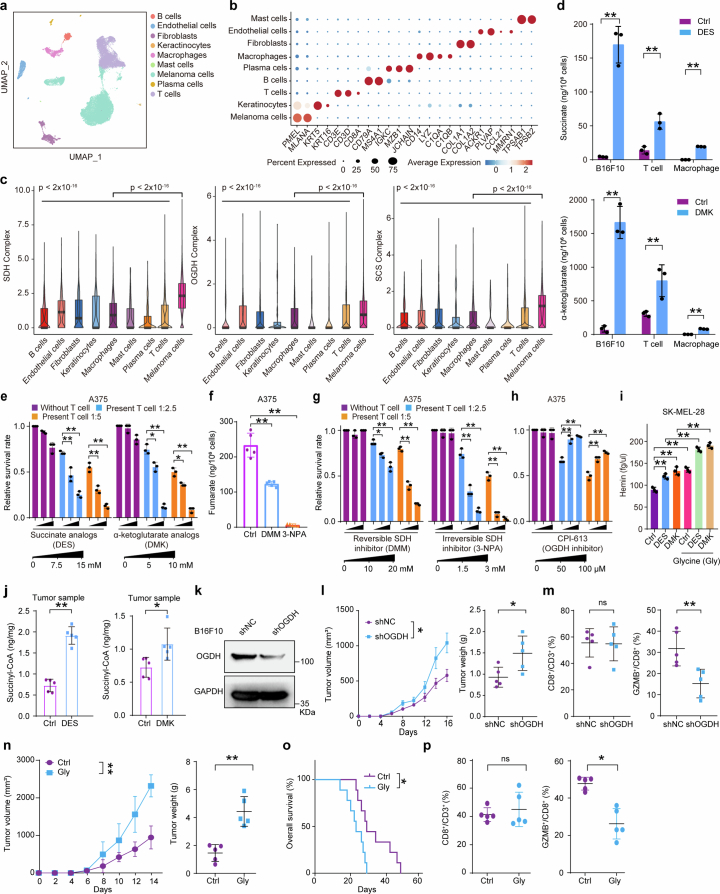
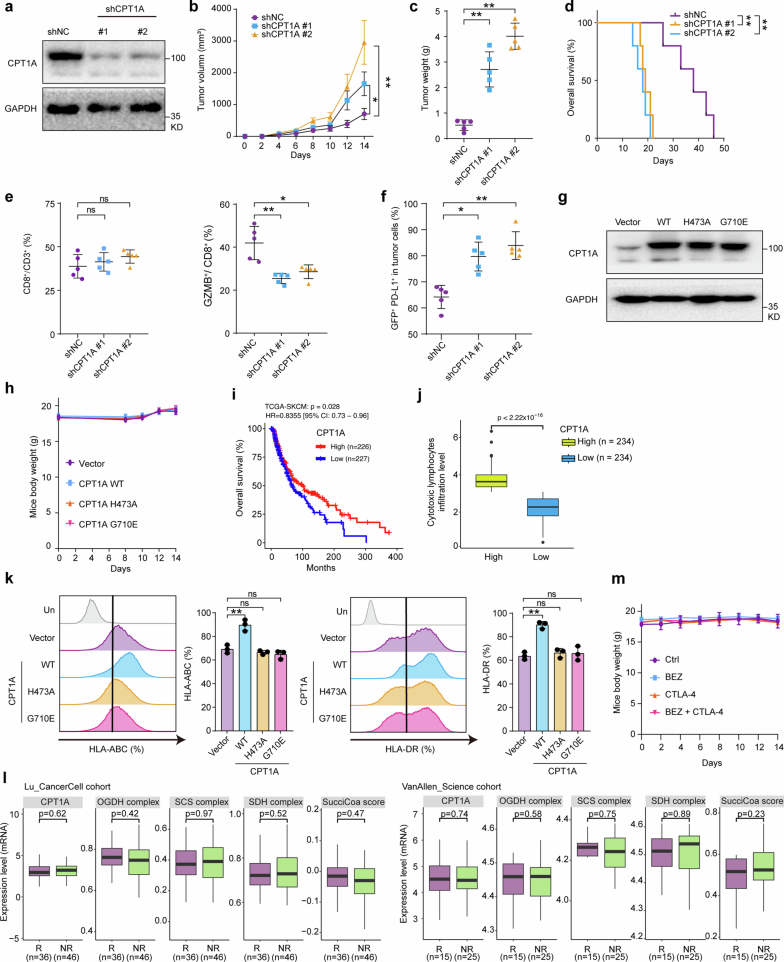
Tumors undergo metabolic reprogramming to meet the energetic, synthetic and redox demands essential for malignancy, often characterized by increased glycolysis and lactate production. However, the role of mitochondrial metabolism in tumor immunity remains unclear. The present study integrates spatial transcriptomics, bulk transcriptomics and proteomics, revealing a strong link between the metabolite succinyl-CoA and tumor immunity as well as the efficacy of anti-programmed cell death protein-1 (PD-1) therapy in patients with melanoma. Elevated succinyl-CoA levels, through α-ketoglutarate or succinate supplementation, enhanced T cell-mediated tumor elimination, both in vitro and in vivo. Mechanistically, succinylation of the ligand of PD-1 (PD-L1) at lysine 129 led to its degradation. Increased carnitine palmitoyltransferase 1A (CPT1A), identified as a succinyltransferase for PD-L1, boosted anti-tumor activity. Preclinically, bezafibrate, a hyperlipidemia drug, upregulated CPT1A and synergized with CTLA-4 monoclonal antibody to inhibit tumor growth. Clinically, higher PD-L1 and lower CPT1A levels in tumors correlated with better anti-PD-1 therapy responses, suggesting potential biomarkers for prediction of treatment efficacy.


Conflict of interest statement

Competing interests: The authors declare no competing interests.

Figures

Fig. 1
Fig. 1. Succinyl-CoA shapes anti-tumor immunity.
a, Univariate Cox’s regression analysis revealed the Kyoto Encyclopedia of Genes and Genomes (KEGG) and cancer hallmark pathways linked to survival of patients with melanoma (n = 154 patients). E2F, E2 promoter binding factor. b, Heatmaps showing Spearman’s correlation between OXPHOS or TCA cycle and CD8+ T cells based on TCGA data, with correlation strength (Rs) and significance (FDR) indicated. c, Upper, eight critical enzymes driving the TCA and OXPHOS. Middle, protein expression differences of these enzymes in clinical responders (Rs, n = 65 patients) and nonresponders (NRs, n = 69 patients). Lower, associations of these enzymes with patient survival via univariate Cox’s models. d,e, The proportion of patients with different treatment responses to immunotherapy (d) and Kaplan–Meier curves showing OS (e) among the three complexhi groups and other groups receiving PD-1 or tumor-infiltrating lymphocyte immunotherapy in the proteomics cohort (n = 154 patients). f, Tumor volume measurements after DMK or DES treatments in mice (n = 5 per group). g, Survival analysis of mice after treatment with DMK or DES (n = 7). h, Succinate and AKG levels in tumor cells from DMK- or DES-treated mice (n = 4 per group). i, Quantification of CD8+/CD3+ and GZMB+/CD8+ CTL percentages in tumor masses (n = 5 per group). j, Immunostaining of CD3, CD8,and GZMB in B16F10 tumors (n = 5 per group). Scale bar, 100 μm. k, Tumor volume measurements after CD8+ T cell depletion and treatments (n = 5 per group). l, Spatial transcriptomic heatmap of OGDH, SCS and SDH expression in tumor regions. Scale bar, 0.65 mm. m, Schematic of succinyl-CoA production pathways. n, Succinate and AKG levels in A375 cells treated with metabolite analogs (n = 5). o, A375 cells treated with glycine and metabolite analogs, co-cultured with T cells, followed by Crystal Violet staining (n = 3). p, Succinyl-CoA levels measured by LC–MS in A375 cells (n = 4). For details on visualization, statistics and reproducibility, see Methods. Note, in an, n represents biologically independent samples and, in o and p, independent experiments. Source data
Fig. 2
Fig. 2. Succinyl-CoA enhanced CTL activity by decreasing PD-L1.
a,b, Spearman’s rank correlation between the SucciCoA score and immune checkpoints in the cancer cell lines dataset from the CCLE database (a; n = 375 cell lines) or in the NSCLC protein cohort (b; n = 110 patients). c, Western blot analysis of PD-L1 and other immune checkpoints in A375 cells treated with DES or DMK (n = 3). d, PD-L1 expression in tumor cells quantified by flow cytometry in B16F10 tumor-bearing mice treated with DES or DMK (n = 5 per group). e, Tumor volume measured in mice injected with control or PD-L1 stable KO B16F10 cells, treated with DES or DMK (n = 5 per group). f, Tumor weight measured after euthanasia of mice (n = 5 per group). g, Quantification of GZMB+/CD8+ CTL cells in tumors (n = 5 per group). h, Crystal Violet staining of A375 WT and PD-L1 KO cells co-cultured with activated T cells with or without DES or DMK (n = 3). i,j, Western blot analysis of PD-L1 protein levels in A375 and SK-MEL-28 cells treated with SDH inhibitors (DMM, 3-NPA) (i) or OGDH inhibitor (CPI-613; j) (n = 3). k, Membrane PD-L1 levels after treatment with DES, DMK, DMM, 3-NPA and CPI-613 for 24 h (n = 3). l, The mRNA levels of PD-L1 in A375 cells after treatment with DES or DMK (n = 3). m, Western blot analysis of PD-L1 in A375 cells overexpressing PD-L1, treated with DES or DMK (n = 3). n, PD-L1 protein levels in A375 cells treated with DES or DMK and CHX for various times (in hours) (n = 3) o, PD-L1 overexpression cells treated with DES or DMK, followed by MG132 or pretreated with bafilomycin A1 (n = 3). p, Immunofluorescence showing PD-L1 co-localization with specific marker for recycling endosomes (Rab11), late endosomes (Rab7) and lysosomes (Lamp1) (n = 3). Scale bar, 10 or 5 μm. q, Western blot analysis of PD-L1 in endosomal fractions after treatment with DES or DMK (n = 3). For details on visualization, statistics and reproducibility, see Methods. Note, in dg, n represents biologically independent samples and, in c, h and q, independent experiments. Source data
Fig. 3
Fig. 3. Succinylation of PD-L1 Lys129 induces its degradation.
a,b, PD-L1 levels in A375 cells treated with DES or DMK, and with or without glycine analyzed by western blotting (a) and flow cytometry (b) (n = 3). c, DES or DMK treatment inducing total protein succinylation in A375 cells, detected by pan-succinylated antibodies with PD-L1 as a positive control. d, Endogenous succinylation and PD-L1 detected by western blotting in A375 cells (n = 3). e, Exogenous Flag-tagged PD-L1 (OE) immunoprecipitated and succinylation analyzed by pan-lysine-succinylation antibody (n = 3). f, Succinylation levels of PD-L1 in A375 cells assessed after DES or DMK treatment. g, Statistics of peptides identified to the PD-L1 succinylatable site and the structural pattern of PD-L1. h, Flag-tagged WT and mutant PD-L1 expressed in A375 cells, incubated with succinyl-CoA and analyzed for succinylation (n = 3). i, Western blot analysis of WCL from A375 cells expressing PD-L1 WT, Lys129Arg (K129R) or Lys129Glu (K129E) mutants, treated with DES or DMK (n = 3). j, Western blotting of A375 cells expressing PD-L1 mutants treated with CHX, with quantification of PD-L1 levels (n = 3). k, Membrane PD-L1 levels of mutants measured by flow cytometry (n = 3). l, PD-L1 mutants co-cultured with T cells. Their survival was assessed by Crystal Violet staining (n = 3). mo, Tumor growth (m), quantification of CD3+/CD8+, GZMB+/CD8+ CTL infiltration (n) and PD-L1 expression (o) evaluated in B16F10 mouse models injected with WT or mutant PD-L1 cells treated with DES or DMK (n = 5 per group). p, Immunofluorescence of PD-L1 co-localization with Rab7 and Lamp1. The co-localization was quantified. Scale bar, 10 or 5 μm. q, Western blot analysis of endosomal fractions from A375 cells transfected with PD-L1 WT or mutants (n = 3). PD-L1, Na+/K+ ATPase and Rab7 levels were detected in endosomes and whole lysates, with β-tubulin as a loading control. r, IP of PD-L1 WT and mutants with HIRP1, CHIP1, Rab11 and Rab7. s, Western blot analysis of A375 WCL expressing PD-L1 WT-UB, K129R-UB or K129E-UB mutants, treated with CHX for different times (n = 3). For details on visualization, statistics and reproducibility, see Methods. Note, in mo, n represents biologically independent samples and, in the other panels, independent experiments. Source data
Fig. 4
Fig. 4. CPT1A mediates the succinylation of PD-L1.
a, Co-localization of PD-L1 with CPT1A detected by immunofluorescence in A375 cells treated with or without DES or DMK. b, IP of CPT1A (top) and PD-L1 (bottom), with western blotting to detect both proteins. c, Western blotting of PD-L1 in CPT1A knockdown or KO A375 cells. d, Inhibition of CPT1A activity using PEM and PD-L1 detection by western blotting. e, PD-L1 protein levels after exogenous CPT1A expression. f, CPT1A knockdown or KO cells co-cultured with T cells for 24 h, followed by Crystal Violet staining (n = 3). g, A375 cells treated with PEM for 24 h, then co-cultured with or without activated T cells for 24 h to assess the killing effect (n = 3). h, CPT1A overexpression cells co-cultured with T cells to assess the killing effect (n = 3). i, Western blotting of PD-L1 after CPT1A, His473Ala (H473A) and Gly710Glu (G710E) mutant overexpression (n = 3). j, CPT1A WT and mutant cells co-cultured with T cells to assess the killing effect (n = 3). k, Western blotting analysis of the effect of CPT1A overexpression on the succinylation of PD-L1 (n = 3). l, Effect of DES or DMK treatment on PD-L1 succinylation and CPT1A expression in endosomes (n = 3). m, CPT1A overexpression cells treated with bafilomycin A1 and glycine, followed by western blotting to detect PD-L1 (n = 3). n, Exogenous expression of CPT1A with PD-L1 WT or Lys129Arg (K129R), followed by western blotting to detect PD-L1 (n = 3). o, Purified CPTA1 and mutants reacting with PD-L1 in succinyl-CoA to detect succinylation of PD-L1 (n = 3). p, Tumor growth in mice injected with B16F10 cells expressing CPT1A WT, H473A or G710E (n = 5 per group). q, Quantification of CD8+/CD3+ and GZMB+/CD8+ CTL cells in tumor masses (n = 5 per group). r, Flow cytometry quantification of PD-L1 in tumor cells (n = 5 per group). s, Immunostaining of CD3, CD8 and GZMB in B16F10 tumors (n = 5 per group). Scale bar, 100 μm. For details on visualization, statistics and reproducibility, see Methods. Note, in ps, n represents biologically independent samples and, in the other panels, independent experiments. Source data
Fig. 5
Fig. 5. Induction of CPT1A elevation synergizes with CTLA-4 blockade.
a, Western blot analysis of CPT1A and PD-L1 levels in cells treated with varying doses of BEZ (n = 3). b, Left, tumor growth of B16F10 cells in immunocompetent mice treated with control, BEZ, anti-CTLA-4 or their combination. Right, tumor weights summarized after euthanizing the mice (n = 5 per group). c, Survival of B16F10 tumor-bearing mice after treatments with control, BEZ, anti-CTLA-4 or their combination (n = 5 per group). d, Quantification of CD3+/CD45+, CD8+/CD3+ and GZMB+/CD8+ CTL percentages in tumor masses from different groups (n = 5 per group). e, Flow cytometry quantification of PD-L1 levels in tumor cells (n = 5 per group). f, Immunostaining of CD3, CD8 and GZMB in B16F10 tumor masses post-treatment (n = 5 per group). Scale bar, 100 μm. g,k, Tumor growth of CPT1A KO cells (g) or PD-L1 WT and Lys129Arg (K129R) B16F10 cells (k), along with negative control B16F10 cells, in immunocompetent mice treated with BEZ and anti-CTLA-4. Tumor weights were summarized post-euthanasia (n = 5 per group). h,l, Quantification of CD8+/CD3+ (h) and GZMB+/CD8+ CTL percentages (l) in tumor masses from various groups (n = 5 per group). i,m, Flow cytometry quantification of PD-L1 levels in tumor cells with CPT1A KO cells (i) or PD-L1 WT and Lys129Arg (K129R) B16F10 cells (m), along with negative control B16F10 cells after treatment with BEZ and CTLA-4 (n = 5 per group). j,n, Immunostaining of CD3, CD8 and GZMB in B16F10 tumor masses post-treatment with CPT1A KO cells (j) or PD-L1 WT and K129R B16F10 cells (n), along with negative control B16F10 cells after treatment with BEZ and CTLA-4 (n = 5 per group). Scale bar, 100 μm. For details on visualization, statistics and reproducibility, see Methods. Note: in a, n represents independent experiments and, in the other panels, biologically independent samples. Source data
Fig. 6
Fig. 6. CPT1A levels correlate with PD-1 mAb efficacy in melanoma.
a, Summary of the in-house melanoma cohort. b, Heatmap showing the clinical characteristics of the in-house melanoma cohort treated with anti-PD-1 mAb. Each column represents an individual patient. Rs include those with complete response (CR), partial response (PR) or stable disease (SD) > 6 months, whereas NRs include those with SD ≤ 6 months or progressive disease (PD). PFS, 0 means progression free, 1 means progression or death; OS: 0 means alive, 1 means death. c, Representative fluorescence images showing CPT1A and PD-L1 expression in patients with distinct therapy responses. d, Heatmap illustrating a significant negative correlation between CPT1A and PD-L1 expression (Spearman’s rank correlation). e, Box plots showing differential CPT1A and PD-L1 expression between R (n = 26 patients) and NR (n = 19 patients) groups. f, Univariate Cox’s regression analysis of OS (top) and PFS (bottom) based on CPT1A and PD-L1 expression (n = 45 patients). g,h, Kaplan–Meier plots demonstrating the synergistic effects of CPT1A and PD-L1 expression on PFS (g) and OS (h). i, Proportions of patients with different immunotherapy responses in the cohort (n = 45 patients). j, Schematic diagram of summary. The accumulation of succinate or oxoglutarate-derived succinyl-CoA mediates PD-L1 succinylation, serving as an indicator of the intrinsic lysosomal degradation of PD-L1. CPT1A, as a succinyltransferase that controls the succinylation of PD-L1, was identified as a new target for melanoma therapy and may be used in combination with PD-L1 as a marker to predict the effect of anti-PD-1 therapy. For details on visualization, statistics and reproducibility, see Methods. Note, n refers to independent biological replicates. HR, hazard ratio. Schematic in j created using BioRender.com. Source data
Extended Data Fig. 1
Extended Data Fig. 1. The TCA cycle and OXPHOS are related to anti-tumor immunity and changes in metabolites regulate tumor growth.
a, KEGG and hallmark gene set enrichment by GSEA for protein expression show responders enriched in OXPHOS and the TCA cycle, while non-responders are enriched in splicing and DNA replication pathways (FDR < 0.05). b, Scatter plot of Spearman’s rank correlation reveals associations between the TCA cycle/OXPHOS and total immune infiltration in melanoma proteomic data (n = 154). c, Body weight changes in tumor-bearing mice supplemented with succinate and AKG (n = 5/group). d–i, Tumor growth curves, final tumor weights, and mice body weights in B16F10-OVA (d, e), LLC (f, g), or MC38 (h, i) tumor-bearing mice treated with Ctrl, DES, or DMK (n = 5/group). j, Succinate and AKG levels in plasma (n = 5/group) and different tissues (n = 4/group) from tumor-bearing mice 1 hour after DES or DMK (1000 mg/kg) injections, measured via mass spectrometry. k–m Quantification of CD8⁺/CD3+ and GZMB⁺/CD8⁺ T-cell percentages in B16F10-OVA (k), LLC (l), or MC38 (m) tumor-bearing mice under these treatments (n = 5/group). For details on visualization, statistics and reproducibility, see Methods. Note: n refers to independent biological replicates in all experiments. Source data
Extended Data Fig. 2
Extended Data Fig. 2. Anti-tumor effects of succinate and ketoglutarate analogs rely on CD8⁺ T cells, while inhibiting succinyl-CoA production promotes tumor growth.
a, Percentages of Treg (CD25⁺Foxp3⁺/CD4⁺), MDSC (GR-1⁺CD11b⁺/CD45⁺), M1 (F4/80⁺MHCII⁺/CD45⁺), and M2 (F4/80⁺CD206⁺/CD45⁺) cells in tumor masses treated with Ctrl, DES, or DMK (n = 5/group). b, M1 and M2 macrophage percentages in spleens and lymph nodes under these treatments (n = 5/group). c, Flow cytometry analysis of F4/80⁺CD11b⁺ macrophages in tumors, spleens, and lymph nodes following clodronate liposome treatment (n = 5/group). d, Tumor growth curves and final weights in mice treated with PBS or clodronate liposomes, combined with Ctrl, DES, or DMK (n = 5 /group). e, f Tumor growth, tumor weight (e) and overall survival (f) in B16F10-GFP tumor-bearing mice treated with dimethyl malonate (DMM) (n = 5/group). g, Quantification of CD8⁺/CD3+ and GZMB⁺/CD8⁺ T-cell percentages in tumors of mice treated with Ctrl or DMM (n = 5 mice/group). h, i Tumor weights (h), Quantification of CD3⁺/CD45⁺, and CD8⁺/CD3⁺ cell (i) percentages in tumors of mice treated with anti-CD8a mAb in combination with Ctrl, DES, or DMK (n = 5 mice/group). j, Viability of SK-MEL-28 (n = 6) and A375 melanoma cells (n = 4) treated with various DES or DMK concentrations for 24 or 48 hours, measured by CCK-8 assay (OD at 450 nm). For details on visualization, statistics and reproducibility, see Methods. Note: n refers to independent biological replicates in all experiments. Source data
Extended Data Fig. 3
Extended Data Fig. 3. Alteration of succinyl-CoA levels in tumor cells impacts tumor growth in vivo.
a, UMAP plots highlight major cell types in melanoma tissues (GSE189889). b, DotPlot displays marker genes for cell subtypes in single-cell transcriptomics. c, VlnPlot reveals differences between melanoma and other cell types (n = 36208 cells from 9 patients, include 19392 melanoma cells, 9554 T cells, 425 plasma cells, 89 mast cells, 1562 macrophages, 214 keratinocytes, 2230 fibroblasts, 1701 endothelial cells, 1041 B cells). d, Succinate and AKG levels in tumor and immune cells co-cultured with DES or DMK (n = 5/group). e, A375 cells treated with DES or DMK metabolite analogs, co-cultured with T cells, and stained with crystal violet to measure survival (n = 3). f, Fumarate levels in A375 cells after DMM and 3-NPA treatments were measured by LC-MS (n = 5/group). g, h, A375 cells treated with SDH inhibitor(DMM or 3-NPA) (g) or OGDH inhibitor (CPI-613) (h), co-cultured with T cells, and stained with crystal violet to measure survival (n = 3). i, SK-MEL-28 cells treated with DES, DMK, and glycine were analyzed for hemin content (n = 3/group). j, Succinyl-CoA levels in isolated tumor cells from B16F10 mice treated with DES or DMK (n = 5/group). k, l, The shNC or B16F10 cells with stable knockdown of OGDH were injected into mice on day 0. Western blotting confirmed the knockdown of OGDH (k). Tumor volume was measured at the indicated time points. Summary of weight data of B16F10 melanoma harvested after euthanizing the mice (n = 5/group) (l). m, Quantification of CD8⁺/CD3⁺ and GZMB+/CD8⁺ CTL percentages in tumor masses from different groups (n = 5/group). n,o, Tumor volume, weights (n) and survival (o) in B16F10 mice treated with glycine (n = 8/group). p, Quantification of CD8⁺/CD3⁺ and GZMB+/CD8⁺ CTL percentages in tumor masses across treatment groups (n = 5/group). For details on visualization, statistics and reproducibility, see Methods. Note: n refers to independent biological replicates in all experiments. Source data
Extended Data Fig. 4
Extended Data Fig. 4. Clinical Relevance of SucciCoA Score in Immunotherapy.
a, Diagram illustrating the source and pathway of accumulative succinyl-CoA levels (SucciCoA score; see Methods). b, Comparison of SucciCoA scores between responders (R) and non-responders (NR) across multiple independent immune checkpoint blockade cohorts (PRJEB23709: n = 70 patients; phs000452.v3: n = 141 patients; GSE35640: n = 56 patients; IMvigor210: n = 298 patients). c, d, Patients with higher SucciCoA scores exhibit significantly worse progression-free survival (c) and overall survival (d). For details on visualization, statistics and reproducibility, see Methods. Source data
Extended Data Fig. 5
Extended Data Fig. 5. Anti-tumor effects of succinyl-CoA by regulating PD-L1 protein levels.
a, SK-MEL-28 cells were treated with TCA cycle metabolite analogs (diethyl succinate [DES], dimethyl ketoglutarate [DMK], dimethyl fumarate [DMF], dimethyl malate [DMA], dimethyl itaconate [DMI], triethyl citrate [ETC]) for 24 hours, and PD-L1 protein levels were measured by Western blotting (n = 3). b, Tumor-bearing B16F10 mice were treated with DMM, glycine, or OGDH knockdown; PD-L1 expression in tumor cells was quantified by flow cytometry (n = 5/group). c, PD-L1 expression in H460 lung, MDA-MB-231 breast, and HCT-116 colon cancer cells after treatment with DES/DMK was assessed by Western blotting (n = 3). d, PD-L1 expression in tumor, spleen, and lymph node macrophages was quantified by flow cytometry (n = 5/group). e, f, Western blot of PD-L1 expression in ALAS1 knockdown (by shRNA)(e) or overexpression of Flag-ALAS1(f) in SK-MEL-28 cells was followed by IFN-γ induction (24 hours prior to detection; n = 3), Western blotting for PD-L and ALAS1 or Flag, and GAPDH as loading control. g, Western blot of PD-L1 expression in SK-MEL-28 cells treated with glycine transporter 1 inhibitor (Bitopertin) and IFN-γ (n = 3). h, PD-L1 expression in B16F10 tumors following CRISPR/Cas9-mediated PD-L1 knockout (n = 5/group). i, Flow cytometry quantified surface PD-L1 expression (n = 5/group). j, Mice body weight was monitored at indicated time points (n = 5/group). k, PD-L1 expression after CRISPR/Cas9-mediated knockout in A375 cells. l, mRNA levels of PD-L1 in A375 cells treated with 3-NPA, DMM, or CPI-613 (n = 3). m, Western blot analysis of PD-L1 in A375 (right) and SK-MEL-28 (left) cells treated with DES/DMK, followed by MG132 and Bafilomycin A1 to assess protein degradation pathways (n = 3). n, Western blot analysis of autophagy-related proteins (Beclin1, LC3, P62) after DES/DMK treatment (n = 3). o, Immunofluorescence showing PD-L1 co-localization with specific marker for autophage(LC3I/II), ER (GRP94), Golgi (TGN46). Scale bar: 10/5 μm, (n = 3).Note: a, c, e, f, g, l, m, o, n represent independent experiments; b, d, i, j, n represent biologically independent samples. Source data
Extended Data Fig. 6
Extended Data Fig. 6. Succinylation mainly occurred in PD-L1 K129 to control its stability.
a, Endogenous succinylated proteins were immunoprecipitated using a pan-succinylated lysine antibody, and PD-L1 protein was detected in SK-MEL-28, H460, MDA-MB-231, and HCT-116 cells by immunoblotting. b, IP/MS analysis identified the succinylation site on PD-L1, with a secondary mass spectrometry profile showing succinylation at the K129 site. c, Western blot analysis of whole-cell lysates from A375 cells stably expressing wild-type (WT) or mutant PD-L1 (K136E, K136R). Cells were treated with cycloheximide (CHX) for the indicated times (n = 3 independent experiments). PD-L1 protein levels were quantified by ImageJ. d, PD-L1 WT or mutants were transfected into SK-MEL-28 cells and treated with tunicamycin for 24 hours. PD-L1 expression was analyzed by immunoblotting (n = 3 independent experiments). e, PD-L1 WT or mutants were transfected into SK-MEL-28 cells for 24 hours, followed by 24-hour treatment with tunicamycin. Protein was harvested for PD-L1 detection (n = 3 independent experiments). f, g, Representative immunofluorescence images showing the localization of PD-L1 WT and mutants in A375 cells (n = 3 independent experiments), with markers for the Endoplasmic Reticulum (GRP94) (f) and Golgi apparatus (TGN46) (g). Scale bar, 7.5 μm. Source data
Extended Data Fig. 7
Extended Data Fig. 7. CPT1A binds PD-L1 and regulates the succinylation of PD-L1.
a, Immunoprecipitation Mass Spectrometry (IP/MS) identified proteins interacting with PD-L1-Flag. b, Secondary mass spectrometry profile of CPT1A. c, Immunoprecipitation and Western blotting detected succinylation-related enzymes, including desuccinylases SRIT7 and SRIT5, succinyl transferase CPT1A, P300, and KAT2A (n = 3). d, e, A375 cells were cotransfected with PD-L1-Flag and plasmids expressing various CPT1A domains (d). Cells were harvested for whole-cell lysate (WCL), followed by IP analysis (e). f, Isolated mitochondria were treated with proteinase K (100 ng/ml) for 30 minutes, and PD-L1 levels were analyzed by Western blotting. TOMM20 (outer mitochondrial membrane marker) and COXIV (inner mitochondrial membrane marker) were used as controls. g, Isolated mitochondria were labeled with MitoRacker Green and treated with Protease K. The mitochondrial surface PD-L1 was analyzed by flow cytometry using a PD-L1 antibody (n = 3). h, Fractionated cells (nuclear, plasma, mitochondrial, membrane, endosomal) were analyzed for PD-L1 and CPT1A expression. IP analysis assessed PD-L1 interaction with CPT1A, with controls for RCC1 (nuclear), GAPDH (cytoplasmic), TOMM20 (mitochondrial), Rab7 (endosomal) (n = 3). i, Left panel: Immunofluorescence showed Rab7-GFP overexpression, with CPT1A and TOMM20 antibodies revealing CPT1A localization in mitochondria and endosomes. Right panel: PD-L1-mCherry and Rab7-GFP co-localized with CPT1A in A375 cells (scale bar, 5/1 μm). j, A375 cells expressing CPT1A-Flag and PD-L1 (full or extracellular segment 1-238aa) were immunoprecipitated with Flag beads, and HA and Flag detection were performed. k, A375 cells treated with IFN-γ and Etomoxir for 24 hours were analyzed for PD-L1 expression (n = 3). l, A375 cells treated with or without Etomoxir and co-cultured with activated T cells were analyzed for cytotoxicity (n = 3). For details, see Methods. Note: n refers to independent experiments. Source data
Extended Data Fig. 8
Extended Data Fig. 8. Knocking down CPT1A attenuates PD-L1-mediated suppression of T-cell anti-tumor activity.
a, Western blot showing CPT1A expression in B16F10 cells transduced with shCPT1A (#1, #2) compared to control (shNC). b, shCPT1A and control cells were injected into mice on day 0, and tumor volume was measured at indicated time points (n = 5/group). c, Tumor weight data for B16F10 melanoma after euthanasia (n = 5/group). d, Survival analysis of mice bearing B16F10-derived shNC and shCPT1A#1 and #2 tumors (n = 5/group). e, f, Quantification of CD8+/CD3+ (e) and GZMB+/CD8+ cells (f) and PD-L1+ tumor cells in tumor masses from different treatment groups (n = 5/group). g, Western blot confirming CPT1A overexpression in B16F10 cells. h, Body weight measurements of mice after treatment with vector, CPT1A WT, H473A, or G710E (n = 5/group). i, Survival analysis of CPT1A expression on overall survival in the TCGA-SKCM cohort (n = 453 patients). j, Difference in cytotoxic lymphocyte infiltration levels between the CPT1A-high and CPT1A-low groups in the TCGA-SKCM cohort (n = 466 patients). k, GFP-tagged CPT1A wild-type, H473A, and G710E mutants were overexpressed in A375 cells. Flow cytometry assessed antigen presentation molecules (HLA-A/B/C, HLA-DR) on GFP-positive tumor cells (n = 3/group). l, Boxplot showing differences in CPT1A expression and succinylation profiles (OGDH, SDH, SCS complexes, SucciCoa score) between anti-CTLA-4 responders (R) and non-responders (NR) in two independent melanoma cohorts (Lu_CancerCell: n = 82 patients; VanAllen_Science: n = 40 patients). m, Body weight measurements of mice treated with control, Bazerfibate, or anti-CTLA-4 alone or in combination (n = 5/group). Note: n refers to independent biological replicates in all experiments. Source data
Extended Data Fig. 9
Extended Data Fig. 9. Correlation of protein succinylation and PD-L1 expression with immunotherapy response.
a, Representative fluorescence images showing total protein succinylation and PD-L1 expression in two patients with different treatment responses. Scale bar: 20 μm. b, Comparison of total protein succinylation levels between responders (R, n = 17 patients) and non-responders (NR, n = 6 patients). c, Kaplan–Meier plot of progression-free survival rates for patients stratified by total succinylated protein expression levels (n = 24 patients). d, e, Expression levels of PD-L1 (d) and CPT1A (e) in patient groups categorized by the mean value of total succinylated protein expression (n = 24 patients). f, Upregulation of OGDH, SCS, and SDH in the TCA cycle was associated with improved immunotherapy efficacy and prognosis. Patient samples with high levels of all three enzymes were more likely to respond to PD-1 treatment. Specifically, increased OGDH expression promoted the conversion of α-ketoglutarate to succinyl-CoA, while elevated SCS expression accelerated the conversion of succinyl-CoA to succinate. Increased SDH expression further contributed to the conversion of succinate to fumarate. Simultaneous high expression of these enzymes leads to rapid depletion of succinyl-CoA, reducing the availability of donors for succinylation and consequently decreasing protein succinylation. These findings suggest that reduced protein succinylation correlates with higher PD-L1 expression in tumors, which is linked to an improved response to PD-1 therapy. For details on visualization, statistics and reproducibility, see Methods. Note: n refers to independent biological replicates in all experiments. Source data

References

    1. Gonzalez, H., Hagerling, C. & Werb, Z. Roles of the immune system in cancer: from tumor initiation to metastatic progression. Genes Dev.32, 1267–1284 (2018). - PMC - PubMed
    1. Korman, A. J., Garrett-Thomson, S. C. & Lonberg, N. The foundations of immune checkpoint blockade and the ipilimumab approval decennial. Nat. Rev. Drug Discov.21, 509–528 (2022). - PubMed
    1. Ribas, A. & Wolchok, J. D. Cancer immunotherapy using checkpoint blockade. Science359, 1350–1355 (2018). - PMC - PubMed
    1. Morad, G., Helmink, B. A., Sharma, P. & Wargo, J. A. Hallmarks of response, resistance, and toxicity to immune checkpoint blockade. Cell184, 5309–5337 (2021). - PMC - PubMed
    1. Kumagai, S. et al. Lactic acid promotes PD-1 expression in regulatory T cells in highly glycolytic tumor microenvironments. Cancer Cell40, 201–218.e9 (2022). - PubMed