

Spatial and temporal variation of pneumonia incidence among under-five children in central gondar zone, Northwest Ethiopia, 2013- 2022
- PMID: 40069711
- PMCID: PMC11895133
- DOI: 10.1186/s12887-025-05550-7
Spatial and temporal variation of pneumonia incidence among under-five children in central gondar zone, Northwest Ethiopia, 2013- 2022
Abstract
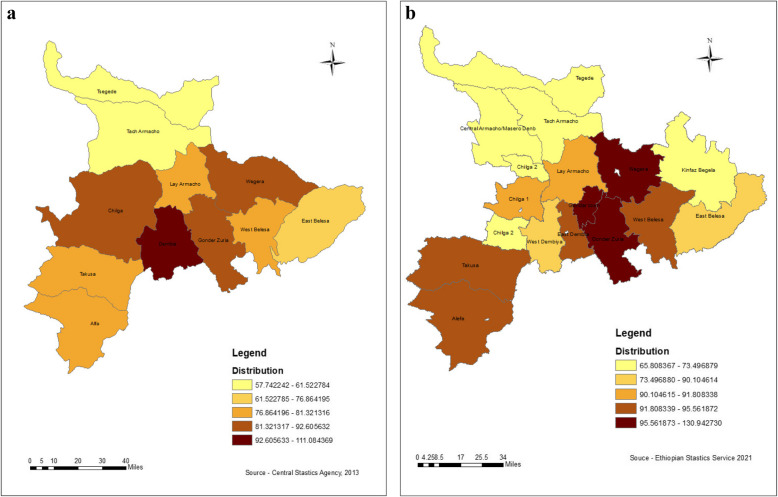
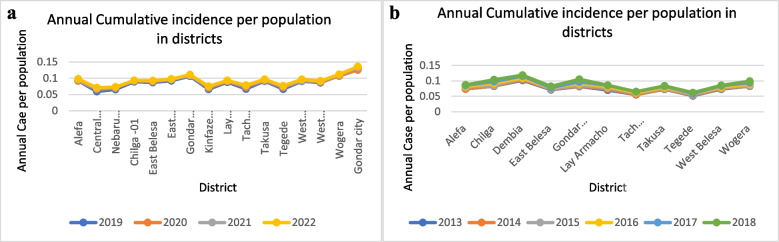
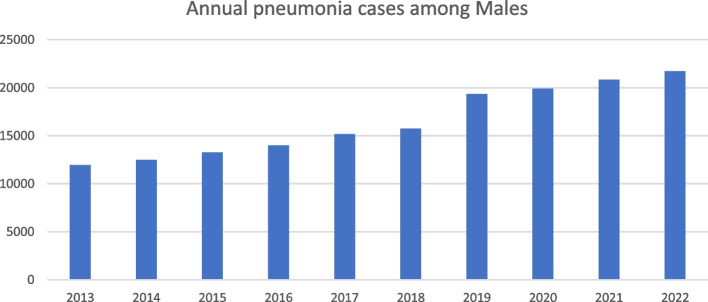
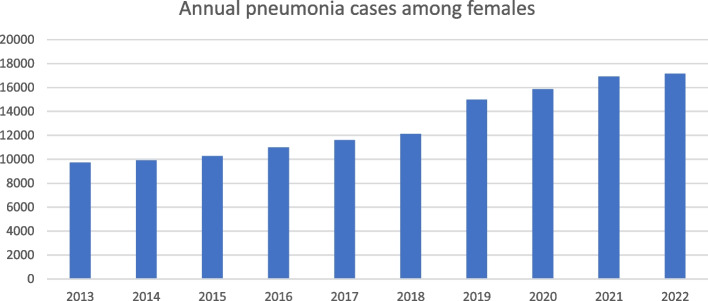
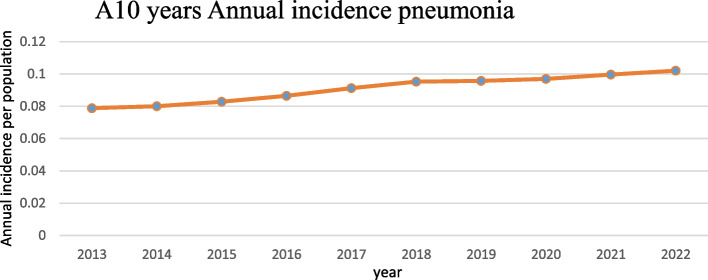
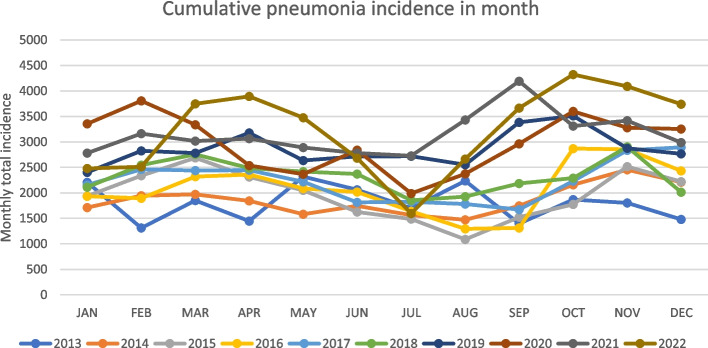
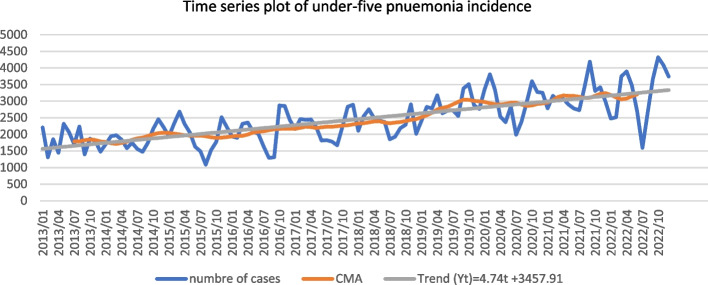
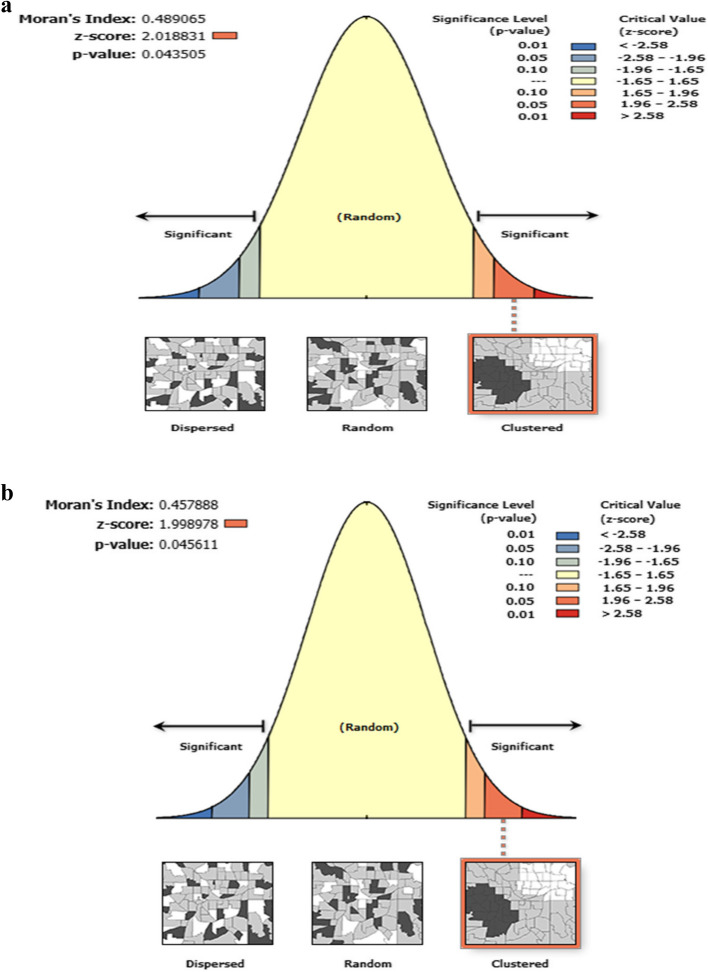
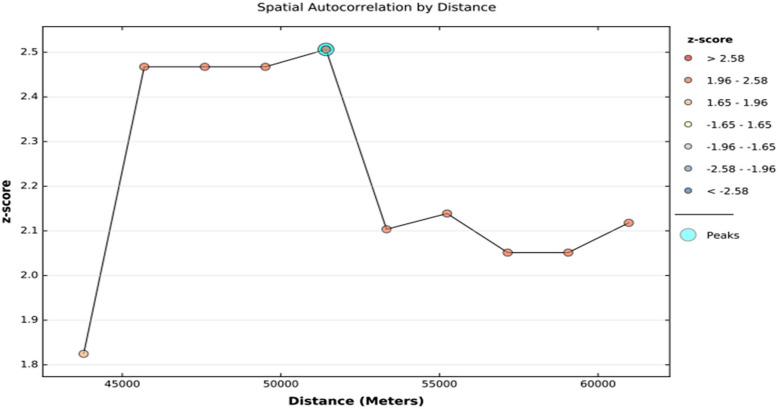
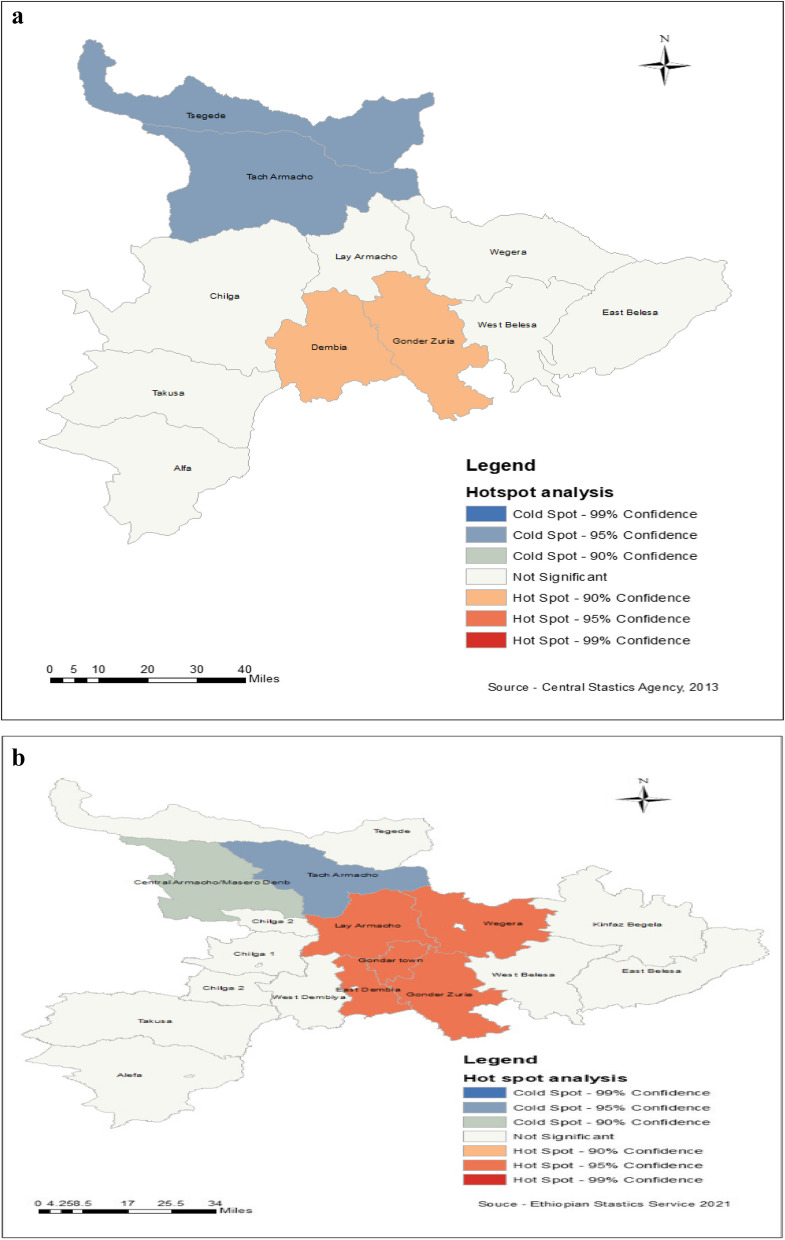
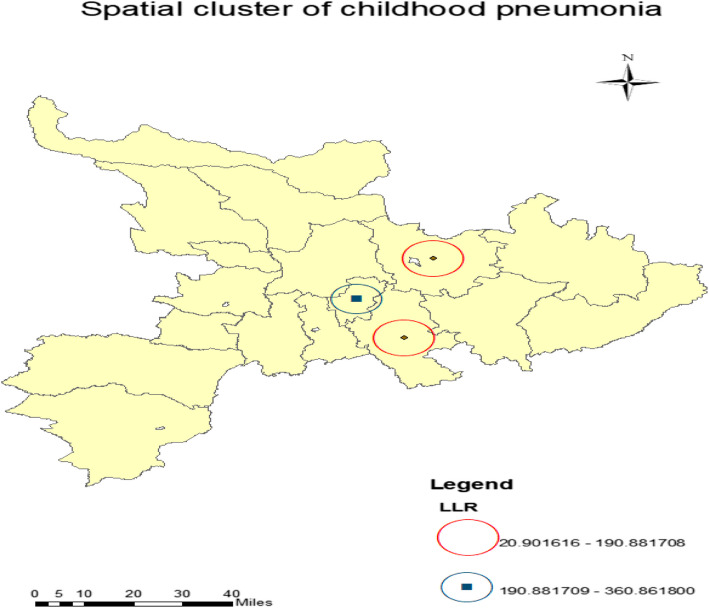
Pneumonia is one of the major causes of morbidity and mortality among under-five years old children's worldwide, with Ethiopia having the highest rates among Sub-Saharan African nations. Effective control and preventative measures will be made clear by comprehending the spatial, temporal, and spatiotemporal variation of pneumonia incidence among under-five children. A time series cross-sectional study design was conducted from 1 January 2013 to 31 December 2022 using pneumonia reports obtained from the Central Gondar Zone health department and Gondar administrative health department. Fifteen districts and one administrative city were included and geocoded in the study.Spatial, temporal, and space-time scan spatial statistics were employed to identify clusters of pneumonia incidence among under-five children and were performed by using Excel and the SaTScan program, and the map was plotted using ArcGIS. Pneumonia incidence among under-five children reveals a general trend of rise and seasonal variation in the study area. During this study period, 147,294 under-five cases of pneumonia were reported and males made up most cases accounting for 54.94%. The average cumulative incidence proportion was 9.1. Purely high-rate spatial clusters were detected in Dembiya, Chilga, Wogera, and Gondar Zuria between 2013 and 2018. Gondar City, Wogera, and Gondar Zuria were high-rate spatial clusters detected between 2019 and 2022. The purely temporal cluster was observed from 2017 to 2018 and 2021 to 2022. Spatiotemporal clusters were detected in Dembia, Chilga, Gondar Zuria, and Wogera from 2013 - 2018 and in Gondar City, Wogera, and Gondar Zuria from 2019 - 2022. During this period pneumonia showed seasonal variation with two major peak months namely in April and October. Under five children pneumonia was found to have spatial, temporal, spatiotemporal clustering, and seasonal patterns. Also, the incidence increased over time. Interventional and preventive strategies should be developed and given priority to the areas that have been detected as hot spots in this study to reduce the mortality and morbidity of under 5 children caused by pneumonia.
Keywords: Pneumonia; Spatial; Spatiotemporal; Temporal; Under-five children.
© 2025. The Author(s).
Conflict of interest statement
Declarations. Ethics approval and consent to participate: Ethical clearance was obtained from the Research and Ethical Review Committee of the Institute of Public Health, College of Medicine and Health Sciences, University of Gondar. There were no individual participants in the study because it was secondary data/count of under-5 Pneumonia which has no personal identifiers. Consent for publication: This manuscript does not contain any person’s data. Competing interests: The authors declare no competing interests.
Figures
Similar articles
-
Spatiotemporal variation of under-5 children diarrhea incidence and associated meteorological factors in central Gondar zone, Northwest Ethiopia. A retrospective time series study.BMC Infect Dis. 2025 Mar 19;25(1):380. doi: 10.1186/s12879-025-10772-2. BMC Infect Dis. 2025. PMID: 40108548 Free PMC article.
-
Detection of spatial, temporal and spatiotemporal distribution of diarrhea incidence among under-five children in Central Gondar zone, Northwest Ethiopia: a time-series study (2019-2022).BMC Pediatr. 2024 Jul 5;24(1):433. doi: 10.1186/s12887-024-04900-1. BMC Pediatr. 2024. PMID: 38969969 Free PMC article.
-
Childhood Diarrhea Exhibits Spatiotemporal Variation in Northwest Ethiopia: A SaTScan Spatial Statistical Analysis.PLoS One. 2015 Dec 21;10(12):e0144690. doi: 10.1371/journal.pone.0144690. eCollection 2015. PLoS One. 2015. PMID: 26690058 Free PMC article.
-
Spatiotemporal and hotspot detection of U5-children diarrhea in resource-limited areas of Ethiopia.Sci Rep. 2020 Jul 3;10(1):10997. doi: 10.1038/s41598-020-67623-0. Sci Rep. 2020. PMID: 32620796 Free PMC article.
-
Spatial, temporal, and spatiotemporal analysis of under-five diarrhea in Southern Ethiopia.Trop Med Health. 2018 Jun 4;46:18. doi: 10.1186/s41182-018-0101-1. eCollection 2018. Trop Med Health. 2018. PMID: 29991924 Free PMC article.
Cited by
-
Determinants and spatial patterns of solid fuel use in East Africa based on demographic and health survey data from 2012 to 2023.Sci Rep. 2025 Aug 1;15(1):28142. doi: 10.1038/s41598-025-13816-4. Sci Rep. 2025. PMID: 40750829 Free PMC article.
-
Analysis of the epidemiological characteristics of pulmonary tuberculosis in Shijiazhuang, China 2010-2023.Front Public Health. 2025 Jul 3;13:1621695. doi: 10.3389/fpubh.2025.1621695. eCollection 2025. Front Public Health. 2025. PMID: 40678650 Free PMC article.
References
-
- Swedberg E, Shah R, Sadruddin S, Soeripto J. Saving young children from forgotten killer: pneumonia. MD: American Physiological Society Bethesda; 2020. p. L861–2. - PubMed
-
- World Health Organization. Pneumonia in children. Fact sheets. 2022.
-
- World Health Organization. World health statistics overview 2019: monitoring health for the SDGs, sustainable development goals. World Health Organization; 2019.
-
- United Nations International Children's Emergency Fund. Pneumonia the deadliest childhood disease. Geneva: UNICEF; 2015.
MeSH terms
LinkOut - more resources
Full Text Sources
Medical
Miscellaneous
