. 2025 Mar 11;44(1):91.
doi: 10.1186/s13046-025-03341-7.

Single-cell transcriptomics analysis reveals that the tumor-infiltrating B cells determine the indolent fate of papillary thyroid carcinoma

Affiliations

Single-cell transcriptomics analysis reveals that the tumor-infiltrating B cells determine the indolent fate of papillary thyroid carcinoma

Chunmei Li et al. J Exp Clin Cancer Res. .

Abstract

Objective: Active surveillance (AS) offers a viable alternative to surgical intervention for the management of indolent papillary thyroid carcinoma (PTC), helping to minimize the incidence of unnecessary treatment. However, the broader adoption of AS is hindered by the need for more reliable diagnostic markers. This study aimed to identify the differences between indolent and progressive PTC and find new targets for biomarker development and therapeutic strategies.

Methods: We used single-cell RNA sequencing (scRNA-seq) to analyze cellular differences in 10 early-stage PTC tumors. Findings were validated in an additional 25 tumors using cell co-culture, migration assays, immunofluorescence staining, flow cytometry, and analysis of data from The Cancer Genome Atlas (TCGA).

Results: Tumor-infiltrating B cells (TIL-B), particularly germinal center B cells (GC-B), were more abundant in indolent PTC. These cells suppressed thyroid cell proliferation in both indolent and progressive cases, though indolent PTC had a higher capacity to recruit peripheral B cells. In indolent cases, TIL-B cells showed increased proliferation and formed clusters within tertiary lymphoid structures (TLS). PTPRC-CD22 interactions were identified as potential drivers of TIL-B cell proliferation. Markers linked to GC-B cells, such as LMO2, were highlighted as potential diagnostic and prognostic indicators for indolent PTC.

Conclusion: This study provides insights into the cellular landscape of early-stage PTC, revealing distinct tumor and immune microenvironment features in indolent and progressive cases. These findings advance the understanding of indolent PTC biology and support the development of reliable diagnostic and prognostic biomarkers.

Keywords: Germinal center B; Indolent; Papillary thyroid carcinoma; Tumor-infiltrating B.


Conflict of interest statement

Declarations. Ethics approval and consent to participate: This study was approved by the ethics committee of First Affiliated Hospital of Kunming Medical University. Informed consent was obtained from all the subjects at the time of enrollment. Clinical trial number: not applicable. Consent for publication: All authors contributed significantly to the conception, design, execution, and interpretation of the research. They reviewed and approved the manuscript and agreed to be listed as co-authors. Competing interests: The authors declare no competing interests.

Figures
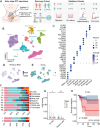
Fig. 1
Fig. 1
scRNA-seq profiling of the landscape of the early-stage PTCs. A Overview of the experimental design. B UMAP plot of the 74,714 cells from early-stage PTC primary tumor samples, 8 main cell types were identified and color-coded by cell type. C Dotplot of the marker genes expression for the identified cell types. The dot size and color represent the percentage of marker gene expression and the averaged scaled expression value, respectively. (D/E) UMAP view of all cells, (D) color-coded by number of genes detected in each cell. E color-coded by the patient group. F The distribution of cell composition for each patient sample (up) and the group (down). G Boxplot of the enrichment scores of B cells and plasma cells for different T-stages of PTCs. The PTC data from the TCGA database. Xcell was employed to analyze B cell and plasma cell enrichment. H Kaplan–Meier plot of DFS for PTC patients in the TCGA database. The DFS analysis was based on enrichment scores for all B cells (Methods). Cox proportional hazard models with a log-rank test were used for DFS analysis. PTC, Papillary Thyroid Carcinoma; TDR, Tumor Doubling Rate; DFS, Disease-Free Survival; I, Indolent; P, Progressive
Fig. 2
Fig. 2
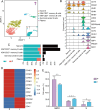
Thyrocytes heterogeneity between indolent and progressive PTCs. A UMAP plot of the total thyrocytes from early-stage PTC, color-coded by cell type. B The proportion of each thyrocyte cluster in the progressive (red) and indolent (cyan) group and the percentage of thyrocytes in total cells in each cluster (gray). CD UMAP plot of all thyrocytes from early-stage PTC, (C) color-coded by inferred CNV, (D) color-coded by the predicted differentiation state via CytoTRACE. E Boxplots of TDS scores for thyrocytes of indolent and progressive PTCs. F The pseudo-time trajectories of all thyocytes. Thyrocytes are ordered along pseudotime trajectories, with the cells color-coded by patients. G Histogram of the number of migration peripheral blood B cells recruited by the primary tumor cells of indolent and progressive groups. A two-sided unpaired Wilcoxon test was performed to compare between groups. *** indicates p-value < 0.001. CNV, Copy Number Variation, TDS, Thyroid Differentiation Score.
Fig. 3
Fig. 3
TIL-B cells suppress thyrocyte proliferation in both groups but cluster to format the TLSs in indolent PTC. A, B Histogram of the OD450 absorbance in K1 cells that co-cultured with different proportions of TIL-B cells (A) or TIL-B cells culture supernatants (B) from indolent (left) and progressive (right) PTCs. Cell growth of K1 cells was inhibited by TIL-B cells and culture supernatants from both two groups. The cell growth of K1 cells was determined by CCK8 assays. C Multiplex immunofluorescence analysis of the location of B cells and T cells in the tumor (inside the white dotted circle) and adjacent tumor tissues from indolent (I1, I2) and progressive (P) PTCs. Antibodies against CD4, CD8, CD20, and CD21 were used; CD4 and CD8 were marked for T cells, and CD20 and CD21 were marked for B cells. Cell nuclei counterstained with DAPI. TLS, characterized by B cell aggregated and surrounded by T cells, was exclusively present in the tumor region of indolent PTCs. D Histogram of the number of TLSs in the tumor areas of indolent and progressive PTCs. E Histogram of the proportion of CD20+ B cells in tumor region of indolent and progressive PTCs. A two-sided unpaired Wilcoxon test was performed to compare between groups. * indicates p-value < 0.05, ** indicates p-value < 0.01, *** indicates p-value < 0.001. TLSs, tertiary lymphoid structures. Ctr, negative control
Fig. 4
Fig. 4
Heterogeneity of TIL-B cells between indolent and progressive PTCs. A UMAP plot of the TIL-B cells from early-stage PTCs, color-coded by cell type and groups. B Violin plots of the representative marker gene expression levels across the clusters of TIL-B cells. C The proportion of each TIL-B cluster in the indolent (cyan) and progressive (red) group, and the number of TIL-B cells in total cells in each cluster (gray). D Heatmap of cell cycle-related gene expression in TIL-B cells from indolent and progressive PTCs. E Histograms of the cell cycle distribution of all B cells from the progressive group and indolent group. A two-sided unpaired Wilcoxon test was performed to compare between groups. * indicates p-value < 0.05, ** indicates p-value < 0.01, *** indicates p-value < 0.001. TIL-B cells, tumor-infiltrating B cells
Fig. 5
Fig. 5
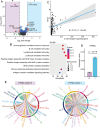
PTPRC-CD22 trans-binding in indolent and progressive PTCs. A The Volcano plot of the DEGs of TIL-B cells between indolent and progressive PTCs, red dots representing the most up-regulated genes in the two groups. B Bubble plots of GO results of up-regulated genes in TIL-B cells of the indolent PTC. C The scatter plot showed a positive correlation between CD22 expression and the B cell receptor signaling gene for PTC patients of the TCGA database. D Histograms of PTPRC expression in thyrocytes of the progressive and indolent groups. A two-sided unpaired Wilcoxon test was performed to compare between groups. E Chord diagram of the possible PTPRC-CD22 trans-binding interaction among cells in progressive (P) and indolent (I) PTCs. Interactions with B cells were colored, and others were gray. DEGs, Differentially Expressed Genes.
Fig. 6
Fig. 6
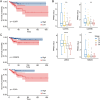
GC-B cell enrichment positively associated with improved T-stage and DFS in patients with PTC. Kaplan–Meier plot of DFS (A) for PTC patients in the TCGA database based on enrichment scores for GC-B cells using the Xcell method. Gene sets used to calculate enrichment scores were derived from our scRNA-seq analysis and applied to bulk mRNA-seq data from the TCGA database (Methods). B Boxplots of the GC-B-specific gene expression in different T-stages of PTCs. The PTC data from the TCGA database. The results showed that GC-B cells are positively associated with improved T stages for the PTC patients. A two-sided unpaired Wilcoxon test was performed to compare between groups. ** indicates p-value < 0.01, *** indicates p-value < 0.001. C Kaplan–Meier plot for DFS of PTC patients with high expression of LMO2 aged <55 and ≥55 in the TCGA database. Cox proportional hazard models with a log-rank test were used for DFS analysis

References

    1. Siegel RL, Giaquinto AN, Jemal A. Cancer statistics, 2024. CA Cancer J Clin. 2024;74(1):12–49. - PubMed
    1. Li M, Dal Maso L, Vaccarella S. Global trends in thyroid cancer incidence and the impact of overdiagnosis. Lancet Diabetes Endocrinol. 2020;8(6):468–70. - PubMed
    1. Li M, Zheng R, Dal Maso L, Zhang S, Wei W, Vaccarella S. Mapping overdiagnosis of thyroid cancer in China. Lancet Diabetes Endocrinol. 2021;9(6):330–2. - PubMed
    1. Liu W, Yan X, Cheng R. The active surveillance management approach for patients with low risk papillary thyroid microcarcinomas: is China ready? Cancer Biol Med. 2021;19(5):619–34. - PMC - PubMed
    1. Oh HS, Ha J, Kim HI, Kim TH, Kim WG, Lim DJ, Kim TY, Kim SW, Kim WB, Shong YK, Chung JH, Baek JH. Active Surveillance of Low-Risk Papillary Thyroid Microcarcinoma: A Multi-Center Cohort Study in Korea. Thyroid. 2018;28(12):1587–94. - PubMed

MeSH terms

Substances