. 2025 Mar 11;16(1):129.
doi: 10.1186/s13287-025-04164-1.

Enhanced mitochondrial function and delivery from adipose-derived stem cell spheres via the EZH2-H3K27me3-PPARγ pathway for advanced therapy

Affiliations

Enhanced mitochondrial function and delivery from adipose-derived stem cell spheres via the EZH2-H3K27me3-PPARγ pathway for advanced therapy

Ming-Min Chang et al. Stem Cell Res Ther. .

Abstract

Background: Microenvironmental alterations induce significant genetic and epigenetic changes in stem cells. Mitochondria, essential for regenerative capabilities, provide the necessary energy for stem cell function. However, the specific roles of histone modifications and mitochondrial dynamics in human adipose-derived stem cells (ASCs) during morphological transformations remain poorly understood. In this study, we aim to elucidate the mechanisms by which ASC sphere formation enhances mitochondrial function, delivery, and rescue efficiency.

Methods: ASCs were cultured on chitosan nano-deposited surfaces to form 3D spheres. Mitochondrial activity and ATP production were assessed using MitoTracker staining, Seahorse XF analysis, and ATP luminescence assays. Single-cell RNA sequencing, followed by Ingenuity Pathway Analysis (IPA), was conducted to uncover key regulatory pathways, which were validated through molecular techniques. Pathway involvement was confirmed using epigenetic inhibitors or PPARγ-modulating drugs. Mitochondrial structural integrity and delivery efficiency were evaluated after isolation.

Results: Chitosan-induced ASC spheres exhibited unique compact mitochondrial morphology, characterized by condensed cristae, enhanced mitochondrial activity, and increased ATP production through oxidative phosphorylation. High expressions of mitochondrial complex I genes and elevated levels of mitochondrial complex proteins were observed without an increase in reactive oxygen species (ROS). Epigenetic modification of H3K27me3 and PPARγ involvement were discovered and confirmed by inhibiting H3K27me3 with the specific EZH2 inhibitor GSK126 and by adding the PPARγ agonist Rosiglitazone (RSG). Isolated mitochondria from ASC spheres showed improved structural stability and delivery efficiency, suppressed the of inflammatory cytokines in LPS- and TNFα-induced inflamed cells, and rescued cells from damage, thereby enhancing function and promoting recovery.

Conclusion: Enhancing mitochondrial ATP production via the EZH2-H3K27me3-PPARγ pathway offers an alternative strategy to conventional cell-based therapies. High-functional mitochondria and delivery efficiency show significant potential for regenerative medicine applications.

Keywords: 3D spheroid culture; Adipose-derived stem cells; Chitosan nano-deposition; EZH2-H3K27me3-PPARγ pathway; Enhanced mitochondrial function; Mitochondrial therapy.


Conflict of interest statement

Declarations. Ethics approval and consent to participate: This article does not include any studies involving human participants conducted by any of the authors. Human ASCs (C12977, hMSC-AT) used in this research were purchased from PromoCell GmbH. Detailed information regarding compliance and prior ethical approval can be found on the company’s official website: PromoCell Compliance. The Hs68 cell line (BCRC No. 60038) was obtained from BCRC of FIRDI, Hsinchu, Taiwan. The Material Transfer Agreement (MTA) and product certificates are included in Supplementary Material 13. Consent for publication: Not applicable. Competing interests: The authors declare no conflict of interest.

Figures

Fig. 1
Fig. 1
The formation of 3D spheres on chitosan nano-deposited surfaces induces morphological changes in mitochondria. (A) Representative screenshot images from the 3D reconstruction rotation video of mitochondria in MitoTracker Deep Red FM-stained ASCs (24 h) and chitosan-induced ASC spheres at 24 and 72 h post-induction, with DAPI staining for nuclei. (Scale bar: 15 nm). (B) Representative confocal microscopy images of MitoTracker Deep Red FM-labeled mitochondria and rhodamine phalloidin labeled F-actin stress fiber in ASC spheres formed by seeding ASCs on a chitosan-coated surface for 72 h. (Scale bar, 20 μm) (C) Mitochondrial morphologies in 2D-cultured ASCs and 3D assembled ASC spheres were identified and categorized into fragmented, tubular, and compact patterns using AI software. (Scale bar, 20 μm). The classified mitochondria were quantified by the size of each categorized area and normalized to cell number in each field of view. Values in the bar graph represent the mean ± SEM (n = 5) and were analyzed using Student’s t test, *p < 0.05. (D) The ultrastructure of mitochondria in ASCs and 3D spheres visualized by TEM. (Scale bar 500 nm and 100 nm for original magnification 20000x and 60000x, respectively.) (E) Representative mitochondrial morphologies and fluorescent intensities in ASCs and 3D spheres derived from chitosan-coated surface (CS) or ultra-low attachment (ULA) 96-well plates. (Scale bar, 20 μm). Values in the bar graph represent the mean ± SEM (n = 3) and were analyzed using one-way ANOVA with Tukey’s multiple comparisons post-test, *p < 0.05 compared to the ASC group. p < 0.05 compared to the CS-induced sphere group
Fig. 2
Fig. 2
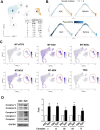
Single-cell RNA sequencing discovers a novel subpopulation in ASC spheres with heightened expressions of mitochondrial genes. (A) A 2D UMAP plot displays the mapping of 8 clusters within ASCs and spheres, highlighting the major subpopulations: Cluster 0 in ASCs and Cluster 4 in ASC spheres. The bottom-right panel lists the percentage distribution of each cluster. (B) The trajectory trees (upper panel) illustrate the distribution of Cluster 0 and Cluster 4 in ASCs and spheres. The pseudotime analysis (lower panel) shows the relationship of cell fates, where lighter blue cells indicate a more differentiated state than darker blue ones. (C) The highly increased genes identified in Cluster 4 cells are superimposed on the 2D UMAP plot to display their specific distribution and induction. (D) Representative Western blot and bar chart show the quantification of mitochondria complexes I, II, III, IV, and V levels in ASCs and 3D ASC spheres (Sph). Data were normalized to GAPDH (loading control) and represented as relative values compared to the ASC (control) group. Full-length blots are presented in Supplementary Material 12, Fig. S11. All values represent the mean ± SEM of three independent repeats (n = 3) and were analyzed by Student’s t test. *p < 0.05compared to the ASC control groupl
Fig. 3
Fig. 3
Enhanced mitochondrial ATP production was observed exclusively in chitosan-induced ASC spheres. (A) The ATP production, normalized to total protein levels, in ASCs and spheres was measured at 24, 48, and 72 h in 2D culture or 3D sphere formation (n = 4). (B) Seahorse real-time measurements of mitochondrial OCR in 2D-cultured ASCs and 3D assembled ASC spheres for 72 h (n = 3). R/A: Rotanone/Antimycin. (C) Seahorse metabolic flux analysis showing quantification of mitochondrial and glycolytic ATP productions (n = 3). (D) The ASC cells were seeded on chitosan-coated surfaces (CS) or ultra-low attachment (ULA) 96 well plates to form ASC spheres, and ATP production was measured 72 h after sphere induction (n = 4). (E) The ATP production was measured in Hs68 cells and CS/ULA-induced spheres (n = 3). All values represent the mean ± SEM and were analyzed by Student’s t test in (A) and (C), and one-way ANOVA with Tukey’s multiple comparisons post-test in (D) and (E). *p < 0.05 compared to the 2D-cultured ASC control group at each time point. p < 0.05 compared to the CS-induced ASC sphere group
Fig. 4
Fig. 4
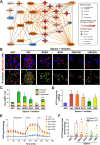
EZH2 plays a pivotal role to enhance mitochondrial functions in ASC spheres. (A) IPA prediction revealed the interactive network between histone H3 modification enzymes and top expressed genes in Cluster 4 cells from the scRNA-seq database. (B) Representative confocal images demonstrated mitochondrial morphologies, fluorescent intensities, and pattern categories in ASC spheres treated with SNDX-5613 (SNDX; 70 µM), chaetocin (SUVi; 20 nM), GSK126 (10 µM), and LMK235 (500 nM) during 72 h of sphere formation. DMSO is employed as the vehicle control (Veh). (C) Quantification of mitochondrial categories showed decreases in fluorescent area (µm²) per cell in GSK-treated spheres (n = 3). (D) The ATP production measured in ASC spheres with different epigenetic inhibitors described in (B) (n = 4). (E) Seahorse real-time measurements of mitochondrial OCR in ASC spheres with various inhibitor treatments (n = 3). (F) The ATP production rates for both mitochondria and glycolysis ATP in ASC spheres under various inhibitors (n = 3). All values represent the mean ± SEM and were analyzed by two-way ANOVA with Sidak’s multiple comparisons post-test. *p < 0.05 compared to the 2D-cultured ASC control group. ♯p < 0.05 compared to the CS-induced ASC sphere Veh group
Fig. 5
Fig. 5
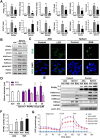
PPARγ, targeted by EZH2, is associated with mitochondrial activation in spheres. (A) The qPCR analysis of Cluster 4 and IPA predicted genes (PPARγ, PPARGC1A, PPARGC1B, SERBF1, STAT3, TFE3, TFAM, PKM, and Neat1) in ASCs, ASC spheres, and GSK-treated spheres. The sphere-induced PPARγ regulatory pathways and mitochondria-associated genes were abolished by GSK126 inhibitor (GSK) (n = 4). (B) Representative Western blotting of PPARγ, pSTA T3, STAT3, H3K4me3, H3K9me3, H3K27me3, p-HDAC4/5/7, and HDAC5 showed the sphere-induced protein expressions and confirmed decreases of PPARγ, STAT3, and H3K27me3 expressions by GSK inhibitor (n = 3). GAPDH was used as a loading control. The quantification and statistical analyses are presented in Supplementary Material 2, Fig. S4. Full-length blots are provided in Supplementary Material 12, Fig. S12. (C) Representative images of ROS levels in 2D-cultured ASCs without or with LPS induction (100 µM, positive control to trigger ROS), or ASC spheres with/without GSK inhibitor were observed using DCFDA staining. Nuclei were stained with Hoechst 33342. (Scale bar: 20 μm). (D) The sphere size increased when 10 and 20 µM of PPARγ agonist, RSG, was administered during sphere formation and was significantly reduced when the ASC spheres were treated with a PPARγ antagonist, GW9662, at 10 and 20 µM. (E) Representative expressions of PPARγ, H3K27me3, H3K9me3, H3K4me3, and HDAC5 in cytosol and nuclear fraction from 2D-cutlured ASCs and 3D ASC spheres with/without RSG treatments (n = 3). GAPDH and Lamin A/C were used as markers and loading controls for cytoplasm and nucleus, respectively. The quantification and statistical analyses are presented in Supplementary Material 2, Fig. S8. Full-length blots are presented in Supplementary Material 12, Fig. S13. (F) PPARγ activation was analyzed by a DNA-binding activity assay in 2D ASCs and 3D spheres with or without additional RSG (G) The sphere-induced mitochondrial OCR was further enhanced by treating 10 µM of PPARγ agonist RSG (Sph + RSG). Conversely, applying PPARγ antagonist GW9662 (Sph + GW) during sphere formation reduced the Seahorse real-time ATP measurements (n = 3). All values are represented as the mean ± SEM. Data in (A), (D), and (F) were analyzed by one-way ANOVA with Tukey’s multiple comparisons post-test. In (A) and (D) *p < 0.05 vs. the 2D-cultured ASC Veh group. ♯p < 0.05 vs. the CS-induced ASC sphere Veh group. In (F), *p < 0.05 vs. the 2D-cultured ASC Veh group. ap < 0.05 vs. the ASC-RSG group. bp < 0.05 vs. the CS-induced ASC sphere Veh group
Fig. 6
Fig. 6
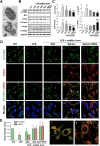
Therapeutic potential of cell-free mitochondria transfer is evidenced by the rescue of inflamed cells through the delivery of sphere-enhanced mitochondria. (A) Representative TEM images of mitochondria extracted from ASC spheres after 3 days of seeding ASCs on a chitosan-coated surface. (Magnification: 60000x. Scale bar: 100 nm). (B) Representative Western blotting of PARP, cleaved PARP (C-PARP), Caspase-3 (Casp3), cleaved Caspase-3 (C-Casp3), Caspase-9 (Casp9), and cleaved Caspase-9 (C-Casp9) showed the increases of LPS-induced inflammatory and apoptotic protein expression in RT4 cells treated with 20 µg/ml LPS (LPS group). These protein levels were reduced upon treatment with extracted mitochondria (exMito) isolated from 2D-cultured ASCs (ASC), ASC spheres (Sph), or 20 µM RSG-treated ASC spheres (Sph + RSG), which were added to the RT4 cells 3 h after LPS-induced inflammation. The quantification and statistical analyses (n = 3) are presented in Supplementary Material 2, Fig. S9A. Full-length blots are presented in Supplementary Material 12, Fig. S14. (C) The qPCR analysis of TNFα, IL-1β, IL-6, and IL-10 mRNA expression in RT4 cell Control group, LPS group, and LPS-inflamed groups treated with various exMito (n = 4). (D) The immunofluorescence images demonstrated the mitochondrial morphologies and expressions of both endogenous mitochondria (RT4-Mito, labeled with MitoTracker Green FM dye) and exMito (labeled in red with MitoTracker Deep Red FM dye) isolated from different ASC groups in the LPS-inflamed RT4 cells. Images I and II represent an enlarged view and their relative positions in the original image. (Scale bar: 20 μm). (E) Quantification of fluorescent intensities for endogenous mitochondria (green) and exMito (red) from different ASC inductions demonstrated significant increases in exMito delivery when administering exMito from ASC spheres (Sph group), with a further increase observed when exMito was sourced from the Sph + RSG group (n = 3). All values are represented as the mean ± SEM and analyzed by one-way ANOVA with Tukey’s multiple comparisons post-test. *p < 0.05 compared to the RT4 control group (Ctrl). ap<0.05 compared to the LPS-induced group (LPS). bp<0.05 compared to the LPS + exMito from ASC group. cp<0.05 compared to the LPS + exMito from Sph group
Fig. 7
Fig. 7
Schematic summary illustrating the enhancement of mitochondrial features, functions, and delivery through the formation 3D ASC spheres using chitosan-coated surfaces. Chitosan-coated surfaces induce ASCs assembly into 3D spheres with enhanced mitochondrial ATP production. Mechanismally, the EZH2-H3K4me3-PPARγ pathway regulates mtDNA associated with mitochondrial complex I in the OXPHOS system. The enhanced mitochondria from ASC spheres exhibit structural stability and higher delivery efficiency, providing an energy source and rescuing damaged endogenous mitochondria, which suggest a potential strategy for mitochondria therapy

References

    1. Aly RM. Current state of stem cell-based therapies: an overview. Stem Cells Int. 2020;7:8. - PMC - PubMed
    1. Pittenger MF, Discher DE, Peault BM, Phinney DG, Hare JM, Caplan AI. Mesenchymal stem cell perspective: cell biology to clinical progress. NPJ Regen Med. 2019;4:22. - PMC - PubMed
    1. Zuk PA. The adipose-derived stem cell: looking back and looking ahead. Mol Biol Cell. 2010;21(11):1783–7. - PMC - PubMed
    1. Goldrick C, Guri I, Herrera-Oropeza G, O’Brien-Gore C, Roy E, Wojtynska M, et al. 3D multicellular systems in disease modelling: from organoids to organ-on-chip. Front Cell Dev Biol. 2023;11:1083175. - PMC - PubMed
    1. Vogt N, Assembloids. Nat Methods. 2021;18(1):27. - PubMed

LinkOut - more resources