. 2025 Feb 25:13:1550383.
doi: 10.3389/fbioe.2025.1550383. eCollection 2025.

Effects of different fermentation temperatures on microbiomes of cigar tobacco leaves

Affiliations

Effects of different fermentation temperatures on microbiomes of cigar tobacco leaves

Yun Jia et al. Front Bioeng Biotechnol. .

Abstract

Introduction: Microbiomes of cigar tobacco leaves play a pivotal role during the fermentation, and fermentation temperature is a key factor in shaping the structure and function of the microbial community. This study aimed to investigate the effects of different temperatures (30°C, 35°C, 40°C, 45°C, and 50°C) on the microbiomes of cigar tobacco leaves, providing insights into the complex interactions among temperature, microbes, and physicochemical metabolites.

Methods: Firstly, the physicochemical metabolites of cigar tobacco leaves under various fermentation temperatures were detected by gas chromatography-mass spectrometry. Subsequently, the impacts of different temperatures on microbial biomass and community structure were revealed by quantitative real-time PCR and amplicon sequencing, and the biomarkers at different fermentation temperatures were identified by LEfSe analysis. Finally, the functional potential of microbes was predicted by correlation analysis.

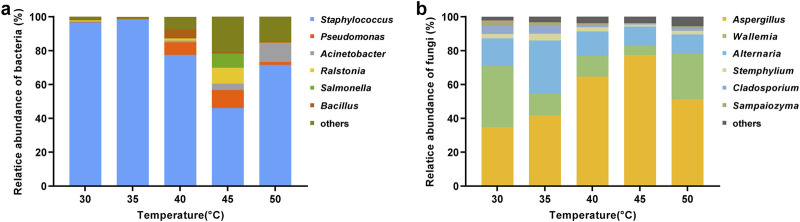
Results: The bacterial biomass increased initially and peaked at 8.4 × 10⁹ copies/g at 35°C, then decreased as the temperature rose. The fungal biomass exhibited a downward trend with increasing temperature, reaching a maximum of 3.9 × 10⁶ copies/g at 30°C. When the fermentation temperature exceeded 45°C, the growth of both bacteria and fungi was significantly restricted. Amplicon sequencing results indicated that Staphylococcus and Aspergillus genera dominated the bacterial and fungal communities, respectively. As the temperature increased, the relative abundance of Staphylococcus decreased first and then increased (46.1%-98.5%), while that of Aspergillus increased first and then decreased (34.9%-77.4%). Additionally, correlation analysis suggested that microbial communities shaped by different temperatures were responsible for the differences in physicochemical metabolites of cigar leaves. The biomarkers identified in the low-temperature fermentation group, including Staphylococcus, Stemphylium, Sampaiozyma, and Filobasidium, were likely responsible for the production of flavor metabolites, the accumulation of sugars, and the elevated ratio of potassium ions to chloride ions contents. Biomarkers in medium and high-temperature fermentation groups, such as Aspergillus, Neodymella, Acinetobacter, Pelomonas, Brevundimonas, and Alkalihalobacillus, might contribute to the degradation of nitrogen-containing substances and alkaloids.

Discussion: This study revealed the unique microbial community structure shaped at different temperatures and its potential correlation with physicochemical metabolites. These findings will help to further optimize the fermentation process of cigar tobacco leaves and develop functional microorganisms suitable for different fermentation temperatures.

Keywords: cigar tobacco leaves; fermentation temperature; microbial community structure; microbial functions; physicochemical metabolites.


Conflict of interest statement

Authors YJ, SG, WH, QZ, YW, ZZ, ZC, and DL were employed by China Tobacco Sichuan Industrial Co., Ltd.

Figures

FIGURE 1
FIGURE 1
The contents of chemical indexes in tobacco leaves fermented at different fermentation temperatures. (A) Total sugar content and reducing sugar contents; (B) total nitrogen content and alkaloids contents; (C) potassium ion and chloride ion contents; (D) the ratio of potassium ion to chloride ion content. TS: total sugar; RS: reducing sugar; TN: total nitrogen; NIC: alkaloid. Letters indicated significant differences based on Tukey’s HSD.
FIGURE 2
FIGURE 2
Flavor component content in tobacco leaves fermented at different fermentation temperatures. Letters indicated significant differences based on Tukey’s HSD.
FIGURE 3
FIGURE 3
Changes in the content of 41 flavor compounds at different fermentation temperatures. The content of each flavor compound was normalized using Z-score. The color intensity was proportional to the concentration of compounds.
FIGURE 4
FIGURE 4
Changes in bacterial and fungal biomass in cigar tobacco leaves under different fermentation temperatures. (A) Bacterial biomass; (B) fungal biomass.
FIGURE 5
FIGURE 5
Microbial diversity analysis. (A) Bacterial Shannon-Wiener index; (B) fungal Shannon-Wiener index; (C) PCoA analysis of bacterial community; (D) PCoA analysis of fungal community; (E) clustering analysis of microbial community.
FIGURE 6
FIGURE 6
Changes in microbial community structure in cigar leaves at the genus level under different fermentation temperatures. (A) Bacteria; (B) fungi. The heights of different colors represented the relative abundance of different microbial genera in the overall bacterial or fungal community.
FIGURE 7
FIGURE 7
Identification of microbial biomarkers in the low-temperature, medium-temperature, and high-temperature fermentation groups. (A) Bacteria; (B) fungi.
FIGURE 8
FIGURE 8
Succession of the Top 20 genera in bacterial and fungal communities, respectively, and their correlations with fermentation indicators. The relative abundance of each microbial genus was normalized using Z-score. The succession of microbial genera was presented on the left, with color intensity positively associated with relative abundance. The right side showed the Spearman correlation between each genus and fermentation indicators, the correlation coefficient was represented by the color and size of the circles, dark blue for positive correlation and dark red for negative correlation. TEM: temperature; TS: total sugar; RS: reducing sugar; TN: total nitrogen; NIC: alkaloid. Statistical significance was denoted by *P < 0.05; **P < 0.01; ***P < 0.001.
FIGURE 9
FIGURE 9
Correlation network of co-occurrence and co-exclusion relationships between different genera. Statistically significant (P < 0.05) Spearman’s correlation coefficient (|ρ| > 0.6) indicates the robust correlations. The size of nodes indicates the degree of connections. Green and orange nodes indicate bacteria and fungi respectively. Edge thickness represents the proportional to the value of Spearman’s correlation. Bule and red edges indicate negative and positive interaction between nodes.

References

    1. Alsafra Z., Kuuliala L., Scholl G., Saegerman C., Eppe G., De Meulenaer B. (2023). Characterizing the formation of process contaminants during coffee roasting by multivariate statistical analysis. Food Chem. 427, 136655. 10.1016/j.foodchem.2023.136655 - DOI - PubMed
    1. Arihara K., Zhou L., Ohata M. (2017). Bioactive properties of Maillard reaction products generated from food protein-derived peptides. Adv. Food Nutr. Res. 81, 161–185. 10.1016/bs.afnr.2016.11.005 - DOI - PubMed
    1. Banerjee S., Schlaeppi K., Heijden M. G. A. v. d. (2018). Keystone taxa as drivers of microbiome structure and functioning. Nat. Rev. Microbiol. 16 (9), 567–576. 10.1038/s41579-018-0024-1 - DOI - PubMed
    1. Banozic M., Aladic K., Jerkovic I., Jokic S. (2021). Volatile organic compounds of tobacco leaves versus waste (scrap, dust, and midrib): extraction and optimization. J. Sci. Food Agric. 101 (5), 1822–1832. 10.1002/jsfa.10796 - DOI - PubMed
    1. Chattopadhyay S., Malayil L., Mongodin E. F., Sapkota A. R. (2021). A roadmap from unknowns to knowns: advancing our understanding of the microbiomes of commercially available tobacco products. Appl. Microbiol. Biotechnol. 105 (7), 2633–2645. 10.1007/s00253-021-11183-4 - DOI - PMC - PubMed

LinkOut - more resources