. 2025 Feb 25:16:1530242.
doi: 10.3389/fpls.2025.1530242. eCollection 2025.

Genome-wide characterization and expression profiling of the TGA gene family in sweet orange (Citrus sinensis) reveal CsTGA7 responses to multiple phytohormones and abiotic stresses

Affiliations

Genome-wide characterization and expression profiling of the TGA gene family in sweet orange (Citrus sinensis) reveal CsTGA7 responses to multiple phytohormones and abiotic stresses

Min Wang et al. Front Plant Sci. .

Abstract

Citrus is widely recognized as one of the most economically important fruit crops worldwide. However, citrus growth is frequently hindered by external environmental stresses, which severely limit its development and yield. The TGA (TGACG motif-binding factor) transcription factors (TFs) are members of the bZIP family and play essential roles in plant defense responses and organ development. Nevertheless, the systematic identification and functional analysis of the TGA family in citrus remains unreported. In this study, genome-wide analysis identified a total of seven CsTGA TFs in Citrus sinensis, which were classified into five subgroups. Phylogenetic and syntenic analysis revealed that the CsTGA genes are highly conserved, with no tandem or segmental duplication events among family members. Promoter sequence analysis identified numerous cis-acting elements associated with transcriptional regulation, phytohormone response, and environmental adaptation in the promoters of CsTGA genes. The expression patterns under five phytohormones and three abiotic stresses demonstrated significant responses of multiple CsTGA genes under various forms of adversity. Among all tested treatments, CsTGA7 showed the most robust response to multiple stresses. Tissue-specific expression pattern analysis revealed potential functional biases among CsTGA genes. In-depth analysis showed that CsTGA7 localized in the nucleus and possessed transcriptional activation activity, consistent with the typical characteristic of transcriptional regulators. In summary, our research systematically investigated the genomic signature of the TGA family in C. sinensis and unearthed CsTGA7 with potential functions in phytohormone signaling transduction and abiotic stress responses. Our study establishes a basis for further exploration of the function of CsTGA genes under abiotic stress.

Keywords: Citrus sinensis; TGA transcription factor; abiotic stress; expression pattern; genome-wide identification.


Conflict of interest statement

The authors declare that the research was conducted in the absence of any commercial or financial relationships that could be construed as a potential conflict of interest.

Figures

Figure 1
Figure 1
Identification of TGA genes in C sinensis. (A) Phylogenetic analysis of TGA genes in sweet orange (Cs, C. sinensis), Arabidopsis (At, A. thaliana), rice (Os, O. sativa), common bean (Pv, P. vulgaris), sorghum (Sb, S. bicolor), and soybean (Gm, G. max). The phylogenetic tree was constructed using MEGA with the NJ method and 1,000 bootstrap replicates. Based on the bootstrap values and evolutionary distances, the tree was clustered into five subgroups (Groups I–V). (B) Multiple sequence alignment of the CsTGA proteins. (C) Representative predicted 3D protein structures for each of seven CsTGA proteins, performed by AlphaFold3. Yellow structure represents the bZIP domain and plum structure represents the DOG1 domain.
Figure 2
Figure 2
Conserved motif and gene structure analysis of CsTGA genes. (A) The distribution of five conserved motifs in CsTGA proteins is shown by different colored blocks. The sequences of these conserved motifs are provided in Supplementary Table S4 . (B) Exon/intron distributions of CsTGA genes. The exons and introns are represented by green boxes and black lines, respectively. Pink boxes indicate the upstream and/or downstream untranslated regions.
Figure 3
Figure 3
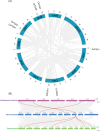
Duplication and synteny analysis of TGA genes. (A) Chromosomal location of CsTGA genes. Blue columns represent chromosomes with the chromosome numbers placed in the middle and the gene ID outside the plot. (B) Synteny relationships of TGA genes among C. sinensis, A. thaliana, and O. sativa. Horizontal columns represent chromosomes with chromosome numbers placed in the middle. Gray lines indicate the collinear blocks between genome pairs, and syntenic CsTGA genes are linked by red lines.
Figure 4
Figure 4
cis-acting element analysis in the promoters of CsTGA genes. cis-acting elements were identified in the 2.5 kb upstream promoter regions of CsTGA genes. The numbers in the heatmap represent the count of corresponding cis-acting elements. A color scale is displayed vertically at the top right of the diagram. Different colored triangles represent different cis-acting elements. Detailed information of sequence and position of these cis-acting elements is described in Supplementary Table S4 .
Figure 5
Figure 5
Expression profiles of CsTGA genes. (A) Expression profiles of CsTGA genes under multiple phytohormone treatments. Expression analysis was performed in leaves of C. sinensis at different time points (0, 3, 6 12, 24, and 48 h after treatments). (B) Expression profiles of CsTGA genes under multiple abiotic stresses. Expression analysis was performed in leaves of C. sinensis at different time points (0, 3, 6, 12, 24, and 48 h after NaCl and cold treatments; 0, 0.5, 1, 3, 6, and 12 h after dehydration treatment). The qRT-PCR results of CsTGA genes were normalized using log2 transformation. The heatmap constructed by TBtools software. A color scale is displayed horizontally at the bottom of the diagram. (C) Schematic diagram of different tissues sampled from sweet orange seedlings. (D) Tissue-specific expression patterns of CsTGA genes. The asterisk indicates the significant difference between the tested group and the leaf group based on a Tukey’s test (**p < 0.01, ***p < 0.001).
Figure 6
Figure 6
Venn diagram of CsTGA genes under phytohormone and abiotic stress treatments. (A) Overlap of CsTGA genes upregulated under phytohormone and abiotic stress treatments. Orange columns represent the number of overlapping treatments with upregulated CsTGA genes. The orange columns in the lower left corner represent the number of upregulated CsTGA genes under each treatment. Numbers in the horizontal orange blocks at the bottom indicate the number of treatments to which the individual genes responded. Black circles connected by lines represent the overlapping treatments. (B) Overlap of CsTGA genes downregulated under phytohormone and abiotic stress treatments. Viridescent columns represent the number of overlapping treatments with downregulated CsTGA genes. The viridescent columns in the lower left corner represent the number of downregulated CsTGA genes under each treatment. Numbers in the horizontal viridescent blocks at the bottom indicate the number of treatments to which the individual genes responded. Black circles connected by lines represent the overlapping treatments.
Figure 7
Figure 7
Subcellular localization and transcriptional activation activity of CsTGA7. (A) The 35S::GFP and 35S::CsTGA7-GFP constructs were transiently expressed in N. benthamiana leaves via A. tumefaciens-mediated transformation and observed under a confocal laser scanning microscope. Scale bars represent 20 µm. (B) Fluorescence intensity profiles of GFP and mCherry at the position shown by the white line in the 35S::CsTGA7-GFP localization image shown in (A). (C) Growth of yeast cells co-transformed with different vectors on selective medium. Full-length (CsTGA7-pGBKT7-FL), N-terminus (CsTGA7-pGBKT7-N), and C-terminus (CsTGA7-pGBKT7-C) fragments of CsTGA7 were introduced in pGBKT7 vector. The numbers above or beneath the bars indicate the positions of amino acid residues.

Similar articles

Cited by

References

    1. Abramson J., Adler J., Dunger J., Evans R., Green T., Pritzel A., et al. . (2024). Addendum: Accurate structure prediction of biomolecular interactions with AlphaFold 3. Nature 636, 1. doi: 10.1038/s41586-024-08416-7 - DOI - PMC - PubMed
    1. Ali J., Mukarram M., Ojo J., Dawam N., Riyazuddin R., Ghramh H. A., et al. . (2024). Harnessing phytohormones: Advancing plant growth and defence strategies for sustainable agriculture. Physiol. Plantarum. 176, e14307. doi: 10.1111/ppl.14307 - DOI - PubMed
    1. Bailey T. L., Johnson J., Grant C. E., Noble W. S. (2015). The MEME suite. Nucleic Acids Res. 43, W39–W49. doi: 10.1093/nar/gkv416 - DOI - PMC - PubMed
    1. Binenbaum J., Weinstain R., Shani E. (2018). Gibberellin localization and transport in plants. Trends Plant Sci. 23, 410–421. doi: 10.1016/j.tplants.2018.02.005 - DOI - PubMed
    1. Bürger M., Chory J. (2019). Stressed out about hormones: How plants orchestrate immunity. Cell Host Microbe 26, 163–172. doi: 10.1016/j.chom.2019.07.006 - DOI - PMC - PubMed

LinkOut - more resources