. 2025 Feb 25:16:1560383.
doi: 10.3389/fimmu.2025.1560383. eCollection 2025.

Co-expression of B7-H3 and LAG3 represents cytotoxicity of CD4+ T cells in humans

Affiliations

Co-expression of B7-H3 and LAG3 represents cytotoxicity of CD4+ T cells in humans

Yumi Tamura et al. Front Immunol. .

Abstract

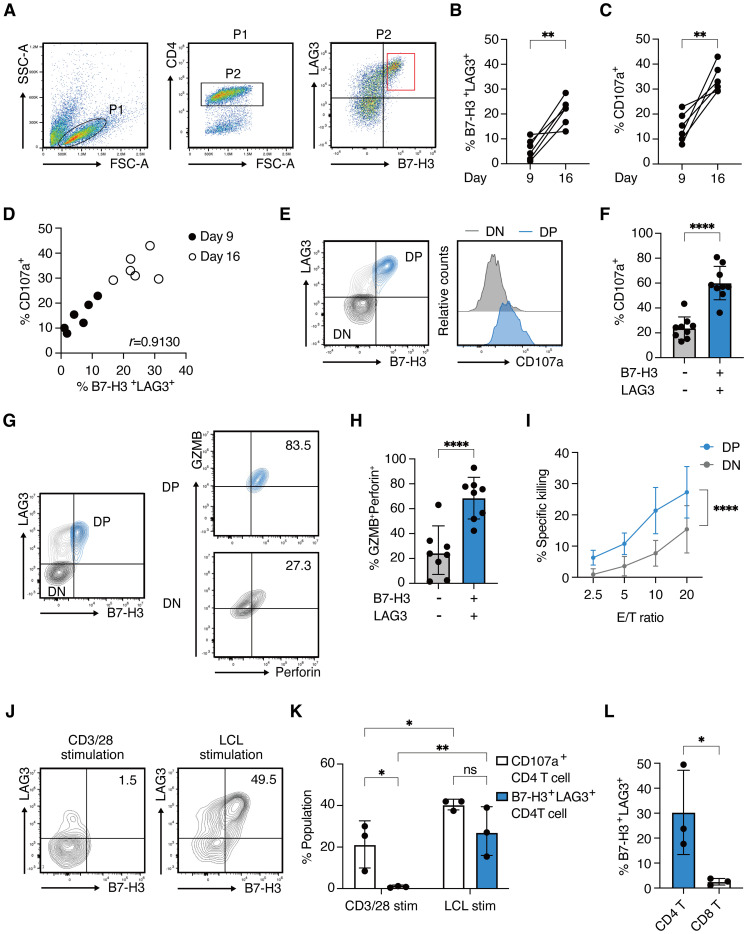
Recent studies have highlighted the potential contribution of CD4+ T cells with cytotoxic activity (CD4 CTLs) to anti-tumor immunity. However, their precise roles remain elusive, partly due to the absence of specific markers defining CD4 CTLs with target-killing potential in humans. We previously demonstrated that Epstein-Barr virus (EBV)-driven immortalized B cell lines efficiently induce human CD4 CTLs with cytotoxic functions comparable to cytotoxic CD8+ T cells (CD8 CTLs). Here we show that EBV-driven CD4 CTLs exhibit prolonged proliferation and sustained cytotoxicity compared with CD8 CTLs, although their cytotoxic function markedly decreased during long-term culture. Comparative transcriptomic analysis of CD4 CTLs with varying cytotoxic activities identified B7-H3 and LAG3 as surface molecules associated with highly cytotoxic CD4 CTLs. Co-expression of B7-H3 and LAG3 correlated with CD107a expression and was observed on CD4+ T cells with enhanced cytotoxic potential in a target-dependent manner but not on CD8 CTLs. Furthermore, B7-H3+LAG3+ CD4+ T cells were induced during co-culture with bone marrow cells from pediatric patients with B-cell acute lymphoblastic leukemia (B-ALL). These findings suggest that B7-H3 and LAG3 co-expression represents a characteristic feature of functional CD4 CTLs in humans, providing valuable insights into the role of CD4 CTLs in tumor immunity.

Keywords: B7-H3; CD4+ cytotoxic T cells; EB virus; LAG3; leukemia; lymphoma; tumor immunity.


Conflict of interest statement

The authors declare that the research was conducted in the absence of any commercial or financial relationships that could be construed as a potential conflict of interest. The author(s) declared that they were an editorial board member of Frontiers, at the time of submission. This had no impact on the peer review process and the final decision.

Figures

Figure 1
Figure 1
CD4 CTLs proliferate longer than CD8 CTLs but lose their activity upon repeated stimulation (A) Schematic representation: CD4+ and CD8+ T cells were two-way-sorted from the peripheral blood T cells from healthy donors and independently stimulated weekly with irradiated autologous LCLs generated from the same donor. IL-7 and IL-2 were added to the culture medium from day 0 and day 4, respectively. (B) Representative flow cytometry plots for the expression of Granzyme B (GZMB) and Perforin on day 0 (upper panels) and day 16 (lower panels) of stimulation with autologous LCLs in the CD45RO+CD4+ compartment (left panels) and CD45RO+CD8+ compartment (right panels). Percentage in the gate is shown. (C) Percentage of cytotoxic T cell population defined by the co-expression of GZMB and Perforin at day 16-30 of CD4+ and CD8+ T cells (n=3). (D) Percentage of specific killing activity at day 16-30 of CD4+ and CD8+ T cells (n=4) against autologous LCLs. Results of the 10:1 effector to target (E/T) ratio are shown. (E) Accumulated cell number of CD4+ (filled circles) and CD8+ (open circles) T cells from 6 independent experiments involving 4 healthy donors (n=6). (F) Proliferative duration of CD4+ and CD8+ T cells (n=6). (G) Representative cytotoxic activity of CD4+ T cells on day 30 (4CTL-ST) and day 68 (4CTL-LT) at the indicated E/T ratio. (H) Cumulative analysis of killing activity for CD4+ T cells from days 16-30 (4CTL-ST) and days 56-105 (4CTL-LT) from 6 independent experiments involving 4 donors (n=6). Results of the 10:1 effector to target (E/T) ratio are shown. Data are mean ± SD with statistical significance determined by unpaired t-test (C, D, F, H) and paired t-test (I–K). The p-values are represented as *p < 0.05; **p < 0.01; ***p < 0.001; ****p < 0.0001.
Figure 2
Figure 2
Transcriptome analysis identifies B7-H3/CD276 and LAG3 discriminating functional CD4 CTLs (A) PCA plots of unstimulated CD4+ T cells, 4CTL-ST (at days of 23-30), and 4CTL-LT (at days of 58-105) from three healthy donors. The top 10,000 genes with the highest variance were used to plot the PCA. (B, C) Heatmap of gene expression related to helper CD4+ T cell subsets (B) and cytotoxicity of lymphocytes (C) in indicated CD4+ T cell fractions. Color code values indicate relative expression levels shown as TPM. (D) Venn diagrams of DEGs upregulated in 4CTL-ST to unstimulated CD4+ T cells, and DEGs downregulated in 4CTL-LT to 4CTL-ST. The numbers of genes are indicated in each compartment. (E) The distribution of expression levels (measured as TPM) of all RNA-sequenced genes (in gray) and genes encoding the surface membrane proteins (in red) in the indicated samples. Log10 TPM values greater than 0 in 4CTL-ST are enclosed. (F) Fold change in gene expression of the indicated molecules, normalized to β2 microglobulin, in 4CTL-ST as measured by quantitative real-time PCR (n=3). Bars show relative gene expression compared to CD4+ T cells stimulated with CD3/CD28 for 4 days.
Figure 3
Figure 3
B7-H3 and LAG3 co-expression correlates with functional CD4 CTLs (A) Representative FACS plots for B7-H3 and LAG3 expression on CD4+ T cells on day 9 after stimulation with autologous LCLs. (B, C) Percentages of B7-H3 +LAG3+ CD4+ T cells (B) and CD107a+ CD4+ T cells (C) on day 9 and day 16. Each line represents independent experiments from 5 healthy donors. (D) Correlation plot showing the percentages of CD107a+ CD4+ T cells and B7-H3+LAG3+ CD4+ T cells on day 9 and day 16. (E) Representative contour plot showing B7-H3 and LAG3 expression on CD4+ T cells (left panel) and histograms depicting CD107a expression in B7-H3/+LAG3+ (blue) and B7-H3- LAG3- (light gray) compartment (right panel) on day 16. (F) Percentage of CD107a+ population in the indicated compartments from 8 independent experiments from 5 healthy donors (n=8). (G) Representative contour plots of GZMB and Perforin expression in the B7-H3+LAG3+ (right upper panel) and B7-H3-LAG3- (right lower panel) compartments gated on CD4+ T cells (left panel). (H) Percentage of GZMB+Perforin+ population (from Figure 3G ) in the indicated compartments (n=8 from 5 healthy donors). (I) % specific killing on day 26-30 at the indicated E/T ratio of sorted B7-H3+LAG3+ CD4+ T cells (blue) and B7-H3-LAG3-CD4+ T cells (light gray).(4 independent assays from 3 donors.) (J) Representative contour plots of B7-H3 and LAG3 on CD4+ T cells 48 hours after stimulation with CD3/28 antibodies (left panel) or re-stimulation with autologous LCLs (right panel). (K) Percentages of CD107a+ population (open bars) and B7-H3+LAG3+ population (blue filled bars) are determined in indicated T cells from Figure 3J (n=3). (L) Percentages of B7-H3+LAG3+ population in indicated T cell fractions at 48 hours after re-stimulation with autologous LCLs (n=3). Data are mean ± SD with statistical significance determined by paired t-test (B, C), unpaired t-test (F, H, L), two-way ANOVA (I), or one-way ANOVA (K). The p-values are represented as *p < 0.05; **p < 0.01; ***p < 0.001; ****p < 0.0001. Pearson’s correlation analysis was used to calculate correlation coefficients (D).
Figure 4
Figure 4
B7-H3+LAG3+ CD4+ T cells with enhanced cytotoxic capacity expand ex vivo from the bone marrow of pediatric B-ALL patients (A–G) Bone marrow mononuclear cells from 12 patients were cultured ex vivo with IL-2 and IL-7. Cells were analyzed by flow cytometry on day 1 and 14. Each line or dot represents an individual patient. (A) Percentages of CD107a-expressing cells in CD4+ T cells on day 1 and day 14 (B) Percentages of B7-H3+LAG3+ cells in CD4+ T cells on day 1 and day 14. (C) Correlation plot showing the percentages of CD107a+ CD4+ T cells and B7-H3+LAG3+ CD4+ T cells on day 1 and day 14. (D) Percentage of CD107a+ population in CD4+ and CD8+ T cells on day 14 (n=12) (E) Percentage of B7-H3+LAG3+ population in CD4+ and CD8+ T cells on day 14 (n=12) (F) Representative histograms for CD107a expression in B7-H3+LAG3+ (blue) and B7-H3-LAG3- (light gray) compartments on day 14. (G) Percentage of CD107a+ population in the indicated compartments. Samples with B7-H3+LAG3+ population at day 14 (from panel B) were analyzed (n=8). (H) Representative contour plots of GZMB and Perforin expression in the B7-H3/CD276+LAG3+ (right upper panel) and B7-H3/CD276-LAG3- (right lower panel) compartments gated on CD4+ T cells (left panel). (I) Percentage of GZMB+Perforin+population (from panel H) in the indicated compartments. Samples with B7-H3+LAG3+ population at day 14 (from panel B) were analyzed (n=8). Data are mean ± SD with statistical significance determined by paired t-tests (A, B) and unpaired t-tests (D, E, G, I). The p-values are represented as *p < 0.05; **p < 0.01; ***p < 0.001; ****p < 0.0001. Pearson’s correlation analysis was used to calculate correlation coefficients (C).

References

    1. O’Shea JJ, Paul WE. Mechanisms underlying lineage commitment and plasticity of helper CD4+ T cells. Science. (2010) 327:1098–102. - PMC - PubMed
    1. Preglej T, Ellmeier W. CD4(+) cytotoxic T cells - phenotype, function and transcriptional networks controlling their differentiation pathways. Immunol Lett. (2022) 247:27–42. doi: 10.1016/j.imlet.2022.05.001 - DOI - PubMed
    1. Norris PJ, Moffett HF, Yang OO, Kaufmann DE, Clark MJ, Addo MM, et al. . Beyond help: direct effector functions of human immunodeficiency virus type 1-specific CD4(+) T cells. J Virol. (2004) 78:8844–51. doi: 10.1128/JVI.78.16.8844-8851.2004 - DOI - PMC - PubMed
    1. van Leeuwen EM, Remmerswaal EB, Vossen MT, Rowshani AT, Wertheim-van-Dillen PM, van Lier RA, et al. . Emergence of a CD4+CD28- granzyme B+, cytomegalovirus-specific T cell subset after recovery of primary cytomegalovirus infection. J Immunol. (2004) 173:1834–41. doi: 10.4049/jimmunol.173.3.1834 - DOI - PubMed
    1. Appay V, Zaunders JJ, Papagno L, Sutton J, Jaramillo A, Waters A, et al. . Characterization of CD4(+) CTLs ex vivo. J Immunol. (2002) 168:5954–8. doi: 10.4049/jimmunol.168.11.5954 - DOI - PubMed

MeSH terms

LinkOut - more resources