. 2025 Feb 11;28(3):111994.
doi: 10.1016/j.isci.2025.111994. eCollection 2025 Mar 21.

IQGAP2 regulates blood-brain barrier immune dynamics

Affiliations

IQGAP2 regulates blood-brain barrier immune dynamics

Ketaki A Katdare et al. iScience. .

Abstract

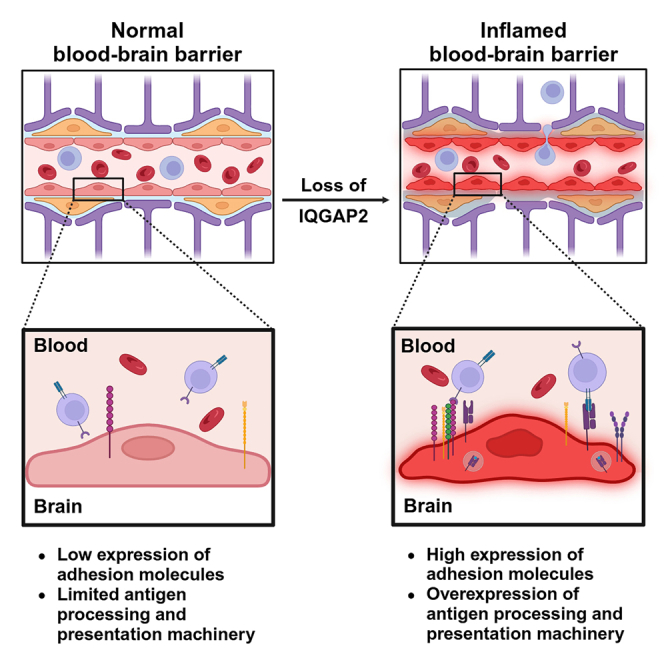
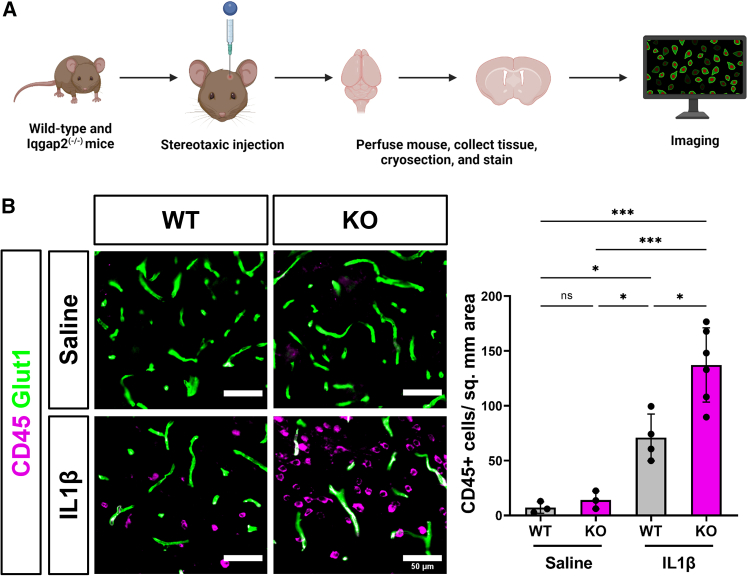
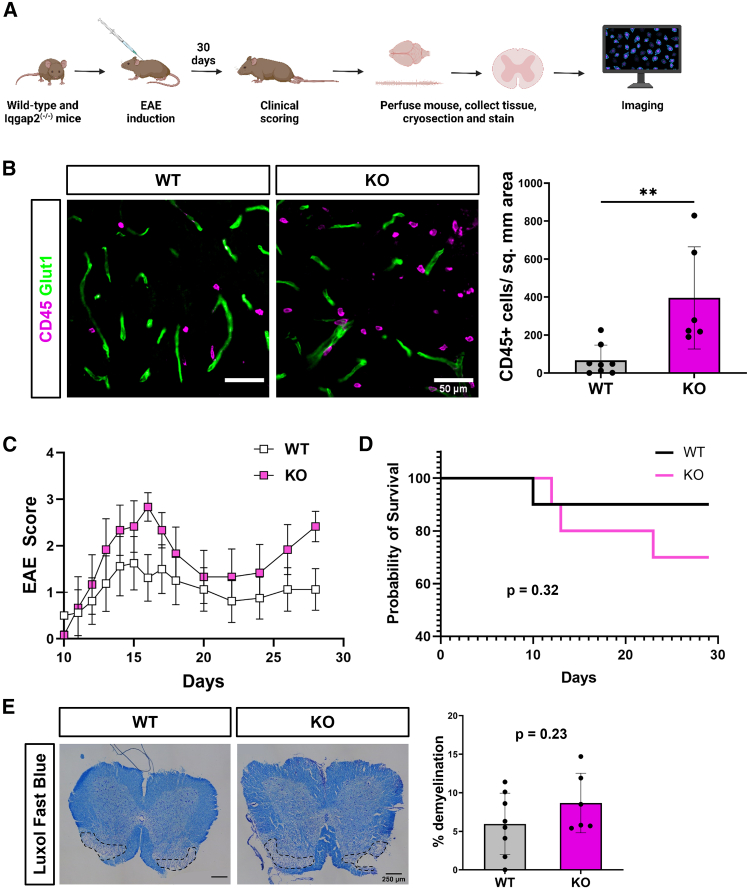
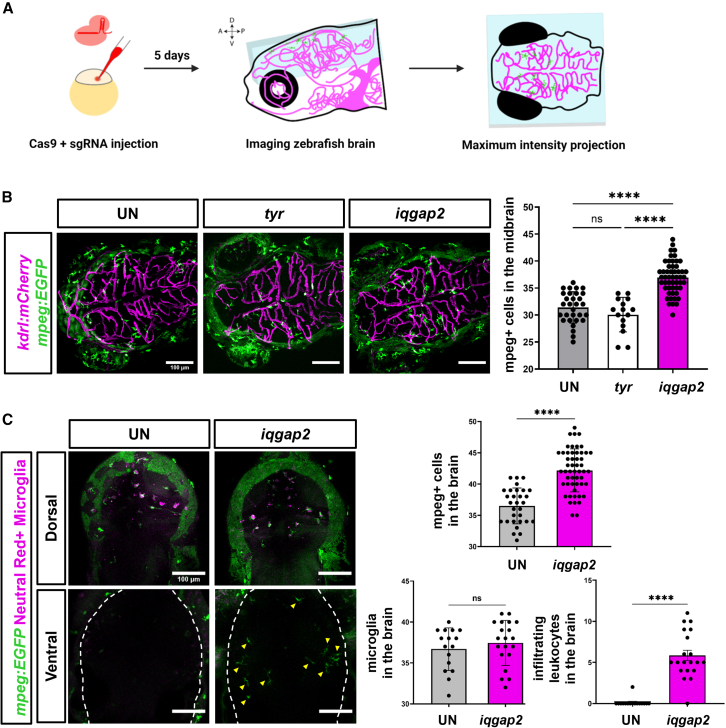
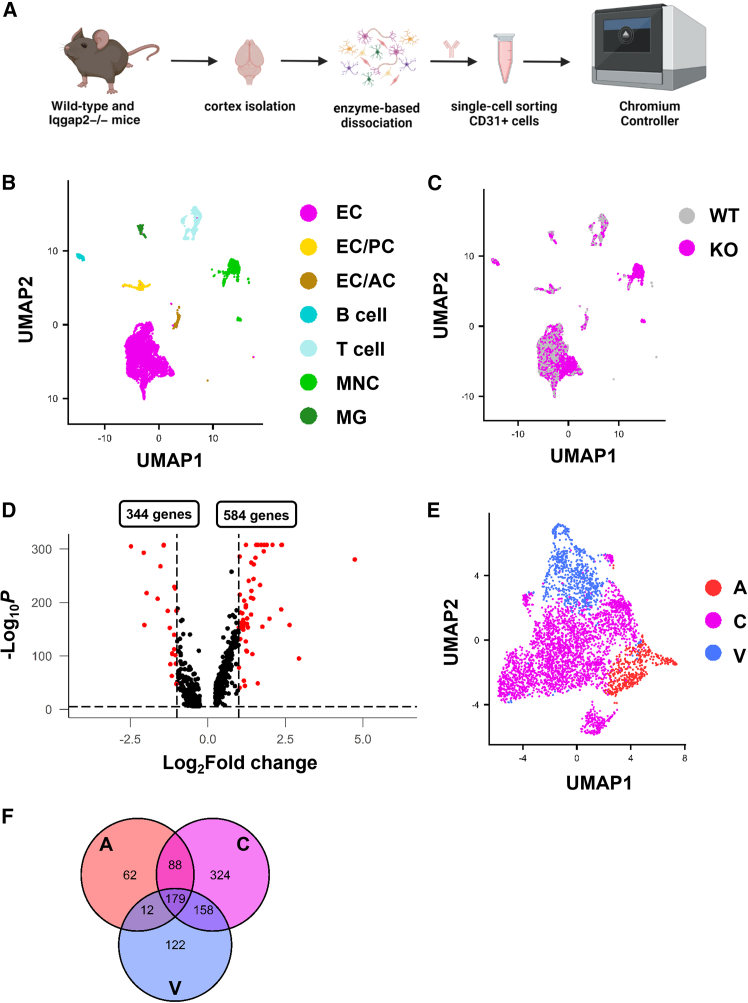
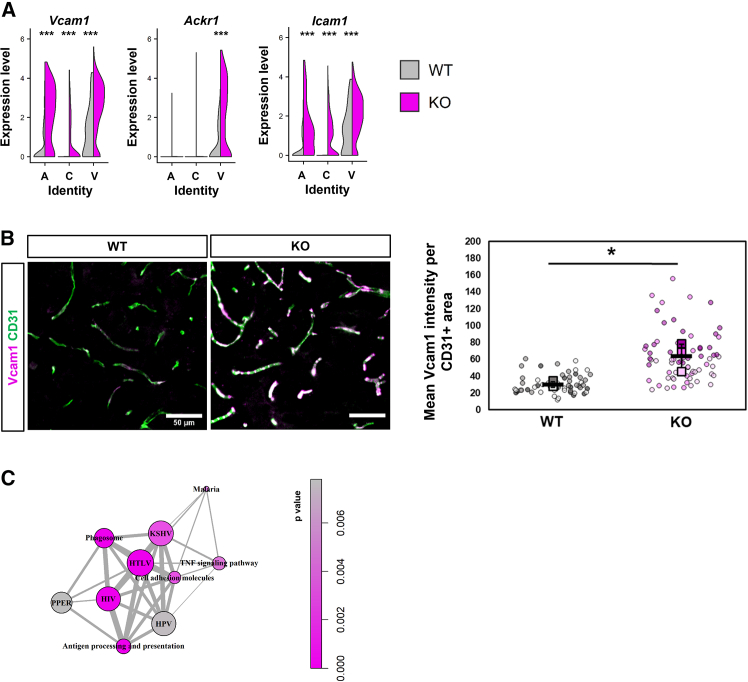
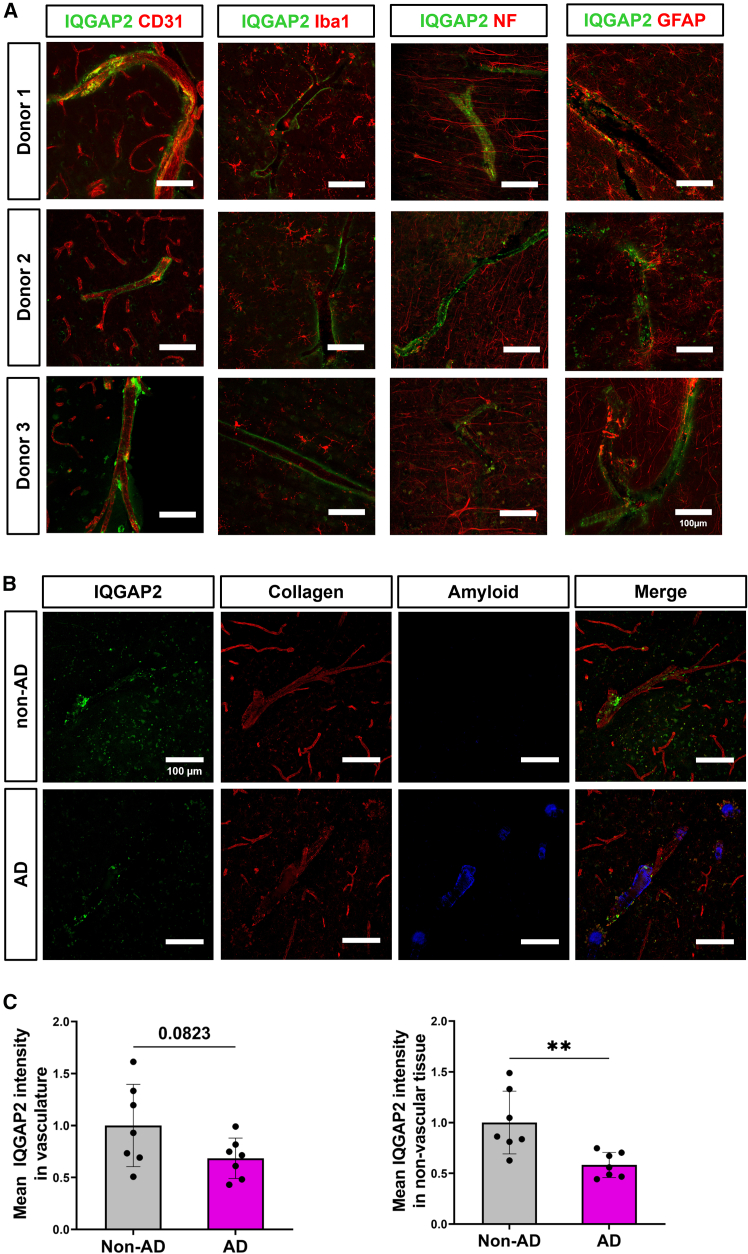
Brain endothelial cells (BECs) play an important role in maintaining central nervous system (CNS) homeostasis through blood-brain barrier (BBB) functions. BECs express low baseline levels of adhesion receptors, which limits entry of leukocytes. However, the molecular mediators governing this phenotype remain mostly unclear. Here, we explored how infiltration of immune cells across the BBB is influenced by the scaffold protein IQ motif containing GTPase-activating protein 2 (IQGAP2). In mice and zebrafish, we demonstrate that loss of Iqgap2 increases infiltration of peripheral leukocytes into the CNS under homeostatic and inflammatory conditions. Using single-cell RNA sequencing and immunohistology, we further show that BECs from mice lacking Iqgap2 exhibit a profound inflammatory signature, including extensive upregulation of adhesion receptors and antigen-processing machinery. Human tissue analyses also reveal that Alzheimer's disease is associated with reduced hippocampal IQGAP2. Overall, our results implicate IQGAP2 as an essential regulator of BBB immune privilege and immune cell entry into the CNS.

Keywords: immunology; neuroscience.


Conflict of interest statement

The authors declare no competing interests.

Figures

None
Graphical abstract
Figure 1
Figure 1
Global loss of Iqgap2 increases infiltration of peripheral leukocytes in a mouse model of acute neuroinflammation (A) Schematic representation of experimental design for assessing leukocyte numbers in mouse brains 24 h after intracerebroventricular saline or IL-1β delivery. (B) Representative images and quantification of CD45+ immune cells (magenta) and vasculature (green) in wild-type (WT) and Iqgap2−/− (KO) mouse brain cortex following treatment with saline or IL-1β. Scale bars represent 50 μm. Data are represented as mean ± SD, and each data point represents an individual mouse, where at least five images were quantified per mouse. For saline treatment, N = 3 WT mice and N = 3 KO mice, and for IL-1β treatment, N = 4 WT mice and N = 6 KO mice. Statistical significance was calculated using two-way ANOVA with Tukey’s multiple comparison’s test (∗p < 0.05; ∗∗∗p < 0.001).
Figure 2
Figure 2
Global loss of Iqgap2 increases infiltration of peripheral leukocytes in EAE (A) Schematic representation of experimental design for assessing response to EAE 30 days following induction. (B) Representative images and quantification of CD45+ immune cells (magenta) and vasculature (green) in wild-type (WT) and Iqgap2−/− (KO) lumbar spinal cord at 30 days following EAE induction. Scale bars represent 50 μm. Data are represented as mean ± SD, and each data point represents an individual mouse. At least eight images were quantified per mouse. N = 8 WT mice, N = 6 KO mice. Statistical significance was calculated using the unpaired Student’s t test (∗∗p < 0.01). (C) EAE score curve for wild-type (WT) and Iqgap2−/− (KO) mice following EAE induction. Data are presented as mean ± SEM. N = 8 WT mice, N = 6 KO mice. Statistical significance was calculated using the unpaired Student’s t test on area under the curve. (D) Probability of survival in WT versus KO mice following EAE induction. N = 10 WT and KO mice. Statistical significance was calculated using Log rank (Mantel-Cox) test. (E) Representative images and quantification of demyelinating lesions in WT and KO lumbar spinal cord section stained with Luxol fast blue at 30 days following EAE induction. Scale bars represent 250 μm. Data are represented as mean ± SD, and each data point represents an individual mouse, where one image was quantified per mouse. N = 8 WT mice, N = 6 KO mice. Statistical significance was calculated using the unpaired Student’s t test.
Figure 3
Figure 3
Mosaic loss of iqgap2 expression increases infiltration of peripheral immune cells into the zebrafish brain (A) Schematic representation of experimental design for assessing leukocyte numbers in the larval zebrafish brain. Double transgenic (kdrl:mCherry; mpeg:EGFP) single-cell embryos were injected with Cas9 protein and sgRNAs to target genes of interest. These mosaic crispants were then allowed to develop normally, and mpeg+ leukocytes were quantified in the brain at 5 dpf. (B) Representative 100-μm thick maximum intensity projection images and quantification of macrophage lineage cells (mpeg:EGFP) in the brains of uninjected (UN) controls, tyr crispant controls, and iqgap2 crispants. Vasculature is marked with the kdrl:mCherry transgene (magenta). Scale bars represent 100 μm. Data are represented as mean ± SD, and each data point represents an individual fish. N = 30 fish (UN), 15 fish (tyr), and 52 fish (iqgap2). Statistical significance was calculated using a one-way ANOVA with Tukey’s multiple comparison’s test (∗∗∗∗p < 0.0001). (C) Representative images and quantification of infiltrating leukocytes versus tissue-resident microglia in the brains of iqgap2 crispants versus uninjected (UN) controls. Representative 30-μm thick maximum intensity projection images of the dorsal (top) or ventral (bottom) brain regions and quantification of mpeg+ (green) macrophage lineage cells and mpeg+/Neutral Red+ (magenta) microglia. Yellow arrowheads indicate individual mpeg+/Neutral Red− infiltrating leukocytes in the ventral brain of iqgap2 crispants. Scale bars represent 100 μm. Data represented as mean ± SD, and each data point represents an individual fish. N = 16 fish (UN) and 20 fish (iqgap2). Statistical significance was calculated using an unpaired Student’s t test (∗∗∗∗p < 0.0001).
Figure 4
Figure 4
Global loss of Iqgap2 yields extensive transcriptional changes in BECs (A) Schematic representation of experimental design. Whole-brain cortices were isolated from wild-type (WT) and Iqgap2−/− (KO) mice, dissociated to a single-cell suspension using enzyme-based dissociation techniques, and sorted to enrich for CD31+ cells before sequencing. (B) UMAP cell annotations based on unsupervised clustering. EC, endothelial cells; EC/PC, EC/stromal cells (pericytes); EC/AC, EC/stromal cells (astrocytes); MNC, monocytes; MG, microglia. (C) UMAP comparison between WT (gray) and KO (pink) cells. (D) Volcano plot highlighting differentially expressed genes in the EC cluster; 928 genes were significantly altered, with 584 upregulated and 344 downregulated by loss of Iqgap2. Red dots indicate genes with p < 0.05 and >2-fold change in expression. (E) UMAP of endothelial zonal identity based on unsupervised clustering. A, arterial; C, capillary; V, venous. (F) Venn diagram showing number of DEGs shared between zonal identities.
Figure 5
Figure 5
Global loss of Iqgap2 produces a widespread inflammatory phenotype in BECs (A) Split violin plots indicating differential gene expression of select inflammatory markers across vascular zones between wild-type (WT) and Iqgap2−/− (KO) BECs. Statistical significance was calculated using Wilcox rank-order tests with Bonferroni correction (∗∗∗p < 0.001). (B) Representative images and quantification of vascular Vcam1 expression in WT versus KO mouse cortex. Scale bars represent 50 μm. Data are represented as mean ± SD (black bars). Biological replicates are represented as squares, and measurements from individual images are represented as circles color coded to each replicate. Quantification was performed across N = 3 biological replicates. Statistical significance was calculated using the student’s unpaired t test (∗p < 0.05). (C) GSEA analysis for signaling pathways upregulated in KO versus WT BECs. Each node represents an enriched gene set belonging to the labeled canonical pathway. Nodes are colored based on p value, and thickness of the connecting lines indicates similarity of overlapping genes represented in connected gene sets. KSHV, Kaposi-sarcoma-associated herpes virus infection; HTLV, human T cell leukemia virus 1 infection; HIV, human immunodeficiency virus 1 infection; PPER, protein processing in endoplasmic reticulum; HPV, human papillomavirus infection.
Figure 6
Figure 6
IQGAP2 distribution in human brain tissue (A) Representative confocal microscopy images of IQGAP2 and different markers for endothelium (CD31), microglia (Iba1), neurons (NF), and astrocytes (GFAP) in superior temporal lobe from donors without neurological disease. N = 3 individual donors. Scale bars represent 100 μm. (B) Representative confocal microscopy images of IQGAP2 (green) in human hippocampal tissue from AD and non-AD donors. Images were produced from 10 μm z stack scanning projections with a step interval of 1 μm. Vasculature was stained with collagen (red) and β-amyloid, and neuritic plaques, neurofibrillary tangles, and other tau aggregates were stained with Methoxy-X04 (blue). Scale bars represent 100 μm. (C) Mean IQGAP2 intensity in vascular regions was quantified with one scanning projection in collagen+ area, whereas IQGAP2 intensity in parenchyma was quantified by gating samples to exclude collagen+ area. Scale bars represent 100 μm. Data are presented as mean ± SD, where each data point represents an individual donor with at least five images quantified per donor. N = 7 non-AD donors and N = AD 7 donors. Statistical significance was calculated using unpaired Student’s t test (∗∗p < 0.01).

Update of

Similar articles

Cited by

References

    1. Profaci C.P., Munji R.N., Pulido R.S., Daneman R. The blood–brain barrier in health and disease: Important unanswered questions. J. Exp. Med. 2020;217 doi: 10.1084/jem.20190062. - DOI - PMC - PubMed
    1. Daneman R., Prat A. The Blood–Brain Barrier. Cold Spring Harb. Perspect. Biol. 2015;7:a020412. doi: 10.1101/cshperspect.a020412. - DOI - PMC - PubMed
    1. Obermeier B., Daneman R., Ransohoff R.M. Development, maintenance and disruption of the blood-brain barrier. Nat. Med. 2013;19:1584–1596. doi: 10.1038/nm.3407. - DOI - PMC - PubMed
    1. Engelhardt B., Coisne C. Fluids and barriers of the CNS establish immune privilege by confining immune surveillance to a two-walled castle moat surrounding the CNS castle. Fluids Barriers CNS. 2011;8:4. doi: 10.1186/2045-8118-8-4. - DOI - PMC - PubMed
    1. Louveau A., Harris T.H., Kipnis J. Revisiting the Mechanisms of CNS Immune Privilege. Trends Immunol. 2015;36:569–577. doi: 10.1016/j.it.2015.08.006. - DOI - PMC - PubMed

LinkOut - more resources