. 2025 Mar;55(3):e202451192.
doi: 10.1002/eji.202451192.

Vaginal Prevotella timonensis Bacteria Enhance HIV-1 Uptake and Differentially Affect Transmission by Distinct Primary Dendritic Cell Subsets

Affiliations

Vaginal Prevotella timonensis Bacteria Enhance HIV-1 Uptake and Differentially Affect Transmission by Distinct Primary Dendritic Cell Subsets

Marleen Y van Smoorenburg et al. Eur J Immunol. 2025 Mar.

Abstract

Young females are at high risk of acquiring HIV-1 infections and an imbalance in the vaginal microbiome enhances susceptibility to HIV-1 infection. More insights into the underlying mechanisms could open up new strategies to prevent HIV-1 acquisition and dissemination. Here, we investigated the effect of anaerobic bacteria associated with bacterial vaginosis (BV) on HIV-1 transmission by two distinct dendritic cell (DC) subsets, that is, inflammatory monocyte-derived DCs (moDCs) and primary CD1c+ DCs. Notably, in contrast to other BV-associated microbiota, Prevotella timonensis enhanced uptake of HIV-1 by both moDCs and CD1c+ DCs and the increased uptake was independent of cellular HIV-1 (co-)receptors. Imaging flow cytometry analyses showed that HIV-1 did not co-localise with P. timonensis but was internalized into tetraspanin-positive compartments known to be involved in HIV-1 transmission. P. timonensis bacteria enhanced HIV-1 transmission by CD1c+ DCs, but not by moDCs, and the enhanced transmission was independent of viral infection. Our study strongly suggests that mucosal DC subsets have distinct functions in BV-associated HIV-1 susceptibility, and underscores the importance of early diagnosis and targeted treatment of vaginal dysbiosis to reduce the risk of HIV-1 acquisition.

Keywords: HIV‐1 susceptibility; Prevotella timonensis; dendritic cells (DCs); primary CD1c+ DCs; transmission; vaginal dysbiosis; vaginal microbiome; viral uptake.


Conflict of interest statement

The authors declare no conflicts of interest.

Figures

FIGURE 1
FIGURE 1
Prevotella timonensis increases HIV‐1 uptake in moDCs. MoDCs were stimulated with UV‐inactivated bacteria for 16 h (731 ng) and subsequently exposed to HIV‐1 (SF162; 7.3 ng) for 24 h unless otherwise specified. HIV‐1 uptake was quantified by p24 ELISA following cell lysis. (A) MoDCs were exposed to Lactobacillus crispatus (LC), Gardnerella vaginalis (GV), Fannyhessea vaginae (FV), Megasphaera elsdenii (ME), Prevotella timonensis (PT), Bacteroides fragilis (BF), Prevotella bivia (PB), Prevotella copri (PC), Prevotella intermedia (PI), or LPS derived from Salmonella typhosa (10 ng/mL). (B) MoDCs were stimulated with increasing amounts of P. timonensis (14.6, 146, 731 ng). (C) MoDCs were exposed for 6 h to 20 ng of lab‐adapted HIV‐1 strains NL4.3 (HEK293T‐produced) and SF162 (PBMC‐produced), and Transmitted Founder (T/F) variants CH058 and THRO. (D) MoDCs were pre‐treated with a DC‐SIGN blocking antibody (AZN‐D1, 20 µg/mL), CLR inhibitor Mannan (100 µg/mL), a CCR5 antagonist (Maraviroc, 30 µM), or a CD4 blocking antibody (RPA‐T4, 20 µg/mL) for 45 min prior to 6 h HIV‐1 exposure. Experiments were performed for four (C, D) to six (A, B) different donors measured in triplicate. Symbols represent independent donors, bars represent mean + SD. Statistical analysis was performed using a two‐way ANOVA with Tukey's multiple comparisons test. ****p < 0.0001, *p < 0.05.
FIGURE 2
FIGURE 2
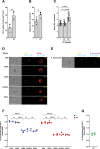
HIV‐1 localises to CD81‐ and CD9‐rich compartments, but does not co‐localise with P. timonensis. P. timonensis bacteria (CellTrace Violet (CTV)‐labelled (439 ng)) were incubated with HIV‐1 (SF162; 36.8 ng) for 1 h, and consequently incubated for 2 h with moDCs. Cells were fixed, stained, and acquired by imaging flow cytometry. DCs from each donor were exposed to HIV‐1 alone or together with P. timonensis. An average of 20,000 cells, positive for both HIV‐1 and the respective cellular marker, were analysed in each condition. A p24 spot count was performed using IDEAS software based on a mask created on the p24 image. (A) HIV‐1 uptake was determined by the percentage of cells positive for p24 spots. (B) Maximum number of p24 spots per cell. (C) Mean number of p24 spots per cell in untreated moDCs (‐), P. timonensis‐exposed moDCs with internalised P. timonensis (PT +) and P. timonensis‐exposed moDCs with no internalised bacteria (PT ). (D) Representative image of one cell per marker; respective brightfield image, overlay of p24 mask (blue) on p24 image (yellow) with spot count, and overlay of p24 mask (blue) on marker image (red) with Bright Detail Similarity (BDS) value. (E) Representative image of one cell; respective brightfield image, overlay of p24 mask (blue) on p24 image (yellow) with spot count, and overlay of p24 mask (blue) on P. timonensis image (purple) with BDS value. (F) Mean BDS values for HIV‐1 with CD9, CD81, CD63, CD107a or EEA1, determining co‐localisation. (G) Mean BDS value for HIV‐1 with P. timonensis bacteria. Experiments were performed for four different donors. Symbols represent independent donors, depicted with mean (F, G) or with bars representing mean + SD (A–C). Statistical analysis was performed using a paired two‐tailed t‐test (A, B) or a two‐way ANOVA with Tukey's multiple comparisons test (C, F). ****p < 0.0001, **p < 0.01, *p < 0.05.
FIGURE 3
FIGURE 3
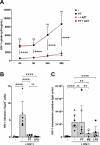
Enhanced P. timonensis‐induced viral uptake does neither lead to increased moDC infection nor transmission. MoDCs were stimulated with UV‐inactivated Prevotella timonensis (PT) for 16 h (731 ng) and subsequently to HIV‐1. (A) MoDCs were exposed to HIV‐1 (SF162; 36.8 ng) for 4 to 48 h in the presence or absence of replication inhibitor azidothymidine (AZT). HIV‐1 uptake was quantified by p24 ELISA following cell lysis. Symbols represent the mean of four independent donors measured in triplicate +SD. SD comparing US to PT and PT to PT + AZT are depicted. (B) HIV‐1 infection was assessed by flow cytometry after 5 days of HIV‐1 (MOI 0.015) exposure, following 16 h of PT or LPS (10 ng/mL) stimulation, by intracellular staining for the HIV‐1 capsid protein p24, and depicted as % p24+ cells. (C) MoDCs were stimulated with PT, Megasphaera elsdenii (ME), or LPS for 16 h and subsequently exposed to HIV‐1 (SF162; 36.8 ng) for 6 h. Cells were harvested, extensively washed, and co‐cultured for 48 h with TZM‐bl target cells to determine viral transmission by luciferase reporter activity. Experiments were performed for six (B) or four to seven (C) different donors measured in triplicate. Symbols represent independent donors, bars represent mean + SD. Statistical analysis was performed using a two‐way ANOVA with Tukey's multiple comparisons test. ****p < 0.0001, **p < 0.01.
FIGURE 4
FIGURE 4
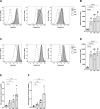
P. timonensis induces comparable cellular activation and type I IFN responses in both primary myeloid CD1c+ DCs and moDCs. Primary myeloid CD1c+ DCs (A, B, E) and moDCs (C, D, F) were stimulated for 16 h with UV‐inactivated M. elsdenii (ME) or P. timonensis (PT) (731 ng) or to LPS derived from Salmonella typhosa (10 ng/mL). (A–D) Surface expression was assessed by flow cytometry after staining for co‐stimulatory markers CD80 and CD86 and maturation marker CD83. Representative histograms of surface expression for one donor (A, C) or cumulative flow cytometry data for CD86 (B, D) expression by the geometric mean of the fluorescent intensity (MFI) are depicted. Symbols represent data of four independent donors measured in triplicate. (E, F). Expression of interferon‐stimulated‐gene APOBEC3G (A3G) was determined by quantitative real‐time PCR and normalised to household gene GAPDH. Symbols represent four independent donors, bars represent mean + SD. Statistical analysis was performed using a two‐way ANOVA with Tukey's multiple comparisons test. ****p < 0.0001, **p < 0.01.
FIGURE 5
FIGURE 5
P. timonensis increases HIV‐1 uptake in CD1c+ DCs. (A) Primary myeloid CD1c+ DCs were stimulated with UV‐inactivated Megasphaera elsdenii (ME), or Prevotella timonensis (PT) for 16 h (731 ng) and subsequently exposed to HIV‐1 (SF162; 36.8 ng) for 24 h. HIV‐1 uptake was quantified by p24 ELISA following cell lysis and depicted as fold change compared with HIV‐1 uptake in moDCs not stimulated with microbiota. Symbols represent four independent donors measured in triplicate, bars represent mean +SD. (B–D) P. timonensis bacteria (CellTrace Violet (CTV)‐labelled (439 ng)) were incubated with HIV‐1 (SF162; 36.8 ng) for 1 h, and consequently incubated for 2 h with CD1c+ DCs. Cells were fixed, stained, and acquired by imaging flow cytometry. CD1c+ DCs from each donor were exposed to HIV‐1 alone or together with P. timonensis. An average of 44,000 cells, positive for both HIV‐1 and the cellular marker, were analysed per donor in both conditions. A p24 spot count was performed using IDEAS software based on a mask created on the p24 image. (B) HIV‐1 uptake determined by the percentage of cells positive for p24 spots. (C) Maximum number of p24 spots per cell. (D) Mean number of p24 spots per cell in untreated CD1c+ DCs (‐), P. timonensis‐exposed moDCs with internalised P. timonensis (PT +), and P. timonensis‐exposed moDCs with no internalised bacteria (PT ). Experiments were performed for five different donors. Symbols represent independent donors, bars represent mean + SD. Statistical analysis was performed using a two‐way ANOVA with Tukey's multiple comparisons test (A, D) or a paired two‐tailed t‐test (B, C). ****p < 0.0001, ***p < 0.001, **p < 0.01.
FIGURE 6
FIGURE 6
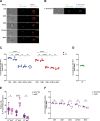
HIV‐1 localises to tetraspanin‐rich compartments in P. timonensis‐exposed CD1c+ DCs. P. timonensis bacteria (CellTrace Violet (CTV)‐labelled (439 ng)) were incubated with HIV‐1 (SF162; 36.8 ng) for 1 h, and consequently incubated for 2 h with CD1c+ DCs. Cells were fixed, stained, and acquired by imaging flow cytometry. CD1c+ DCs from each donor were exposed to HIV‐1 alone or together with P. timonensis. An average of 9000 cells, positive for both HIV‐1 and the respective cellular marker, were analysed in each condition. A p24 spot count was performed using IDEAS software based on a mask created on the p24 image. (A) Representative image of one cell per marker; respective brightfield image, overlay of p24 mask (blue) on p24 image (yellow) with spot count, and overlay of p24 mask (blue) on marker image (red) with bright detail similarity (BDS) value. (B) Representative image of one cell; respective brightfield image, overlay of p24 mask (blue) on p24 image (yellow) with spot count, and overlay of p24 mask (blue) on P. timonensis image (purple) with BDS value. (C) Mean BDS values for HIV‐1 with CD9, CD81, CD63, CD107a or EEA1, determining co‐localisation. (D) Mean BDS value for HIV‐1 with P. timonensis bacteria. (E, F) Based on a mask created on the P. timonensis image, a P. timonensis bacteria spot count was performed. (E) The percentage of moDCs and CD1c+ DCs positive for either P. timonensis spots (PT +p24 ) or p24 spots (PT p24 +) or both (PT +p24 +) are depicted. (F) Mean BDS values for P. timonensis with CD9, CD81, CD63, CD107a, or EEA1, determining co‐localisation in moDCs and CD1c+ DCs. Experiments were performed for four (moDCs) or five (CD1c+ DCs) different donors. Symbols represent independent donors, depicted with mean. Statistical analysis was performed using a two‐way ANOVA with Tukey's (C) or Šídák's (E, F) multiple comparisons test. ****p < 0.0001, *p < 0.05.
FIGURE 7
FIGURE 7
P. timonensis increases HIV‐1 transmission by CD1c+ DCs. Primary myeloid CD1c+ DCs were stimulated with UV‐inactivated P. timonensis (PT), M. elsdenii (ME) (731 ng) or to LPS (10 ng/mL) for 16 h and subsequently exposed to HIV‐1 (SF162; 36.8 ng). HIV‐1 infection was assessed by flow cytometry in the presence or absence of replication inhibitor AZT after 3 days of HIV‐1 exposure, following intracellular staining for the HIV‐1 capsid protein p24 (A, B). (A) Representative plots of different stimulations for one donor depicting p24 fluorescent intensity (FI) and percentage of HIV‐1+ cells. (B) HIV‐1 infection depicted as % p24+ cells. C. CD1c+ DCs were harvested 24 h post HIV‐1 exposure, extensively washed, and co‐cultured for 48 h with TZM‐bl target cells to determine viral transmission by luciferase reporter activity. HIV‐1 transmission to target cells was depicted as fold change compared with HIV‐1 transmission of cells not stimulated with microbiota. Experiments were performed for three (B) or four (C) different donors measured in triplicate. Symbols represent independent donors, bars represent mean + SD. Statistical analysis was performed using a two‐way ANOVA with Tukey's multiple comparisons test. ****p < 0.0001, ***p < 0.001.

References

    1. UNAIDS . UNAIDS Global AIDS update 2022. 2022.
    1. UNAIDS . WE'VE GOT THE POWER Women, Adolescent Girls and the HIV Response. 2020.
    1. Atashili J., Poole C., Ndumbe P. M., Adimora A. A., and Smith J. S., “Bacterial Vaginosis and HIV Acquisition: A Meta‐analysis of Published Studies,” Aids 22, no. 12 (2008): 1493–1501. - PMC - PubMed
    1. Borgdorff H., Tsivtsivadze E., Verhelst R., et al., “Lactobacillus‐dominated Cervicovaginal Microbiota Associated with Reduced HIV/STI Prevalence and Genital HIV Viral Load in African Women,” The ISME Journal 8, no. 9 (2014): 1781–1793. - PMC - PubMed
    1. Klatt N. R., Cheu R., Birse K., et al., “Vaginal Bacteria Modify HIV Tenofovir Microbicide Efficacy in African Women,” Science 356, no. 6341 (2017): 938–945. - PubMed

MeSH terms

LinkOut - more resources