Randomized Controlled Trial
. 2025 Jun;39(3):372-388.
doi: 10.1007/s00540-025-03476-z. Epub 2025 Mar 12.

Development and evaluation of an automated phenylephrine delivery system by lower limit control for managing intraoperative hypotension

Affiliations
Randomized Controlled Trial

Development and evaluation of an automated phenylephrine delivery system by lower limit control for managing intraoperative hypotension

Osamu Nagata et al. J Anesth. 2025 Jun.

Abstract

Purpose: In this study, we aimed to develop and evaluate an automated phenylephrine delivery system by lower limit control for the management of intraoperative hypotension, assessing its efficacy in maintaining adequate blood pressure levels.

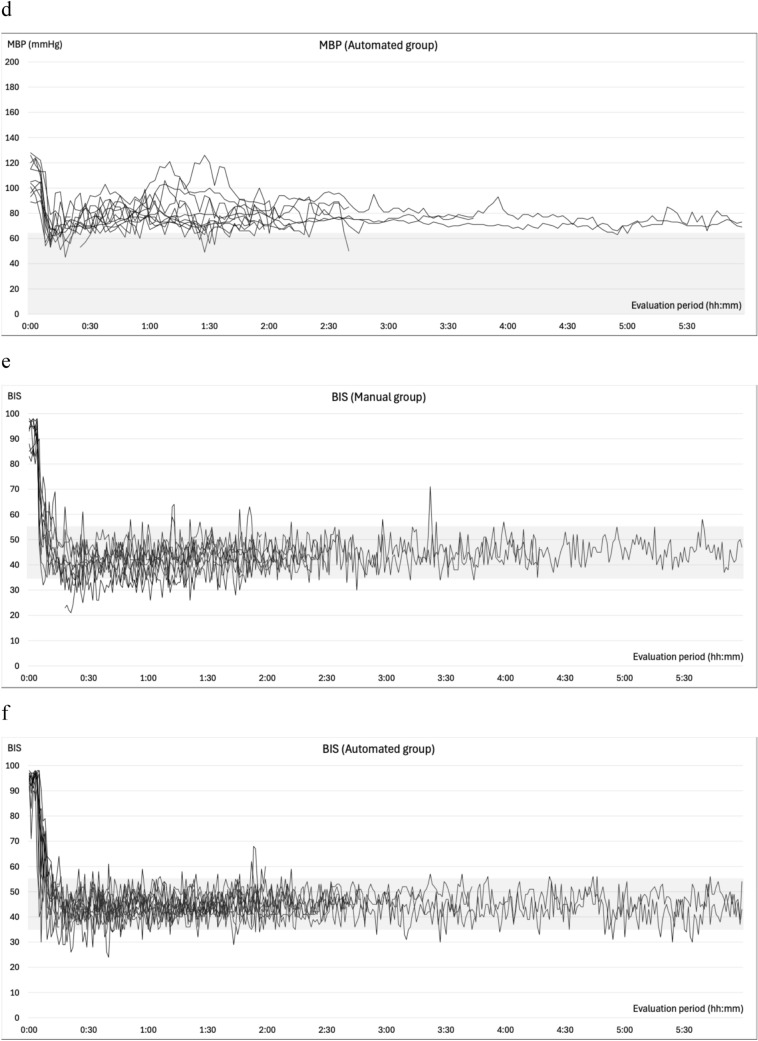
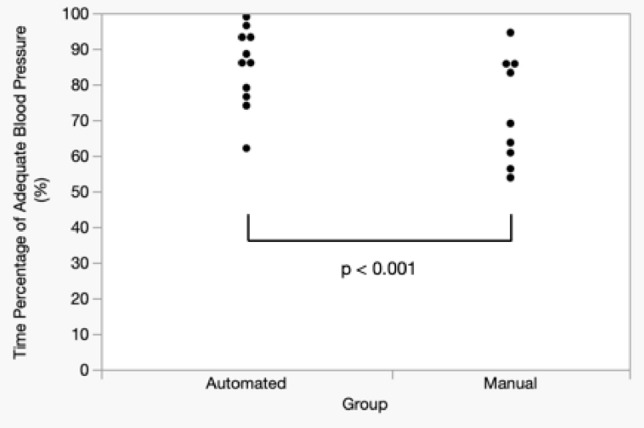
Methods: Twenty patients undergoing surgery with anticipated blood pressure fluctuations were enrolled in this study. Patients were randomly assigned to two groups. Noninvasive blood pressure (NIBP) was measured at 2.5-min intervals using an upper arm cuff. In the automated group, phenylephrine administration was governed by an automated system that delivered bolus doses and adjusted the continuous infusion rate when mean blood pressure (MBP) dropped below 65 mmHg. In the manual group, phenylephrine administration was initiated by the attending anesthesiologist under the same MBP threshold. Propofol, remifentanil, and rocuronium were administered via the automated delivery system for total intravenous anesthesia, to minimize hemodynamic variability between groups. The primary end point was the percentage of time during which MBP remained above 65 mmHg and systolic blood pressure below 140 mmHg, measured from the initiation to the cessation of intravenous anesthesia and assessed using a non-inferiority test.

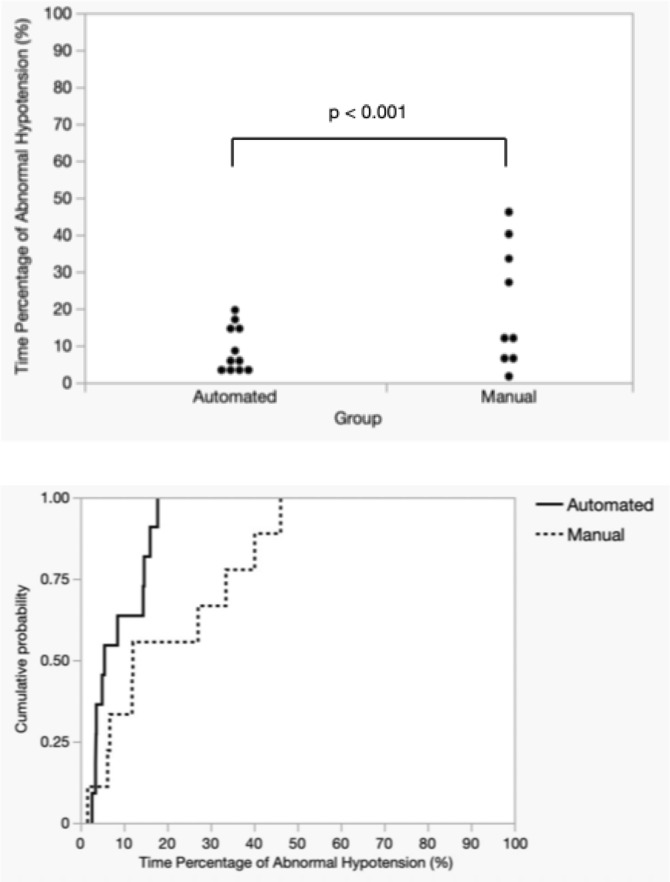
Results: The automated group adequately maintained blood pressure within the target range for 84.53% of the time, compared to 72.45% in the manual group, confirming statistical non-inferiority (p < 0.001).

Conclusion: This system effectively managed intraoperative hypotension using intermittent NIBP measurements, which are more feasible in clinical practice. Despite relying on less frequent and lower-resolution blood pressure data, it demonstrated efficacy comparable to anesthesiologist-led management, indicating its potential for broader clinical application.

Keywords: Automated drug delivery system; Intraoperative hypotension; Lower limit control; Noninvasive blood pressure measurement; Phenylephrine.


Conflict of interest statement

Declarations. Conflict of interest: Osamu Nagata holds a patent on the automated delivery system for intravenous anesthetics; Emi Morinushi, Aya Kuroyanagi, and Fumiyo Yasuma have no conflicts of interest.

Figures

Fig. 1
Fig. 1
Conceptual framework for automated phenylephrine administration. 1. Upon detection of mean blood pressure (MBP) falling below the predefined threshold, the system administers the first bolus of phenylephrine. 2. If MBP remains below the threshold, a second phenylephrine bolus is administered, followed by the initiation of continuous phenylephrine infusion. 3. The phenylephrine infusion rate is adjusted based on subsequent MBP readings. 4. Continuous phenylephrine administration is discontinued when MBP is sufficiently above the threshold. 5. The device remains inactive if MBP exceeds the upper safety limit
Fig. 2
Fig. 2
The configuration of this system. LAN local area network, TIVA total intravenous anesthesia
Fig. 3
Fig. 3
Patient flowchart. FAS full analysis set, PPS per protocol set
Fig. 4
Fig. 4
Intraoperative trends. Panels a and b depict the changes in systolic blood pressure, while panels c and d illustrate the variations in mean blood pressure from the initiation to the conclusion of the evaluation period. Panels e and f illustrate the variations in BIS®, g and h show the change of effect site concentration of propofol, i and j reveal the change of effect site concentration of remifentanil under automated delivery system for TIVA. Panels k and l depict the changes in the stroke volume index (esSVI), and m and n in the cardiac index (esCCI). Data are presented for the manual (a, c, e, g, i, k, m) and automated (b, d, f, h, j, l, n) groups, with each line representing individual patient data. SBP: systolic blood pressure; MBP: mean blood pressure
Fig. 4
Fig. 4
Intraoperative trends. Panels a and b depict the changes in systolic blood pressure, while panels c and d illustrate the variations in mean blood pressure from the initiation to the conclusion of the evaluation period. Panels e and f illustrate the variations in BIS®, g and h show the change of effect site concentration of propofol, i and j reveal the change of effect site concentration of remifentanil under automated delivery system for TIVA. Panels k and l depict the changes in the stroke volume index (esSVI), and m and n in the cardiac index (esCCI). Data are presented for the manual (a, c, e, g, i, k, m) and automated (b, d, f, h, j, l, n) groups, with each line representing individual patient data. SBP: systolic blood pressure; MBP: mean blood pressure
Fig. 5
Fig. 5
Primary outcome: distribution of time spent (in percentages) within the target blood pressure range
Fig. 6
Fig. 6
Distribution and cumulative probability of time spent (in percentages) in hypotension
Fig. 7
Fig. 7
Distribution and cumulative probability of time spent (in percentages) in hypertension
Fig. 8
Fig. 8
Selection of control accuracy index according to control method. Cases #1 and #2, in which no vasopressor was administered, met the condition of the lower limit control 100% of the time, indicating high control accuracy. However, when comparing them using MDPE and MDAPE, a discrepancy arises in which Case #3 has higher control accuracy than Case #2. MDPE median performance error, MDAPE median absolute performance error

Comment in

  • Letter to the article by Nagata et al.
    Kodaira A, Imai E, Kataoka Y. Kodaira A, et al. J Anesth. 2025 Aug 18. doi: 10.1007/s00540-025-03565-z. Online ahead of print. J Anesth. 2025. PMID: 40824289 No abstract available.

References

    1. Scott MJ, APSF Hemodynamic Instability Writing Group. Perioperative patients with hemodynamic instability: consensus recommendations of the Anesthesia Patient Safety Foundation. Anesth Analg. 2024;138:713–24. - PMC - PubMed
    1. Cardenas-Garcia J, Schaub KF, Belchikov YG, Narasimhan M, Koenig SJ, Mayo PH. Safety of peripheral intravenous administration of vasoactive medication. J Hosp Med. 2015;10:581–5. - PubMed
    1. Ngan Kee WD, Tam YH, Khaw KS, Ng FF, Critchley LA, Karmakar MK. Closed-loop feedback computer-controlled infusion of phenylephrine for maintaining blood pressure during spinal anaesthesia for caesarean section: a preliminary descriptive study. Anaesthesia. 2007;62:1251–6. - PubMed
    1. Joosten A, Rinehart J, Van der Linden P, Alexander B, Penna C, De Montblanc J, Cannesson M, Vincent JL, Vicaut E, Duranteau J. Computer-assisted individualized hemodynamic management reduces intraoperative hypotension in intermediate- and high-risk surgery: a randomized controlled trial. Anesthesiology. 2021;135:258–72. - PMC - PubMed
    1. Nagata O, Matsuki Y, Matsuda S, Hazama K, Fukunaga S, Nakatsuka H, Yasuma F, Maehara Y, Fujioka S, Tajima K, Kondo I, Ginoza I, Hayashi M, Kakinohana M, Shigemi K. Anesthesia management via an automated control system for propofol, remifentanil, and rocuronium compared to management by anesthesiologists: an investigator-initiated study. J Clin Med. 2023;12:6611. - PMC - PubMed

Publication types

LinkOut - more resources