. 2025 Mar 14;11(11):eadr5448.
doi: 10.1126/sciadv.adr5448. Epub 2025 Mar 12.

Phagocytosis-driven neurodegeneration through opposing roles of an ABC transporter in neurons and phagocytes

Affiliations

Phagocytosis-driven neurodegeneration through opposing roles of an ABC transporter in neurons and phagocytes

Xinchen Chen et al. Sci Adv. .

Abstract

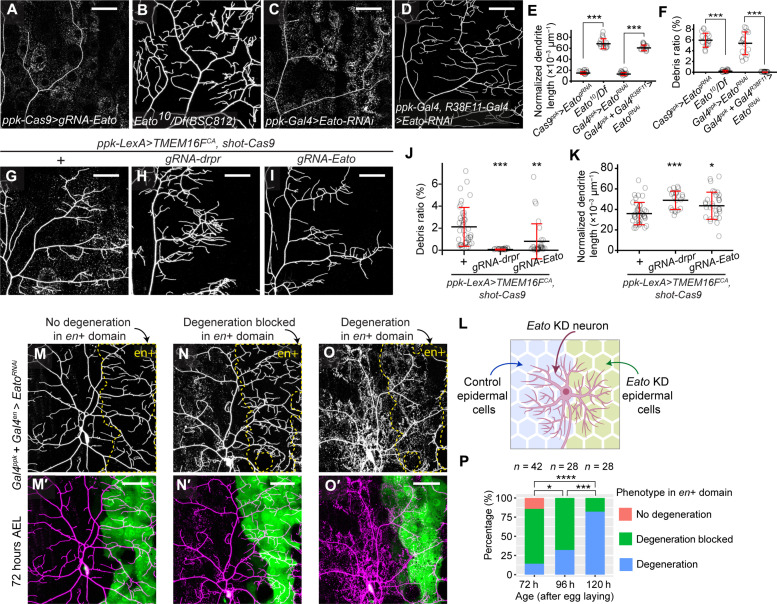
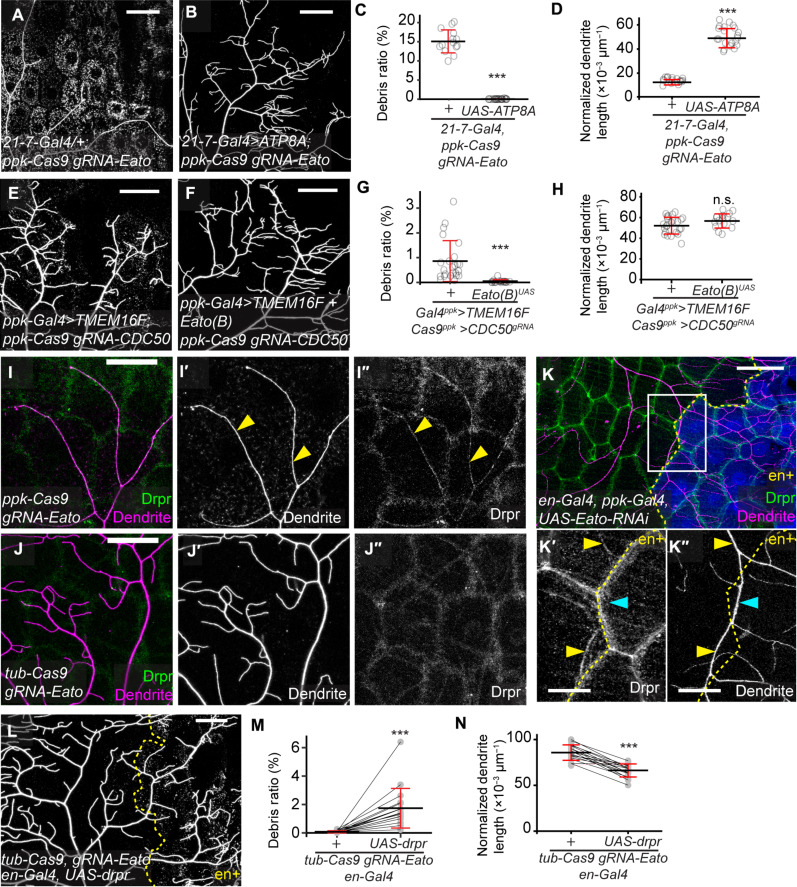
Lipid homeostasis is critical to neuronal survival. ATP-binding cassette A (ABCA) proteins are lipid transporters associated with neurodegenerative diseases. How ABCA transporters regulate lipid homeostasis in neurodegeneration is an outstanding question. Here we report that the Drosophila ABCA protein engulfment ABC transporter in the ovary (Eato) regulates phagocytosis-dependent neurodegeneration by playing opposing roles in neurons and phagocytes: In neurons, Eato prevents dendrites and axons from being attacked by neighboring phagocytes; in phagocytes, Eato sensitizes the cell for detecting neurons as engulfment targets. Thus, Eato deficiency in neurons alone causes phagocytosis-dependent neurite degeneration, but additional Eato loss from phagocytes suppresses the neurite degeneration. Mechanistically, Eato functions by removing the eat-me signal phosphatidylserine from the cell surface in both neurons and phagocytes. Multiple human and worm ABCA homologs can rescue Eato loss in phagocytes but not in neurons, suggesting both conserved and cell type-specific activities of ABCA proteins. These results imply possible mechanisms of neuron-phagocyte interactions in neurodegenerative diseases.


Figures

Fig. 1.
Fig. 1.. Eato LOF in C4da neurons leads to engulfment-dependent dendrite degeneration.
(A) Eato gene structure and reagents used in this study. (B to E) C4da neuron dendrites in ppk-Cas9 control (B), C4da-specific Eato KO (C), ppk-Gal4 control (D), and C4da-specific Eato KD (E). (F and G) Normalized dendrite length (total dendrite length/total area) (F) and debris ratio (debris area/total area) (G) in (B) to (E). n = neuron number and N = animal number: Cas9ppk (n = 16, N = 9); Cas9ppk gRNA-Eato (n = 16, N = 8); Gal4ppk (n = 20, N = 11); Gal4ppk>Eato-RNAi (n = 16, N = 14). (H to K) Dendrites of C4da-specific Eato KO across different developmental stages. (L and M) Normalized dendrite length (L) and debris ratio (M) in (H) to (K). Sample sizes: 48 hours (n = 16, N = 8); 72 hours (n = 17, N = 11); 96 hours (n = 24, N = 12); 120 hours (n = 16, N = 8). (N to O″) Binding patterns of the PS sensor GFP-Lact on control [(N) to (N″)] and Eato KO neurons [(O) to (O″)]. Fat body–specific dcg-Gal4 drives expression of GFP-Lact. (P to R) C4da neuron dendrites in ppk-Gal4 UAS-Cas9 control (P), C4da-specific Eato KO (Q), and C4da-specific Eato KO in drprindel3 homozygous mutant (R). (S and T) Normalized dendrite length (S) and debris ratio (T) in (P) to (R). Sample sizes: Gal4ppk>Cas9ppk (n = 15, N = 10); Gal4ppk>Cas9 gRNA-Eato (n = 16, N = 11); Gal4ppk>Cas9 gRNA-Eato drprindel3 (n = 16, N = 12). C4da neurons were labeled by ppk-MApHS in (B) to (E) and (H) to (K), ppk-CD4-tdTomato in (N) to (O″), and ppk-Gal4 UAS-CD4-tdTomato in (P) to (R). Scale bars: 50 μm [(B) to (E), (H) to (K), and (P) to (R)] and 20 μm [(N) to (O″)]. ***P < 0.001; n.s., not significant; one-way analysis of variance (ANOVA) with Tukey post hoc test.
Fig. 2.
Fig. 2.. Eato LOF makes epidermal cells insensitive to degenerating dendrites.
(A to D) C4da neuron dendrites in C4da-specific Eato KO (A), Eato10/Df(BSC812) transheterozygous mutant (B), C4da-specific Eato KD (C), and both C4da and epidermal cell–specific Eato KD (D). (E and F) Normalized dendrite length (E) and debris ratio (F) in (A) to (D). Sample sizes: Cas9ppk>EatogRNA (n = 16, N = 8); Eato10/Df (n = 16, N = 7); Gal4ppk>EatoRNAi (n = 16, N = 14); Gal4ppk + Gal4R38F11>EatoRNAi (n = 16, N = 9). (G to I) C4da neuron dendrites of TMEM16FCA-overexpressing (OE) C4da neurons with control epidermal cells (G), epidermal cell–specific drpr KO (H), and epidermal cell-specific Eato KO (I) in late third-instar larvae. (J and K) Quantification of normalized dendrite length (J) and debris ratio (K) in (G) to (I). Sample sizes: ppk-LexA>TMEM16FCA shot-Cas9 (n = 40, N = 19); ppk-LexA>TMEM16FCA shot-Cas9 gRNA-drpr (n = 21, N = 15); ppk-LexA>TMEM16FCA shot-Cas9 gRNA-Eato (n = 30, N = 15). (L) Experiment design in (M) to (O′). (M to O′) C4da neuron dendrites from the experiment described in (L). en+ domains in grayscale images are enclosed by yellow dashed lines. Three categories of phenotypes: no degeneration [(M) and (M′)], degeneration blocked in the en+ domain [(N) and (N′)], and degeneration in en+ domain [(O) and (O′)]. (P) Percentage of three genotypes in 72 to 120 hours (h) AEL animals. Sample sizes: 72 hours (n = 42, N = 18); 96 hours (n = 28, N = 14); 120 hours (n = 28, N = 14). Pan-epidermal expression is driven R38F11-Gal4. Pan-epidermal KO is driven by shot-Cas9. C4da neurons were labeled by ppk-MApHS in (A) to (D), (G) to (I), and (M) to (O′). Scale bars, 50 μm. *P < 0.05, **P < 0.01, ***P < 0.001, and ****P < 0.0001; [(E), (F), (J), and (K)] one-way ANOVA with Tukey post hoc test; (P) chi-square test, P value adjusted by a false discovery rate method.
Fig. 3.
Fig. 3.. Eato LOF in da neurons causes glia-dependent axon degeneration.
(A to D) Axons of C4da neurons in ppk-Gal4 UAS-Cas9 control (A), C4da-specific Eato KO (B), and C4da-specific Eato KO in drprindel3 homozygous mutant (C) late third-instar larvae. Degeneration level is quantified as degeneration score in (D) (see Materials and Methods). n = number of brains: ppk-MApHS (n = 16); ppk-Gal4>Cas9 gRNA-Eato (n = 21); ppk-Gal4>Cas9 gRNA-Eato drpr−/− (n = 19). (E to H) Axons of C4da neurons in C4da-specific Eato KD (E), C4da and glia-specific Eato KD (F), and C4da and epidermal cell-specific Eato KD (G) animals. Degeneration level is quantified as degeneration score in (H). n = number of brains: ppk-MApHS (n = 16); ppk-Gal4>Eato-RNAi (n = 17); ppk-Gal4 + repo-Gal4>Eato-RNAi (n = 18), ppk-Gal4 + R38F11-Gal4>Eato-RNAi (n = 16). Glia-specific expression is driven by repo-Gal4. C4da neurons were labeled by ppk-MApHS in (A) to (C) and (E) to (G). Scale bars, 50 μm. In all plots, ***P < 0.001; n.s., not significant, one-way ANOVA with Tukey post hoc test. A.U., arbitrary units.
Fig. 4.
Fig. 4.. Eato encodes a membrane protein required for the integrity of diverse neurons in both PNS and CNS.
(A to A″) Eato expression on the larval body wall at 96 hours AEL. nSyb-tdGFP labels neurons (A). Eato-Gal4MI14571 drives expression of nuclear mCherry (A′). Yellow arrowheads: epidermal nuclei; blue arrows: neuronal nuclei. Top insets show a bd neuron expressing Eato, and bottom insets show an es neuron without Eato expression. (B to B″) Eato expression in an intersegmental nerve bundle. Glial cells are labeled by repo-CD4-tdTomato (B). Eato-Gal4MI14571 drives the expression of a nuclear GFP (B′). Yellow arrowheads: glial nuclei. (C to D″) Eato expression in the CNS. Eato-Gal4MI14571 drives the expression of a nuclear GFP. Elav staining visualizes neuronal nuclei [(C) to (C″)]. Arrows: neurons with Eato expression; arrowheads: neurons without Eato expression. Repo staining visualizes glial nuclei [(D) to (D″)]. Arrows: glia with Eato expression; arrowheads: glia without Eato expression. (E and E′) Localization of FLAG-tagged Eato protein in epidermal cells. Eato(B) is expressed by en-Gal4 and detected by FLAG antibody staining. In (E′), mIFP shows the en+ domain (blue), and Nrg-GFP shows cell junctions (green). (F) Endogenous Eato in Eato-(mNG11-OLLAS)×4, detected by OLLAS staining. Yellow arrowheads: dendrite tracks; blue asterisks: epidermal cells. (G) Neuronal Eato in Eato-(mNG11-OLLAS)×4 homozygotes, detected by split-mNeonGreen reconstitution. mNG1–10 is expressed by RabX4-Gal4. Cyan arrowhead: soma; green arrowhead: axon; yellow arrowheads: dendrites. (H and I) Eato10 homozygous clones in class I da (H) and class II da (I) neurons. Clones were labeled by RabX4-Gal4 UAS-MApHS. pHluorin is in green and tdTom is in magenta. Magenta-only signals indicate neuronal debris engulfed by epidermal cells. (J and K) Control (J) and Eato10 mutant (K) neuronal clones in the adult optical lobe. Clones were labeled by RabX4-Gal4 UAS-MApHS, but only tdTom signal is shown. MAGIC, mosaic analysis by gRNA-induced crossing-over.
Fig. 5.
Fig. 5.. Putative ABCA transporter activity is required for Eato’s function.
(A to C) Dendrites of C4da neurons in ppk-Gal4 control (A), C4da-specific Eato(B/C) KD (B), and C4da-specific Eato(B) KD (C) late third-instar larvae. (D and E) Quantification of normalized dendrite length (D) and debris ratio (E) of neurons in (A) to (C). n = number of neurons and N = number of animals: ppk-Gal4 (n = 16, N = 11); ppk-Gal4>Eato-RNAi[HMC] (n = 16, N = 14); ppk-Gal4>Eato-RNAi[KK] (n = 20, N = 13). The datasets of ppk-Gal4 and ppk-Gal4>Eato-RNAi[HMC06027] are the same as in Fig. 1. (F to K) Dendrites of C4da neurons in 21-7-Gal4 control (F), C4da-specific Eato KO (G), C4da-specific Eato KO with da-specific Eato(B) OE (H), and C4da-specific Eato KO with da-specific Eato(B.MM) OE (I) late third-instar larvae. Normalized dendrite length is quantified in (J), and debris ratio is quantified in (K). n = number of neurons and N = number of animals: 21-7Gal4 (n = 16, N = 8); 21-7-Gal4 ppk-Cas9 gRNA-Eato (n = 16, N = 8); 21-7-Gal4>UAS-Eato(B) ppk-Cas9 gRNA-Eato (n = 17, N = 11); 21-7-Gal4>UAS-Eato(B,MM) ppk-Cas9 gRNA-Eato (n = 20, N = 12). (L) Dendrites of C4da neurons in en-Gal4 UAS-Eato(B); tub-Cas9 gRNA-Eato UAS-mIFP animals. The en+ domain is right to the yellow dashed line. The anterior nonexpressing region serves as a control. Comparisons between the control (+) and en+ domains are shown in (M) (for normalized dendrite length) and (N) (for debris ratio). Data are from 23 neurons in 14 animals. 21-7-Gal4 drives expression in da neurons. C4da neurons were labeled by ppk-MApHS in (A) to (C), (F) to (I), and (L). Scale bars, 50 μm. In all plots, ***P < 0.001. [(D), (E), (J), and (K)] One-way ANOVA with Tukey post hoc test. [(M) and (N)] Paired t test.
Fig. 6.
Fig. 6.. Eato suppresses PS exposure in neurons and facilitates Drpr recruitment to degenerating dendrites in epidermal cells.
(A to D) C4da-specific Eato KO (A) and C4da-specific Eato KO with da-specific ATP8A expression (B). Debris ratio is in (C), and normalized dendrite length is in (D). Sample sizes: 21-7-Gal4 ppk-Cas9 gRNA-Eato (n = 16, N = 8); 21-7-Gal4 UAS-ATP8A ppk-Cas9 gRNA-Eato (n = 21, N = 11). (E to H) C4da neuron dendrites with ectopic PS exposure (E) and additional Eato(B) OE (F). Ectopic PS exposure was induced by TMEM16F OE and simultaneous CDC50 KO. Debris ratio is in (G), and normalized dendrite length is in (H). Sample sizes: Gal4ppk>TMEM16F Cas9ppk>CDC50gRNA (n = 24, N = 14); Gal4ppk>TMEM16F + Eato(B) Cas9ppk>CDC50gRNA (n = 16, N = 12). (I to J″) Drpr-GFP in C4da-specific Eato KO [(I) to (I″)] and whole-body Eato KO [(J) to (J″)] mid-third–instar larvae. Yellow arrowheads: Drpr-GFP alone dendrites. (K to K″) Drpr staining in a mid-third–instar larva where Eato is knocked down in both C4da neurons and the en+ domain. The en+ domain [mIFP, blue in (K)] is located right to the yellow dashed line in [(K′) and (K″)]. Yellow arrowheads: Drpr in control epidermal cells; cyan arrowheads: absence of Drpr in Eato KD epidermal cells. (L) Dendrites in whole-body Eato KO with Drpr OE by en-Gal4. The en+ region is right to the yellow dashed line. Debris ratio is in (M), and normalized dendrite length is in (N). Data are from 18 neurons in 11 animals. C4da neurons were labeled by ppk-MApHS in (A), (B), and (L); ppk-CD4-tdTomato in (E), (F), and (I) to (K″). Scale bars, 50 μm [(A), (B), (E), (F), and (I) to (L)] and 20 μm in [(K′) and (K″)]. ***P < 0.001. [(C), (D), (G), and (H)] Two-sample t test; [(M) and (N)] paired t test.
Fig. 7.
Fig. 7.. Eato promotes engulfment activity of epidermal cells by suppressing PS exposure.
(A to C) GFP-Lact on control (A) and Eato KO [(B), tub-Cas9>gRNA-Eato] epidermal cells. GFP intensity: (C). Sample sizes: + (n = 16, N = 8); tub-Cas9>gRNA-Eato (n = 17, N = 11). (D to F) GFP-Lact on CDC50 KO [(D), by hh-Cas9] and CDC50 KO with Eato OE (E) epidermal cells, at a lower brightness setting to avoid oversaturation. GFP intensity: (F). Sample sizes: hh-Cas9 gRNA-CDC50 R38F11-Gal4 (n = 10, N = 5); hh-Cas9 gRNA-CDC50 R38F11-Gal4 UAS-Eato(B) (n = 6, N = 4). (G and H) Dendrites (G) and debris level (H) in whole-body Eato KO with en-Gal4>CDC50-2A-ATP8A (G). Nineteen neurons in 12 animals. (I to M) C4da-specific Eato KD (I) and additional CDC50 KO (J) or ATP8A KO (K) in epidermal cells. Debris ratio: (L); normalized dendrite length: (M). Sample sizes: Gal4ppk>EatoRNAi shot-Cas9 (n = 19, N = 13); Gal4ppk>EatoRNAi shot-Cas9 gRNA-CDC50 (n = 19, N = 13); Gal4ppk>EatoRNAi shot-Cas9 gRNA-ATP8A (n = 23, N = 14). (N to T) Neuronal TMEM16FCA OE (N) and additional drpr KO (O), Eato KO (P), CDC50 KO (Q), or ATP8A KO (R) in epidermal cells. Debris ratio: (S); normalized dendrite length: (T). Sample sizes: ppk-LexA>TMEM16FCA shot-Cas9 (n = 40, N = 19); ppk-LexA>TMEM16FCA shot-Cas9 gRNA-drpr (n = 21, N = 15); ppk-LexA>TMEM16FCA shot-Cas9 gRNA-Eato (n = 30, N = 15); ppk-LexA>TMEM16FCA shot-Cas9 gRNA-CDC50 (n = 41, N = 25); ppk-LexA>TMEM16FCA shot-Cas9 gRNA-ATP8A (n = 54, N = 24). The datasets in (N) to (P) are the same as in Fig. 2. C4da neurons were labeled by ppk-MApHS. Scale bars, 50 μm. ***P < 0.001. [(C) and (F)] T test; (H) paired t test; [(L), (M), (S), and (T)] one-way ANOVA with Tukey post hoc test.
Fig. 8.
Fig. 8.. Human and C. elegans ABCA proteins can compensate for the loss of Eato in phagocytes.
(A to D) Dendrites of C4da neurons in whole-body Eato KO (A) and with additional OE of Eato(B) (B), Eato(B.MM) (C), and CED-7 (D) in the en+ domain. The larvae were raised at 25°C. (E to N) Dendrites of C4da neurons in whole-body Eato KO (E) and with additional OE of Eato(B) (F), Eato(B.MM) (G), human ABCA1 (H), human ABCA2 (I), human ABCA3 (J), human ABCA4 (K), human ABCA5 (L), mouse ABCA7 (M), and human ABCA12 (N) in the en+ domain. The larvae were raised at 29°C. (O and P) Quantification of normalized dendrite length (O) and debris ratio (P) in (A) to (N). n = number of neurons and N = number of animals. 25°C: + (n = 17, N = 10); Eato(B) (n = 23, N = 14); Eato(B,MM) (n = 20, N = 7); CED-7 (n = 30, N = 11). 29°C: + (n = 20, N = 6); Eato(B) (n = 30, N = 13); Eato(B,MM) (n = 19, N = 6); hABCA1 (n = 24, N = 7); hABCA2 (n = 19, N = 6); hABCA3 (n = 20, N = 6); hABCA4 (n = 19, N = 6); hABCA5 (n = 23, N = 5); mABCA7 (n = 20, N = 6); hABCA12 (n = 23, N = 7). Scale bars, 50 μm. In all plots, ***P < 0.001, **P < 0.01, and *P < 0.05; one-way ANOVA with Tukey post hoc test.

References

    1. Dean M., Moitra K., Allikmets R., The human ATP-binding cassette (ABC) transporter superfamily. Hum. Mutat. 43, 1162–1182 (2022). - PMC - PubMed
    1. Quazi F., Molday R. S., Lipid transport by mammalian ABC proteins. Essays Biochem. 50, 265–290 (2011). - PubMed
    1. Broccardo C., Luciani M.-F., Chimini G., The ABCA subclass of mammalian transporters. Biochim. Biophys. Acta 1461, 395–404 (1999). - PubMed
    1. Albrecht C., Viturro E., The ABCA subfamily—gene and protein structures, functions and associated hereditary diseases. Pflugers Arch. 453, 581–589 (2007). - PubMed
    1. Piehler A. P., Ozcurumez M., Kaminski W. E., A-subclass ATP-binding cassette proteins in brain lipid homeostasis and neurodegeneration. Front. Psych. 3, 17 (2012). - PMC - PubMed

MeSH terms

Substances

LinkOut - more resources