. 2025 Mar 25;44(3):115366.
doi: 10.1016/j.celrep.2025.115366. Epub 2025 Mar 11.

Distinct features of a peripheral T helper subset that drives the B cell response in dengue virus infection

Affiliations

Distinct features of a peripheral T helper subset that drives the B cell response in dengue virus infection

Asgar Ansari et al. Cell Rep. .

Abstract

Dengue-virus-induced humoral immunity can increase the risk of severe disease, but the factors influencing this response are poorly understood. Here, we investigate the contribution of CD4+ T cells to B cell responses in human dengue infection. We identify a dominant peripheral PD-1+ T cell subset that accumulates in severe patients and could induce B cell differentiation via interleukin-21 (IL-21)-related pathway. Single-cell analyses reveal heterogeneity within PD-1+ cells, demonstrating the coexistence of subsets with "helper" (IL-21+) or "cytotoxic" characteristics. The IL-21+ subset displays a distinct clonotypic and transcriptomic signature compared to follicular helper T cells and persists as a memory in lymph nodes. Notably, we show that the IL-21+ subset seems to majorly drive the extrafollicular B cell responses in dengue. Our study establishes the peripheral IL-21+ subset as a potential determinant of the humoral response to dengue virus infection. These findings provide important insights into the T-cell-dependent regulation of humoral responses and can inform the design of effective dengue vaccines.

Keywords: CP: Immunology; CP: Microbiology; IL-21; PD-1(+) T helper; T cell clonotypes; T cell-B cell collaboration; T follicular helper; antibody response; dengue; extrafollicular B cells; humoral immunity; single-cell transcriptomics.


Conflict of interest statement

Declaration of interests N.G. and A.A. are listed as inventors on patents submitted by the National Institute of Immunology and cover the use of the “T cell qualitative assay” for vaccine evaluation. N.G. has filed patent protection for the use of dengue virus Tfh epitopes identified in the Indian population. D.W. is a consultant for Moderna. La Jolla Institute for Immunology has filed for patent protection for various aspects of T cell epitopes and vaccine design work. A.S. is a consultant for GritstoneBio, FlowPharma, Moderna, AstraZeneca, Qiagen, Fortress, Gilead, Sanofi, Merck, RiverVest, MedaCorp, Turnstone, NAVaccine Institute, Emervax, GersonLehrman, and Guggenheim.

Figures
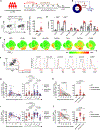
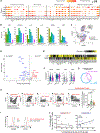
Figure 1.
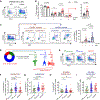
Figure 1.. Phenotypic analyses of activated CD4+ T cells in the blood of acute dengue
(A) Scheme depicting the time frame of blood sampling during acute and convalescent dengue. (B) Proportion of primary and secondary infections in the study cohort of acute dengue (DENV). (C) Representative intranuclear Ki67 staining of CD45RACD4+ T cells. A scatter dotplot shows the frequency of Ki67+ cells in healthy donors (HDs) (n = 13) and patients (n = 21). (D) Scatter barplot shows the frequency of Ki67-positive and Ki67-negative T cells with significant (p < 0.0001) differential expression. Data are presented as mean ± SEM. (E) t-SNE analysis showing the coexpression of the markers shown in (D) in equally concatenated CD45RACD4+ T cells from nine DENV samples. (F) Example fluorescence-activated cell sorting (FACS) plot showing the costaining of ICOS and Ki67 in CD45RACD4+ T cells, and histogram plots showing the geometric MFI of the markers in double-positive (red) and double-negative (black) cells. (G) Scatter dotplots displaying the frequency of activated (ICOS+Ki67+) CD4+ T cells at continuous and grouped time points from cross-sectional cohorts of primary (n = 56) and secondary (n = 86) dengue. (H) Longitudinal analysis of paired acute and convalescent samples (n = 24) showing the frequency of activated CD4+ T cells in comparison with that in HD samples (n = 18). (I and J) Scatter dotplots quantifying the frequency of PD-1-expressing cells among activated CD4+ T cells in (I) cross-sectional and (J) longitudinal paired acute and convalescent samples as shown in (G) and (H), respectively. Statistics: (C) Mann-Whitney test, (D) multiple t tests and correction by Holm-Sidak method, (G–J) Kruskal-Wallis test followed by Dunn’s multiple comparisons test, (H and J) Wilcoxon matched-pairs signed rank test. ns, not significant. Data are shown as median ± interquartile range (IQR). See also Figure S1.
Figure 2.
Figure 2.. Activated CXCR5PD-1+CD4+ T cells accumulate in patients with dengue with warning signs and severity
(A) Representative FACS plots showing the expression levels of CXCR5 and PD-1 on CD45RACD4+ T cells. (B) A scatter barplot was used to quantify the frequency of each indicated subset of CD45RACD4+ T cells in HD (n = 18) and acute dengue virus (n = 21) samples. Data are presented as mean ± SEM. (C) Representative FACS plots (left panels) and the frequency of activated (ICOS+Ki67+) T cells (right panel) within each of the four phenotypic subsets according to the expression of CXCR5 and PD-1. Data are shown as mean ± SEM. (D) Graphical view of disease categorization of acute dengue samples with different degrees of severity: dengue fever (DF) without warning signs (WS), DF with WS, and severe. The frequency of secondary dengue within each of the categories is shown. (E) Representative FACS plots showing the frequency of CXCR5+PD-1+ and CXCR5PD-1+CD4+ T cell subsets in DFs from patients without WS, DFs from patients with WS, and severe dengue (DENV) samples. (F and G) Scatter dotplots quantifying the frequency of (F) CXCR5+PD-1+ and (G) CXCR5PD-1+ subsets in DENV samples with worsening severity: DF without WS (n = 24), DF with WS (n = 66), and severe (n = 26). (H and I) Frequencies of activated cells within the two indicated subsets (H) CXCR5+PD-1+ and (I) CXCR5PD-1+, as shown in (F) and (G), respectively. Statistics: (B) multiple t tests followed by Holm-Sidak method; (C) Friedman test followed by Dunn’s multiple comparisons test; (F–I) Kruskal-Wallis test followed by Dunn’s multiple comparisons test. ns, not significant. Data are presented as median ± IQR. See also Figure S2.
Figure 3.
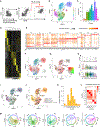
Figure 3.. Single-cell RNA-seq and TCR-seq analyses of activated CD4+ T cells from acute dengue revealed heterogeneity in the CXCR5PD-1+ population
(A) Example gating scheme for FACS sorting of live activated CD4+ T cells coexpressing ICOS and CD38 from acute dengue PBMCs. (B) Single-cell RNA-seq transcriptome of sorted ICOS+CD38+CD4+ T cells from patients (n = 3) with acute dengue. The plot shows the Seurat-based clustering of 4,361 cells displayed by UMAP. (C) Barplot showing the percentages of Seurat clusters. (D) Heatmap showing the average expression of the top significantly enriched genes in each cluster. The top enriched genes in each cluster versus all remaining cells were calculated by the Seurat FindAllMarkers function with an adjusted p value <0.05, a log2 fold change >0.25, and 25% as the minimum percentage of cells expressing DEGs. (E) Dotplot showing the percentage and average expression of the top ten genes enriched in each cluster. To avoid redundancy, histone genes (n = 80) enriched in cycling gene sets were excluded. (F) UMAP plot showing the cell-cycle phase annotation according to the Seurat function CellCycleScoring. (G) UMAP plot showing the combined expression of the CXCR5 (green) and PDCD1 (red) genes. (H) Violin plots showing the expression of the CXCR5, PDCD1, and CXCR3 genes in each cluster. (I) Single-cell trajectory analyzed by monocle3 showing the interconnection (black line) among cells in different clusters based on the gene enrichment in each cluster. (J) UMAP plot depicting cells of different clonal sizes: single, small, medium, large, and hyperexpanded. (K) Barplot showing the number of average cells per clonotype in each cluster. (L) Heatmap showing the percentage of overlapping clonotypes between two designated clusters in rows and columns. Only expanded clonotypes (clonal size >1) (n = 231) were included in the clonotype overlap analysis. (M) Circos plots showing the overlapping clonotypes between a cluster of interest and the remaining clusters shown as connecting lines between two arcs representing the two clusters. The length of the arc represents the number of unique expanded clonotypes in a given cluster. Vertical lines against each arc show the log10 scaled number of cells per unique clonotype. See also Figure S3.
Figure 4.
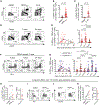
Figure 4.. CXCR5PD-1+ cells are present in the dengue-virus-specific memory CD4+ T cell pool and circulate persistently in the blood of dengue-recovered individuals
(A) FACS plots showing the surface staining of OX40 (CD134) and CD25 in CD45RACD4+ T cells from acute dengue in the vehicle control (DMSO), stimulation with DENV peptide megapool (DENVpep), or concanavalin A (ConA) for 18–20 h. (B and C) Frequency of OX40+CD25+ T cells among CD45RACD4+ T cells in acute dengue PBMCs stimulated with (B) DMSO or DENVpep (n = 44) or (C) DMSO or ConA (n = 16). (D) Representative plots depicting the frequency of DENV-specific T cells among CD45RACD4+ T cells in PBMC samples at 4, 7, and 34 days post symptom onset. (E) Frequency of background (DMSO)-subtracted DENV-specific CD45RACD4+ T cells at continuous and grouped time points (days post symptom onset) in cross-sectional DENV samples (n = 72). (F) Representative images of CXCR5 and PD-1 staining in DENV-specific CD45RACD4+ T cells after DENVpep stimulation. (G) Percentage of T cells from the CXCR5+PD-1+ (red circles) and CXCR5PD-1+ (blue squares) subsets from continuous and grouped time points (days post symptom onset) after subtraction from the DENV-specific background (DMSO), as shown in (E). (H) Frequency of OX40+CD25+ memory cells among CD45RACD4+ T cells stimulated with DMSO or DENVpep in seven long-term (~10 months) follow-up individuals. (I) Staining of CXCR5 and PD-1 in OX40+CD25+ DENV-specific memory (CD45RA) T cells as shown in (H). (J and K) (J) Example FACS plots and (K) frequency of CCR6CXCR3+ cells among OX40+CD25+ memory cells stimulated with DMSO or DENVpep. Statistics: (B, C, H, and K) paired t test; (E and G) Kruskal-Wallis test corrected using Dunn’s multiple comparisons test. ns, not significant. Data are presented as median ± IQR. See also Figure S4.
Figure 5.
Figure 5.. Activated CXCR5PD-1+CD4+ T cells are positively associated with antibody responses and plasmablasts in dengue
(A) Scatterplots showing the quantity (area under the curve [AUC]) of anti-NS1 IgG at continuous and grouped time points (days post symptom onset) from cross-sectional cohorts of primary (n = 62) and secondary (n = 92) dengue samples. (B) Longitudinal analysis of anti-NS1 IgG (AUC) in paired acute and convalescent dengue samples (n = 27) in comparison with DENV-seronegative HD samples. (C) ELISA OD curves of anti-NS1 IgG in serially diluted plasma samples from DF patients with WS (n = 70) and severe (n = 31) dengue. A scatterplot was generated to compare the quantity of the anti-NS1 antibody (AUC) between the two groups. (D) ELISA OD curves of DENV-specific structural protein (prM/M/E) IgG in DFs with WS (n = 29) and severe (n = 16) dengue samples. Scatterplot showing the levels of the anti-prM/M/E antibody (AUC) in the indicated groups. (E) DENV-neutralizing antibody titration curves in plasma of DFs with WS (n = 45) and severe (n = 10) dengue samples. Scatterplot shows the DENV-neutralization 50 (Neut50) titers in the indicated groups. (F) Representative FACS plots and scatter dotplot showing the frequency of plasmablasts (CD20CD38++) among CD27+ B cells in HDs (n = 11) and DENV-infected patients (DENV) (n = 25). (G) Scatter barplot showing the frequency of Ki67-, CD71-, and CXCR3-positive cells among naive and memory B cells and plasmablasts from acute dengue virus (DENV) samples. Data are shown as mean ± SEM. (H) Histogram plots showing the geometric MFI of CD27, CD19, Ki67, CD71, CXCR3, and SSC in naive (black), memory B (blue), and plasmablast (red) cells. (I) xy plots showing the correlations of the frequency of activated CXCR5+PD-1+ and CXCR5PD-1+ cells with the levels of anti-NS1 (n = 90), anti-prM/M/E (n = 40) DENV-IgG, DENV-Neut50 titer (n = 62), and plasmablast (n = 30) in acute samples. Statistics: (A and B) Kruskal-Wallis test followed by Dunn’s multiple comparisons test; (B) paired analysis by Wilcoxon signed rank test; (C–F) Mann-Whitney test; (G) two-way ANOVA with Tukey’s multiple comparisons test; (I) Pearson’s correlation test. ns, not significant. The dotted line in (A)–(E) represents the limit of positivity. Data are presented as median ± IQR. See also Figure S5.
Figure 6.
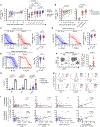
Figure 6.. DENV-specific CXCR5PD-1+CD4+ T cells are functionally potent and capable of driving plasmablast and antibody responses
(A) FACS plots showing the intracellular staining of CD40L and IFN-γ in CD45RACD4+ T cells from acute dengue stimulated with DMSO, PMA/ionomycin (PMA/iono), or DENVpep for 6 h. (B) Frequencies of CD40L+ and IFN-γ+ cells among CD45RACD4+ T cells. (C) Frequency of CD40L+IFN-γ+ cells among CD45RACD4+ T cells. Data are shown as median ± IQR. (D) FACS plots showing the costaining of CD40L, IFN-γ, and IL-10 with PD-1 and CXCR3 in CD4+ T cells stimulated with DENVpep. (E) Frequencies of CD40L+ and IFN-γ+ cells in the CXCR5+PD-1+ and CXCR5PD-1+ subsets stimulated with DENVpep and PMA/iono. (F) Plots showing the costaining of IFN-γ and IL-10 (left) and a barplot showing the frequency of IL-10+ cells in the DENVpep condition (right). (G) Representative FACS plots showing the frequency of plasmablasts (CD20CD38++) induced in autologous cocultures of different CD4+ T cell subsets and CD20+ B cells from DENV-seropositive individuals cultured for 9 days in DMSO and DENVpep conditions. (H) Number of plasmablasts in T:B cocultures in the presence of DENVpep, as shown in (G). (I) Barplots quantifying plasmablast differentiation in cocultures of the CXCR5PD-1+ T cell subset and naive (CD27) or memory (CD27+) CD20+ B cells. (J) Example plots showing the plasmablast frequency in T:B cocultures of CXCR5PD-1+ T cells and CD20+ B cells in the presence of DENVpep with or without blocking conditions with IL-21R-Fc, anti-IL-10, and anti-IL-4. Right: data in the scatter barplot are background subtracted from DMSO and normalized to the control (without blocking) condition. Statistics: (B and C) paired t test; (E and F) Wilcoxon signed-rank test; (H) one-way ANOVA with Tukey’s multiple comparisons test; (I) one-way ANOVA with Bonferroni’s multiple comparisons test; (J) one-way ANOVA with Dunnett’s multiple comparisons test. ns, not significant. Data are presented as mean ± SEM. See also Figure S6.
Figure 7.
Figure 7.. Distinct features and diverse clonotypes of the helper subset of CXCR5PD-1+ T cells and their strong association with the extrafollicular B cell response
(A) Dotplot showing the average expression and percentage of the indicated genes in the selected clusters. (B) Barplots showing the percentage of cells expressing IFNG, CD40LG, IL21, IL10, GZMB, and GNLY transcripts in the indicated clusters. (C) UMAP plot showing IFNG-positive cells expressing GZMB (GZMB+), IL21 (IL21+), or both (GZMB+IL21+). (D) Volcano plot showing the DEGs between the GZMB+ and IL21+ cell populations. Significant DEGs were calculated by Seurat FindMarkers function with adjusted p value <0.05, log2|fold change| >0.25, and 10% as minimum percentage of cells expressing DEGs. (E) Heatmap showing the comparative average expression of all DEGs enriched in IL21+ versus GZMB+ cells. (F) Violin plots showing the expression of the indicated genes in IL21+ and GZMB+ cells. (G) Circos plot showing the overlapping clonotypes (connecting lines) between the IL21+ and GZMB+ cell populations. The length of the arc represents the number of unique clonotypes in the designated group. The vertical lines against each arc indicate the log10 scaled clonotype size. (H) Representative FACS plots for phenotyping of extrafollicular (CD21CD11c+) cells among double-negative (IgDCD27) CD19+ B cells. The barplot shows the enrichment of the extrafollicular B cell phenotype in the indicated B cell subsets. Data are shown as mean ± SEM. (I) Histograms depicting the comparative expression (gMFI) of the surface markers CXCR5 and CD19 in extrafollicular B cells (red) and naive cells (black). (J) xy plots showing the correlations of the frequency of activated CXCR5+PD-1+ and CXCR5PD-1+ subsets with the frequency of extrafollicular B cells in patients (n = 20) with acute dengue. Statistics: (H) Friedman test followed by Dunn’s multiple comparisons test; (J) Pearson’s correlation test. ns, not significant. See also Figure S7.

References

    1. Bhatt S, Gething PW, Brady OJ, Messina JP, Farlow AW, Moyes CL, Drake JM, Brownstein JS, Hoen AG, Sankoh O, et al. (2013). The global distribution and burden of dengue. Nature 496, 504–507. 10.1038/nature12060. - DOI - PMC - PubMed
    1. Guzman MG, Halstead SB, Artsob H, Buchy P, Farrar J, Gubler DJ, Hunsperger E, Kroeger A, Margolis HS, Martίnez E, et al. (2010). Dengue: a continuing global threat. Nat. Rev. Microbiol. 8, S7–S16. 10.1038/nrmicro2460. - DOI - PMC - PubMed
    1. Halstead SB, Nimmannitya S, and Cohen SN (1970). Observations related to pathogenesis of dengue hemorrhagic fever. IV. Relation of disease severity to antibody response and virus recovered. Yale J. Biol. Med. 42, 311–328. - PMC - PubMed
    1. Halstead SB, Chow JS, and Marchette NJ (1973). Immunological enhancement of dengue virus replication. Nat. New Biol. 243, 24–26. - PubMed
    1. Sangkawibha N, Rojanasuphot S, Ahandrik S, Viriyapongse S, Jatanasen S, Salitul V, Phanthumachinda B, and Halstead SB (1984). Risk factors in dengue shock syndrome: a prospective epidemiologic study in Rayong, Thailand. I. The 1980 outbreak. Am. J. Epidemiol. 120, 653–669. 10.1093/oxfordjournals.aje.a113932. - DOI - PubMed