. 2025 Mar 12;15(1):8521.
doi: 10.1038/s41598-025-92972-z.

Identification and verification of biomarkers associated with arachidonic acid metabolism in non-alcoholic fatty liver disease

Affiliations

Identification and verification of biomarkers associated with arachidonic acid metabolism in non-alcoholic fatty liver disease

Jia Li et al. Sci Rep. .

Abstract

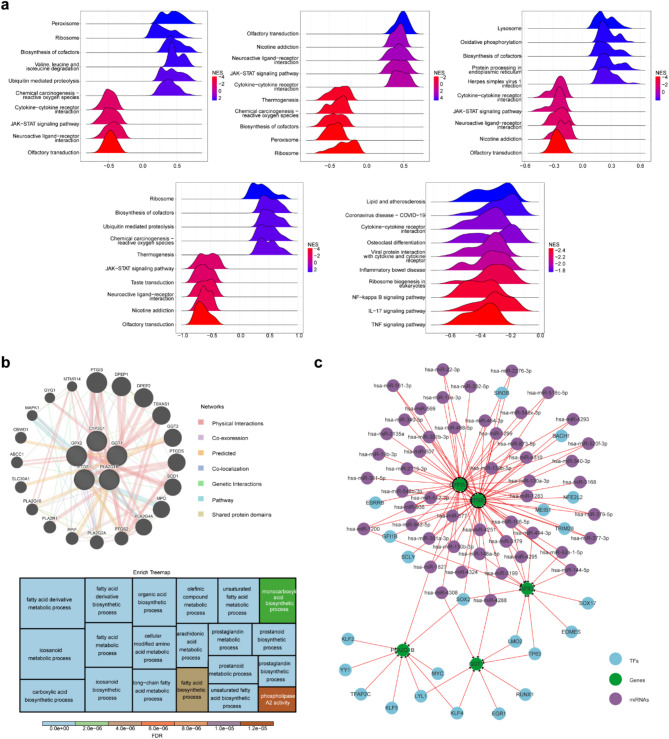
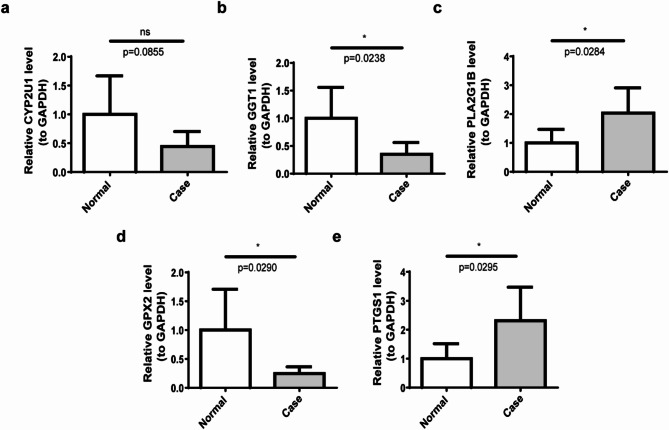
Elevated arachidonic acid metabolism (AAM) has been linked to the progression of non-alcoholic fatty liver disease (NAFLD). However, the specific role of AAM-related genes (AAMRGs) in NAFLD remains poorly understood. To investigate the involvement of AAMRGs in NAFLD, this study analyzed datasets GSE89632 and GSE135251 from the Gene Expression Omnibus (GEO) and Molecular Signatures Database (MSigDB). Differential expression analysis revealed 2256 differentially expressed genes (DEGs) between NAFLD and control liver tissues. Cross-referencing these DEGs with AAMRGs identified nine differentially expressed AAMRGs (DE-AAMRGs). Least absolute shrinkage and selection operator (LASSO) and univariate logistic regression analyses pinpointed five biomarkers-CYP2U1, GGT1, PLA2G1B, GPX2, and PTGS1-demonstrating significant diagnostic potential for NAFLD, as validated by receiver operating characteristic (ROC) analysis. These biomarkers were implicated in pathways related to AAM and arachidonate transport. An upstream regulatory network, involving transcription factors (TFs) and MicroRNAs (miRNAs), was constructed to explore the regulatory mechanisms of these biomarkers. In vivo validation using a NAFLD mouse model revealed liver histopathological changes, and quantitative reverse transcription polymerase chain reaction (qRT-PCR) and western blot (WB) analyses confirmed the upregulation of biomarker expression, particularly PTGS1, in NAFLD. The bioinformatic analysis identified five AAM-related biomarkers, enhancing the understanding of NAFLD pathogenesis and offering potential diagnostic targets.

Keywords: Arachidonic acid metabolism; Bioinformatic; GEO; Non-alcoholic fatty liver disease.


Conflict of interest statement

Declarations. Competing interests: The authors declare no competing interests.

Figures

Fig. 1
Fig. 1
Identification of DEGs and DE-AAMRGs. (a-1) Heatmap of expression of downregulated Top10 differentially expressed genes on NAFLD and CTL samples. Gradually higher expression with blue to red colour. (a-2) Volcano plot of differentially expressed genes between NAFLD and CTL samples. Red dots represent upregulated genes, blue dots represent downregulated genes, and grey dots represent genes with no significant difference or small fold changes. The figure is labelled for up- and down-regulation of each of the Top10 genes. (b) Venn diagram of DEGs and DE-AAMRGs. (c-1) GO-BP enrichment treemap for DE-AAMRGs. (c-2) GO-CC enrichment treemap for DE-AAMRGs. (c-3) GO-MF enrichment treemap for DE-AAMRGs. (d) KEGG pathway enrichment treemap of DE-AAMRGs. (e) PPI network of DE-AAMRG.
Fig. 2
Fig. 2
Performance of five key biomarkers (CYP2U1, GGT1, PLA2G1B, GPX2, PTGS1) in the diagnosis of NAFLD. (a-1,2) LASSO regression analysis to screen for signature genes. (b) Logistic regression forest plot for key genes. (c-1) Scatter box plot of key gene expression in GSE89632. (c-2) Scatter box plot of key gene expression in GSE135251. (d) ROC curve for key genes in GSE89632. (e) ROC curve for key genes in GSE135251. (f-1) Key gene correlations in all samples in GSE89632. (f-2) Key gene correlations in CTL samples in GSE89632. (f-3) Key gene correlations in NAFLD samples in GSE89632.
Fig. 3
Fig. 3
Correlation of biomarkers with arachidonic acid metabolic pathways. (a) Enrichment ridge map of KEGG for key genes. (b-1) Co-expression network of key genes. (b-2) Treemap of key gene co-expression network functions. (c) TF-miRNA-gene regulatory network of key genes.
Fig. 4
Fig. 4
Expression validation of five biomarkers. (a) Expression analysis of CYP2U1 in the case and normal groups. (b) Expression analysis of GGT1 in the case and normal groups. (c) Expression analysis of PLA2G1B in the case and normal groups. (d) Expression analysis of GPX2 in the case and normal groups. (e) Expression analysis of PTGS1 in the case and normal groups. ns: no significance; *: p < 0.05.
Fig. 5
Fig. 5
Five biomarkers in mice in the control and NAFLD groups in protein level. ***: p < 0.001; ****: p < 0.0001.
Fig. 6
Fig. 6
The NAFLD mouse liver exhibits significant fat infiltration, inflammatory cell infiltration, and collagen deposition. (a) Liver weight growth curves of mice in control and NAFLD groups. (b) Differences in liver weight between control and NAFLD mice. *: p < 0.05. (c) Comparison of liver conditions in control and NAFLD mice. (d) Results of lipid analysis in control and NAFLD groups. *: p < 0.05. (e) HE staining results of liver cells in mice from the control group and the NAFLD group. (f) Oil Red O staining results of liver cells in mice from the control group and the experimental group. ***: p < 0.001. (g) Changes in collagen fibres in liver tissue were detected using Masson staining.

References

    1. Fan, J. G. et al. Guidelines for the diagnosis and management of nonalcoholic fatty liver disease: Update 2010: (Published in Chinese on Chinese Journal of Hepatology 2010; 18:163–166). J. Dig. Dis.12, 38–44 (2011). - PubMed
    1. Buzzetti, E., Pinzani, M. & Tsochatzis, E. A. The multiple-hit pathogenesis of non-alcoholic fatty liver disease (NAFLD). Metabolism65, 1038–1048 (2016). - PubMed
    1. Chalasani, N. et al. The diagnosis and management of non-alcoholic fatty liver disease: Practice guideline by the American association for the study of liver diseases, American college of gastroenterology, and the American gastroenterological association. Hepatology55, 2005–2023 (2012). - PubMed
    1. Clark, J. M. The epidemiology of nonalcoholic fatty liver disease in adults. J. Clin. Gastroenterol.40(Suppl 1), S5-10 (2006). - PubMed
    1. Powell, E. E., Wong, V. W. & Rinella, M. Non-alcoholic fatty liver disease. Lancet397, 2212–2224 (2021). - PubMed