. 2025 Apr;640(8059):752-761.
doi: 10.1038/s41586-025-08677-w. Epub 2025 Mar 12.

Hepatic stellate cells control liver zonation, size and functions via R-spondin 3

Affiliations

Hepatic stellate cells control liver zonation, size and functions via R-spondin 3

Atsushi Sugimoto et al. Nature. 2025 Apr.

Abstract

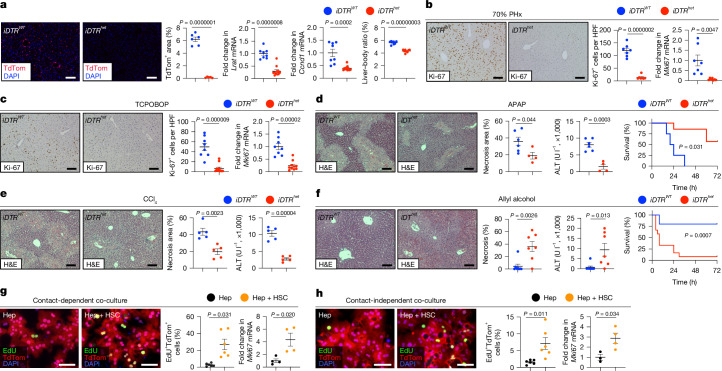
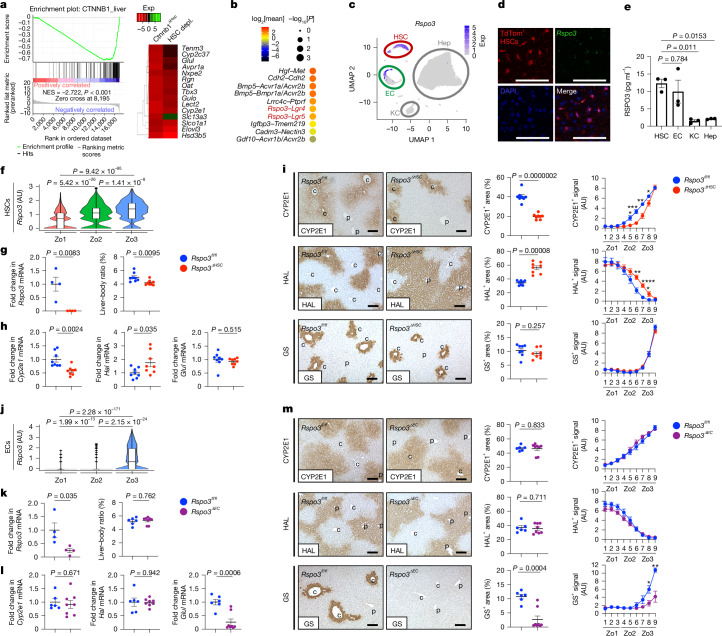
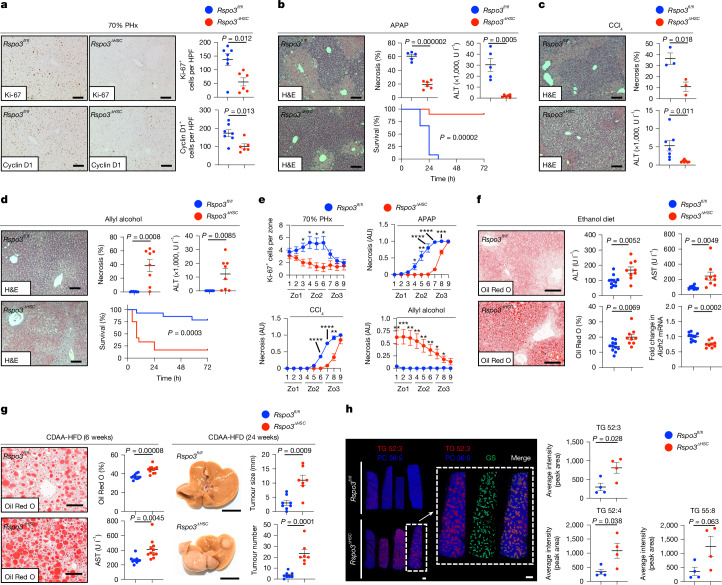
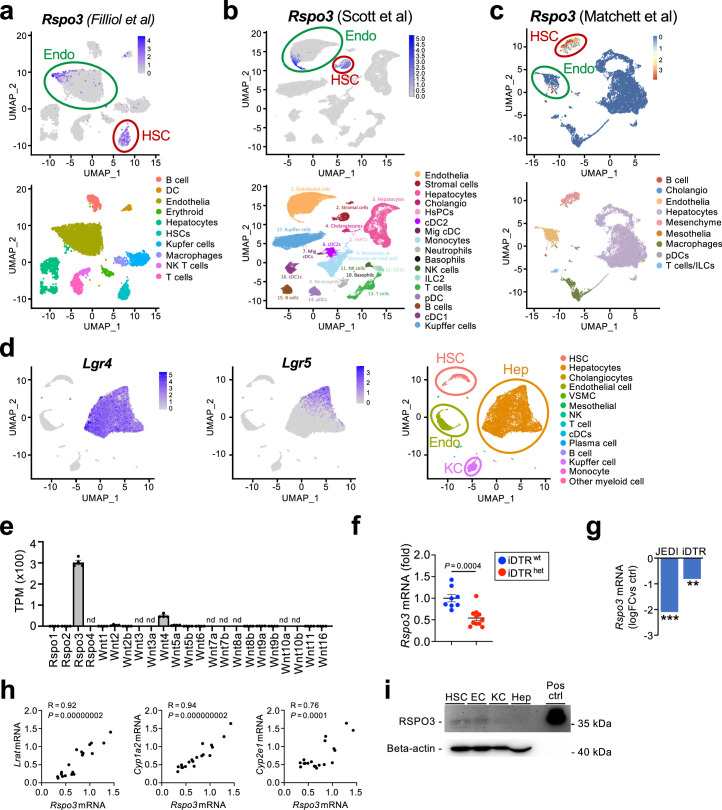
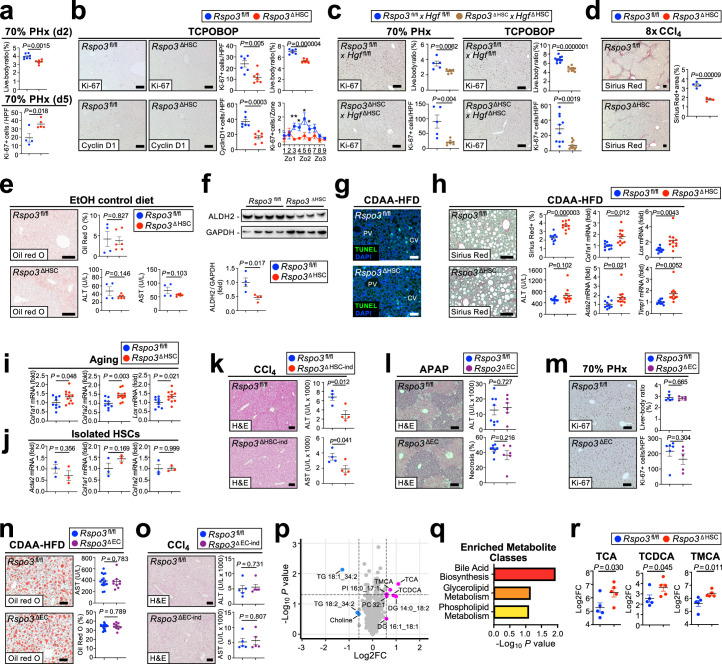
Hepatic stellate cells (HSCs) have a central pathogenetic role in the development of liver fibrosis. However, their fibrosis-independent and homeostatic functions remain poorly understood1-5. Here we demonstrate that genetic depletion of HSCs changes WNT activity and zonation of hepatocytes, leading to marked alterations in liver regeneration, cytochrome P450 metabolism and injury. We identify R-spondin 3 (RSPO3), an HSC-enriched modulator of WNT signalling, as responsible for these hepatocyte-regulatory effects of HSCs. HSC-selective deletion of Rspo3 phenocopies the effects of HSC depletion on hepatocyte gene expression, zonation, liver size, regeneration and cytochrome P450-mediated detoxification, and exacerbates alcohol-associated and metabolic dysfunction-associated steatotic liver disease. RSPO3 expression decreases with HSC activation and is inversely associated with outcomes in patients with alcohol-associated and metabolic dysfunction-associated steatotic liver disease. These protective and hepatocyte-regulating functions of HSCs via RSPO3 resemble the R-spondin-expressing stromal niche in other organs and should be integrated into current therapeutic concepts.


Conflict of interest statement

Competing interests: J.A.F. serves as a consultant or advisory board member for Resolution Therapeutics, Kynos Therapeutics, Ipsen, River 2 Renal, Stimuliver and Global Clinical Trial Partners, and has received research grant funding from Intercept Pharmaceuticals and Genentech. F.T. has received research support from AstraZeneca, MSD and Gilead Consulting, and honoraria for lectures from Novo Nordisk, AstraZeneca, Gilead, Abbvie, Alnylam, BMS, Intercept, Falk, Inventiva, MSD, Pfizer, Novartis, Merz, Sanofi and GSK. B.R.S. is listed as an inventor on patents and patent applications involving small-molecule drug discovery, ferroptosis and immunostaining; holds equity in Sonata Therapeutics; co-founded and serves as a consultant to Exarta Therapeutics and ProJenX; and serves as a consultant to Weatherwax Biotechnologies Corporation and Akin Gump Strauss Hauer & Feld. S.P.M. has received research funding from Alnylam, Fog Pharmaceuticals and serves as a consultant or on the scientific advisory board of Alnylam, Genentech, Surrozen, Vicero, Mermaid Bio, Antlera and UbiquiTx. R.F.S. has received research funding from Takeda via the Takeda-Columbia-NYU alliance. The other authors declare no competing interests.

Figures

Fig. 1
Fig. 1. HSCs regulate liver regeneration and injury.
a, Lrat-cre+TdTom+ mice expressing iDTR (iDTRhet) or not (iDTRWT) were injected with diphtheria toxin (DT). The TdTom+ area (n = 6 (iDTRWT) and n = 5 (iDTRhet)), Lrat and Ccnd1 mRNA (by qPCR, n = 8 (iDTRWT) and n = 11 (iDTRhet)) and the liver–body weight ratio (n = 8 (iDTRWT) and n = 8 (iDTRhet)) were determined 7 days later. b,c, iDTRWT and iDTRhet mice were treated with DT and, 1 week later, were subjected to 70% PHx (n = 7 per group) (b) or treatment with constitutive androstane receptor agonist (c), followed by Ki-67 IHC and quantification per high-power field (HPF) (n = 8 (iDTRWT) and n = 11 (iDTRhet)) as well as qPCR analysis of Mki67 (n = 8 (iDTRWT) and n = 10 (iDTRhet)). d, iDTRWT and iDTRhet mice were treated with DT. Then, 1 week later, the mice were subjected to treatment with a sublethal dose of APAP to determine the serum ALT and necrosis area in haematoxylin and eosin (H&E) sections (n = 6 (iDTRWT) and n = 4 (iDTRhet)), or with a lethal APAP dose to determine survival (n = 4 (iDTRWT) and n = 7 (iDTRhet)). e,f, iDTRWT and iDTRhet mice (n = 5 per group) were treated with DT and 1 week later were then treated with CCl4 (e; 0.5 mg per kg, n = 5 per group) or allyl alcohol (f; 60 mg per kg) to determine the serum ALT and necrosis area in H&E sections (n = 8 (iDTRWT) and n = 7 (iDTRhet)) or a lethal dose of allyl alcohol (f; 75 mg per kg; n = 10 (iDTRWT) and n = 12 (iDTRhet)) to determine survival. g,h, Primary mouse hepatocytes (Hep) were co-cultured with or without primary mouse HSCs in a contact-dependent (g; EdU, n = 6 per group; Mki67 mRNA, n = 4 per group) or contact-independent (h; EdU, n = 6 per group; qPCR, n = 3 (hepatocytes), n = 4 (hepatocytes + HSCs)) manner to determine proliferation based on EdU staining and qPCR analysis of Mki67 mRNA. Data are mean ± s.e.m. For ah, each dot represents one biological replicate. Scale bars, 100 µm (ah). P values were calculated using unpaired two-tailed t-tests (ac, e, g and h, and d and f (middle and left)) or log-rank test (d and f (right)). Source data
Fig. 2
Fig. 2. HSCs regulate metabolic zonation and zone-specific injury and proliferation in the liver.
a,b, The top 40 genes downregulated in RNA-seq data from HSC-depleted mice versus controls (ctrl) in the iDTR × Lrat-cre and the JEDI models versus controls after subtraction of HSC-enriched genes (a), and qPCR confirmation in iDTRWT (n = 8) and iDTRhet (n = 11) mice (b) of select genes in livers from the iDTR × Lrat-cre model. c, CYP2E1, CYP1A2 and CYP2F2 IHC and quantification in iDTRWT (n = 8) and iDTRhet (n = 8) mice 7 days after treatment with diphtheria toxin. c, central vein; p, portal vein. d, Multiplex IHC analysis showing significantly altered expression of zonal genes in iDTRWT (n = 5) and iDTRhet (n = 5) mice. e, Zonal quantification of the indicated zone 1 (Zo1), zones 2–3 and strictly zone 3 markers from IHC performed in Fig. 2c and Extended Data Fig. 4g in iDTRWT and iDTRhet mice (n = 8 per group). f, 100-plex spatial transcriptomics for WNT-regulatory, WNT-target and cell marker genes shows differences in zonation patterns and WNT-target genes between iDTRWT (n = 1) versus iDTRhet (n = 1) mice. g,h, Zonal quantification of Ki-67+ cells after 70% PHx and TCPOBOP treatment (g) or of necrosis after APAP, CCl4 or allyl alcohol treatment (h) in iDTRWT (n = 5–8) and iDTRhet (n = 4–11) mice. Data are mean ± s.e.m. For b and c, each dot represents one biological replicate. Scale bars, 100 µm (c and d) and 1 mm (f). P values were calculated using unpaired two-tailed t-tests (b, c, e, g and h). *P < 0.05, **P < 0.01, ***P < 0.001, ****P < 0.0001. AU, arbitrary units. Source data
Fig. 3
Fig. 3. HSC-derived RSPO3 regulates hepatocyte gene expression and liver zonation.
a, GSEA of CTNNB1-regulated genes from RNA-seq data of HSC-depleted (JEDI) versus control livers; and a heat map showing the expression (Exp) of the top 15 downregulated genes from Ctnnb1ΔHep versus Ctnnb1fl/fl livers in HSC-depleted versus control livers. b, CellPhoneDB analysis showing the top HSC–hepatocyte ligand–receptor interactions in healthy mouse liver snRNA-seq data. n = 2 livers. c, snRNA-seq analysis of Rspo3 expression in healthy mouse liver. n = 2. d, RNAscope analysis of Rspo3 colocalization with TdTom+ HSCs in Lrat-cre × TdTom livers. A representative image of two technical replicates is shown. e, RSPO3 ELISA in the supernatants from primary mouse HSCs, ECs, Kupffer cells (KCs) and hepatocytes. n = 3 per group. f, Analysis of Rspo3 expression in HSCs across mouse liver zones using 100-plex spatial transcriptomics data. g, The liver–body weight ratio and qPCR analysis of Rspo3 mRNA (n = 4 per group) in HSCs from Rspo3fl/fl (n = 8) and Rspo3ΔHSC (n = 8, 7 male, 1 female) mice. h,i, The indicated WNT-target genes determined by qPCR (h) or IHC with morphometric and zone-specific quantification (i) in Rspo3fl/fl (n = 8) and Rspo3ΔHSC (n = 8, 7 male, 1 female) livers. j, Analysis of Rspo3 expression in ECs across mouse liver zones using 100-plex spatial transcriptomics data. k, Rspo3 mRNA in isolated ECs (n = 4 per group), and the liver–body weight ratio in Rspo3fl/fl (n = 6) and Rspo3ΔEC (n = 8) mice. l,m, WNT-target genes determined by qPCR (l), and IHC analysis with morphometric and zone-specific quantification (m) in Rspo3fl/fl (n = 6) and Rspo3ΔEC (n = 8) livers. Data are mean ± s.e.m. Each dot represents one cell (c) or one biological replicate (gi and km). For d, i and m, scale bars, 100 µm. For the violin plots in f and j, the box plots show the interquartile range (IQR; Q1–Q3) (box limits), the median (centre line), and the minimum (Q1 − 1.5 × IQR) and maximum (Q3 + 1.5 × IQR) values (whiskers). P values were calculated using unpaired two-tailed t-tests (e, gi and km) or Wilcoxon rank-sum tests (f and j). UMAP, uniform manifold approximation and projection. Source data
Fig. 4
Fig. 4. HSC-derived RSPO3 regulates hepatocyte injury, liver regeneration and steatosis.
a, Ki-67 and cyclin D1 IHC from Rspo3fl/fl (n = 7) and Rspo3ΔHSC (n = 6) mice subjected to 70% PHx. bd, The necrosis area (n = 5 (Rspo3fl/fl), n = 6 (Rspo3ΔHSC)), ALT levels (n = 5 (Rspo3fl/fl), n = 6 (Rspo3ΔHSC)) and survival (n = 12 (Rspo3fl/fl), n = 10 (Rspo3ΔHSC)) in Rspo3fl/fl and Rspo3ΔHSC mice treated with APAP (b; 300 mg per kg or 750 mg per kg lethal dose); the necrosis area (n = 3 per group) and ALT levels (n = 7 per group) in Rspo3fl/fl and Rspo3ΔHSC mice treated with CCl4 (c, 0.5 ml kg−1); and the necrosis area (n = 8 per group), ALT levels (n = 8 per group) and survival (n = 14 (Rspo3fl/fl), n = 12 (Rspo3ΔHSC)) in Rspo3fl/fl and Rspo3ΔHSC mice treated with allyl alcohol (d; 60 mg per kg or 75 mg per kg lethal dose). e, Zonal quantification of Ki-67+ cells (n = 7 (Rspo3fl/fl), n = 6 (Rspo3ΔHSC)) and necrosis in APAP (n = 5 (Rspo3fl/fl), n = 6 (Rspo3ΔHSC)), CCl4 (n = 3 per group) and allyl alcohol (n = 8 per group) models in Rspo3fl/fl and Rspo3ΔHSC mice. f, Oil Red O staining and quantification, serum ALT and AST, and qPCR analysis of Aldh2 mRNA in Rspo3fl/fl (n = 11) and Rspo3ΔHSC (n = 9) mice treated with the Lieber–DeCarli diet. g, Oil Red O staining and quantification, the serum ALT and AST (n = 10 (Rspo3fl/fl), n = 11 (Rspo3ΔHSC)), representative images and the tumour number and tumour size in Rspo3fl/fl (n = 8) and Rspo3ΔHSC mice (n = 7) that were treated with CDAA-HFD diet for the indicated times. h, DESI–MS imaging showing triglycerides (TG; 52:3, red) and phosphatidylcholine (PC; 36:5, blue) in Rspo3fl/fl and Rspo3ΔHSC (n = 4 per group) mice as well as a representative for localization of TG 52:3 around pericentral zones marked by GS (green) and quantification of TG 52:3, TG 52:4 and TG 55:8 species. Data are mean ± s.e.m. Each dot represents one biological replicate (ad and fh). Scale bars, 100 µm (ad, f and g), 1 cm (h, left), 1 mm (h, right). P values were calculated using unpaired two-tailed t-tests (a, c and eh, and b and d (top)) or log-rank tests (b and d (bottom)). Source data
Fig. 5
Fig. 5. Dynamic regulation of RSPO3 in liver disease.
a,b, scRNA-seq analysis of Rspo3 mRNA of HSCs from CCl4-treated (a) or high-fat high-fructose diet (HF-HFD)-treated (b) mice. c, scRNA-seq analysis of Rspo3 mRNA from quiescent (qHSC), intermediate-active (imHSC), activated (actHSC) and deactivated (deactHSC) mouse HSCs (from ref. ). d, qPCR analysis of Rspo3 in quiescent mouse HSCs treated with the indicated cytokines. n = 4 per group. e, snRNA-seq analysis of RSPO3 mRNA expression (Exp) in human liver. n = 6. f, CellPhoneDB analysis showing the top HSC–hepatocyte interactions in snRNA-seq data from human livers. g, snRNA-seq analysis of RSPO3 mRNA in human cyHSCs and myHSCs. h, qPCR analysis of RSPO3 in PDGF- and TGFβ-treated LX-2 human HSCs. n = 3 per group (control and PDGF) and n = 4 (TGFβ). i, snRNA-seq analysis of RSPO3 mRNA in HSCs from healthy control individuals (Ctrl) and patients with MASLD, alcoholic cirrhosis (Alc. cirrh.) or alcoholic hepatitis (Alc. hep.). Data are mean ± 95% confidence intervals. j, RSPO3 mRNA in different stages of MASLD and correlation with the WNT-target genes CYP2E1, CYP1A2 and TBX3 in the GSE135251 cohort. k, The correlation between HSC RSPO3 and hepatocyte CYP1A2 and CYP2E1 expression in snRNA-seq data of healthy individuals and patients with MASLD and ALD (n = 25). l, RSPO3 mRNA in different stages of ALD and survival stratified by RSPO3 expression in the dbGaP phs001807.v1.p1 ALD cohort. Non.-sev., non-severe; TPM, transcripts per million. m, Survival by RSPO3 expression in the SteatoSITE MASLD cohort. Data are mean ± s.e.m. Each dot represents one cell (ac) or one biological replicate (d and h). ****P < 0.0001 versus control or normal; ###P < 0.001 versus F0–1. In the violin plots, the box plots show the IQR (box limits), the median (centre line), the minimum (Q1 − 1.5 × IQR) and maximum (Q3 + 1.5 × IQR) values (whiskers), and outliers (individual dots). P values were calculated using two-way analysis of variance (ANOVA) with Tukey’s multiple-comparison test (ac, i and l (left)), one-way ANOVA with Dunnett’s multiple-comparison test (d and h), Wilcoxon rank-sum tests (j) or log-rank tests (l (right) and m). Correlations were evaluated by the Pearson correlation coefficient (j and k). MASH, metabolic dysfunction-associated steatohepatitis. Source data
Extended Data Fig. 1
Extended Data Fig. 1. Characterization of iDTR x LratCre-mediated HSC depletion.
a-b. qPCR for HSC marker Colec11 (a) or inflammatory genes (b) in HSC-depleted iDTRhet (n = 11) and control iDTRwt (n = 8) mice. c. Representative TdTom images and qPCR for Lrat in various organs of iDTRwt and iDTRhet mice (n = 7/group). d. Hepatocyte size, determined by co-staining for HNF4a and E-cadherin in iDTRwt and iDTRhet mice (n = 5/group). e. Liver-body weight ratio, qPCR for hepatic Ccnd1 mRNA, serum ALT and Cyclin D1 IHC in iDTRhet and iDTRwt mice (n = 7/group) 48 h after 70% PHx (related to Fig. 1b). f. Liver-body weight ratio and quantification of Ki-67+ cells at day 5 (n = 5/group), day 7 (n = 5/group) and day 14 (iDTRwt n = 8, iDTRhet n = 7) after 70% PHx as well as determination of HSC depletion efficiency by quantification of TdTom+ HSC at day 0 and day 14 after PHx in iDTRwt (n = 5) and iDTRhet (n = 6) mice. g. Liver-body weight ratio, qPCR for hepatic Ccnd1 mRNA, serum ALT, and Cyclin D1 IHC in iDTRwt (n = 8) and iDTRhet mice (n = 11) 48 h after TCPOBOP (3 mg/kg) treatment (related to Fig. 1c). h. Liver-body weight ratio and Ki-67+ cells in iDTRwt and iDTRhet mice at day 5 (n = 5/group), day 9 (iDTRwt n = 6, iDTRhet n = 4) and day 14 (iDTRwt n = 4, iDTRhet n = 5) after TCPOBOP (3 mg/kg) treatment. i. iDTRwt and iDTRhet mice were subjected to 70% PHx, injected with DT 1 h later and euthanized 48 h (iDTRwt n = 6, iDTRhet n = 7) or 72 h (iDTRwt n = 7, iDTRhet n = 8) after 70% PHx to determine HSC depletion and proliferation by qPCR and Ki-67 IHC. Data are shown as mean ± s.e.m. Each dot represents one biological replicate (a-i). Scale bars 100 µm (c-g,i). P-values were calculated using unpaired two-tailed t-tests (a-i). Source data
Extended Data Fig. 2
Extended Data Fig. 2. Effects of Col1a1, Tgfbr1 and Pdgfrb deletion on liver regeneration.
a. qPCR for Col1a1 livers from Col1a1 fl/fl (n = 3) and Col1a1 Δliver mice (n = 3). b-c. Representative images Ki-67 IHC as well as quantification and determination of the liver-body weight ratio in Col1a1 fl/fl and Col1a1 Δliver mice (b, n = 5/group) or in Col1a1 fl/fl and Col1a1 ΔHSC mice (c, n = 6/group) 48 h after 70% PHx. d. qPCR for Tgfrb1 in HSCs isolated from Tgfrb1 fl/fl (n = 4) and Tgfrb1 ΔHSC mice (n = 3). e. Representative images Ki-67 IHC as well as quantification and determination of the liver-body weight ratio in Tgfrb1 fl/fl (n = 5) and Tgfrb1 ΔHSC mice (n = 7) 48 h after 70% PHx. f. qPCR for Pdgfrb in HSCs isolated from Pdgfrb fl/fl (n = 2) and Pdgfrb ΔHSC mice (n = 3). g. Representative images Ki-67 IHC as well as quantification and determination of the liver-body weight ratio in Pdgfrb fl/fl (n = 5) and Pdgfrb ΔHSC mice (n = 8) 48 h after 70% PHx or in Pdgfrb fl/fl (n = 8) and Pdgfrb ΔHSC mice (n = 5) 72 h after PHx. Data are shown as mean ± s.e.m. Each dot represents one biological replicate (a-g). Scale bars, 100 µm (b,c,e,g). P-values were calculated using unpaired two-tailed t-tests (a-e,g). Source data
Extended Data Fig. 3
Extended Data Fig. 3. Differentially expressed genes and their enrichment in HSC-depleted mice.
a-b. Heatmap showing the top 40 genes with the strongest combined downregulated in RNA-seq from livers of iDTR- and JEDI HSC-depleted mice vs their respective non-depleted controls (a) and UMAPs of genes from panel A showing expression in different cell populations in scRNA-seq from mouse liver (b). HSC-enriched genes in purple (30 out of 40 genes), hepatocyte-enriched genes in green (5 out 40 genes), non-enriched genes in black (5 out of 40 genes).
Extended Data Fig. 4
Extended Data Fig. 4. Pathway activation and zonation in HSC-depleted mice.
a. KEGG pathway analysis using the top 100 non-HSC genes (<3 logFC HSC enriched) with strongest combined downregulation in RNA-seq from JEDI and iDTR HSC-depleted livers. b. qPCR of indicated genes in iDTR HSC-depleted livers (n = 11) vs controls (n = 8). c. UMAPs for genes with important hepatocyte functions (related to Fig. 2b) in scRNA-seq from mouse liver. d. Cyp2e1 activity in livers from HSC-depleted (iDTR) and control mice (n = 6/group). e. IHC, morphometric quantification and qPCR as well as zonal quantification (for RGN only – for zonal quantification of HAL, GS and OAT, see Fig. 2e) for pericentral to midzonal marker RGN, periportal markers HAL, and strictly pericentral markers GS and OAT in livers from iDTRwt (n = 8) and iDTRhet mice (n = 11) f. 100 plex spatial transcriptomics showing the indicated zonal genes in iDTRwt and iDTRhet mice (n = 1/group) g. Representative images and quantification of CYP2E1 and CYP1A2 IHC in HSC JEDI-depleted livers (n = 4) vs controls (n = 5). h-i. GSEA (h) of liver CTNNB1-regulated genes from RNA-seq of HSC-depleted (iDTR) vs control livers and heatmap (i) of the top 15 genes downregulated in Ctnnb1ΔHep mice vs Ctnnb1fl/fl controls alongside expression of the same genes in HSC-depleted (iDTR) vs control livers. Data are shown as mean ± s.e.m. Each dot represents one biological replicate (b,d,e,g). Scale bars, 100 µm (e,g). P-values were calculated using unpaired two-tailed t-tests (b,d,e,g). Source data
Extended Data Fig. 5
Extended Data Fig. 5. HSC-selective Wntless deletion does not alter liver zonation, injury and regeneration.
a. Heatmap of RNA-seq data comparing Wnt gene expression between isolated mouse HSCs and whole liver (left) and Wnt4 and Wnt5a expression in scRNA-seq from whole mouse liver. b. Wls deletion in HSCs isolated from LratCre+ Wls ΔHSC (n = 3) and LratCre- Wls fl/fl (n = 3) mice, as determined by qPCR. c. Liver-body weight ratio in LratCre+ Wls ΔHSC (n = 4) and LratCre- Wls fl/fl (n = 4) mice. d-e. CYP2E1 IHC (d) and CYP1A2 IHC (e) and quantification for Wls fl/fl (n = 10) and Wls ΔHSC (n = 11) mice f. qPCRs for Wnt target genes Cyp2e1, Cyp1a2, Lect2 and Axin2 in livers from Wls fl/fl (n = 9) and Wls ΔHSC (n = 11) mice. g. Liver injury induced by APAP (300 mg/kg) was determined by ALT measurement and quantification of the necrosis area 24 h after APAP injection in LratCre+ Wls ΔHSC (n = 7) and LratCre- Wls fl/fl (n = 6) mice. Data are shown as mean ± s.e.m. Each dot represents one biological replicate (b-g). Scale bars, 100 µm (d,e,g). P-values were calculated using unpaired two-tailed t-tests (b-g). Source data
Extended Data Fig. 6
Extended Data Fig. 6. R-spondin3 expression in the liver.
a-c. UMAPs of Rspo3 in healthy mouse livers from the indicated sc/snRNA-seq datasets. d. UMAPs of Lgr4 and Lgr5 in snRNA-seq from healthy mouse livers (n = 2). e. RNA-seq of isolated mouse HSCs showing TPM values for secreted Wnt pathway regulators (n = 4/group). f. PCR of Rspo3 mRNA in livers from HSC-depleted iDTRhet (n = 11) and control iDTRwt (n = 8) mice. g. Rspo3 mRNA expression from bulk RNA-seq in livers with HSCs depleted by the iDTR or JEDI method, compared to control mice. h. Correlation of Rspo3 mRNA with Lrat, Cyp1a2 and Cyp2e1 mRNA in HSC-depleted mice. i. Western blot for RSPO3 using lysates from freshly isolated mouse HSCs, ECs, Kupffer cells (KCs) and hepatocytes (Hep) and rmRSPO3 as positive control (representative image of 2 technical replicates). nd, not detected ** P < 0.01 vs ctrl, *** P < 0.001 vs ctrl. Data are shown as mean ± s.e.m. Each dot represents one biological replicate (f,h). P-values were calculated using unpaired two-tailed t-tests (f) and Wilcoxon rank-sum test (g). Correlations were evaluated by pearson correlation coefficient (h). Source data
Extended Data Fig. 7
Extended Data Fig. 7. R-spondin3 promotes hepatocyte proliferation and rescues HSC-depleted livers.
a. qPCR (n = 4/group) for indicated genes and WST-1 assay (n = 3/group) in AML12 hepatocytes treated with the indicated concentrations of Rspo3 for 24 h (qPCR) or 48 h (WST-1 assay). b. Effect of HSC co-culture on hepatocyte proliferation in the absence or presence of Rspo3-blocking antibody rosmantuzumab or control antibody. c. Schematic diagram showing AAV8-CMV-GFP or AAV8-CMV-Rspo3 rescue experiments in HSC-depleted mice followed by 70% PHx or treatment with APAP (300 mg/kg). d. Rspo3 mRNA was determined by qPCR in non-depleted control livers and liver from HSC-depleted iDTR mice after treatment with AAV8-CMV-GFP (iDTRwt n = 4, iDTRhet n = 3) or AAV8-CMV-Rspo3 (n = 4). e. Proliferation was determined 48 h after 70% PHx by Ki-67 IHC in livers from AAV8-CMV-GFP-treated WT (n = 4) and iDTRhet (n = 3) and in AAV8-CMV-Rspo3 treated iDTRhet mice (n = 4). f. Liver injury was determined by serum ALT and necrosis quantification in H&E liver sections 24 h after APAP treatment in AAV8-CMV-GFP-treated WT (n = 8) and iDTRhet (n = 7) and in AAV8-CMV-Rspo3 treated iDTRhet mice (n = 7). nd ** P < 0.01 vs ctrl, *** P < 0.001 vs ctrl. Data are shown as mean ± s.e.m. Each dot represents one biological replicate (a,b,d-f). Scale bars 100 µm (b,e,f). P-values were calculated using unpaired two-tailed t-tests (a-d). Source data
Extended Data Fig. 8
Extended Data Fig. 8. Characterization of mice with HSC-, EC-, hepatocyte and KC-specific Rspo3 deletion.
a. qPCR for the indicated genes in livers from Rspo3 fl/fl (n = 8) and Rspo3 ΔHSC (n = 8, 7 male, 1 female) mice. b. IHC, morphometric quantification and qPCR for the indicated zonation markers in Rspo3 fl/fl and Rspo3 ΔHSC mice (n = 8/group). c. Zonal quantification based on IHC from b (n = 8). d. Wnt-focused 100plex spatial transcriptomics and cluster-based zonal quantification in Rspo3 fl/fl (n = 1) and Rspo3 ΔHSC (n = 1) mice. e-f. qPCR for Rspo3, Wnt2 and Wnt9b in ECs from Rspo3 ΔHSC (n = 4) (e) and Rspo3 ΔHSC-ind (n = 5) (f) mice or Rspo3 fl/fl littermates (n = 4). g-i. Hepatic Rspo3 mRNA and liver-body weight ratio in Rspo3 ΔHSC-ind (n = 5) (g), Rspo3ΔHep (n = 4) (h) and Rspo3ΔKC (Rspo3 fl/fl n = 5, Rspo3 ΔKC n = 4) (i) mice or floxed controls. Data are shown as mean ± s.e.m. Each dot represents one biological replicate (a-b,e-i). Scale bars 100 µm (c,k,l,m,n,o), 100 µm (d, white), 1 mm (d, black). P-values were calculated using unpaired two-tailed t-tests (a-c,e-i). Source data
Extended Data Fig. 9
Extended Data Fig. 9. Liver zonation in mice with HSC-, EC-, hepatocyte and KC-specific Rspo3 deletion.
a-d. IHC, morphometric quantification and qPCR of zonation markers and, in some cases, zonal quantification of IHC in livers from Rspo3 ΔHSC-ind (n = 7) or Rspo3 fl/fl (n = 6) (a), Rspo3 ΔHep (n = 4) or Rspo3 fl/fl (n = 4) (b), Rspo3 ΔKC (n = 4) or Rspo3 fl/fl (n = 5) (c), and Rspo3 ΔEC (n = 8) or Rspo3 fl/fl (n = 6) (d) littermates. e. Rspo3 qPCR in ECs (n = 5), the liver-body weight ratio (Rspo3 fl/fl n = 6, Rspo3 ΔEC-ind n = 7), IHC, morphometric quantification of zonation markers CYP2E1 and CYP1A2 (Rspo3 fl/fl n = 6, Rspo3 ΔEC-ind n = 7), CYP2F2 (Rspo3 fl/fl n = 13, Rspo3 ΔEC-ind n = 12) and HAL (Rspo3 fl/fl n = 13, Rspo3 ΔEC-ind n = 12) in livers of Rspo3 ΔEC-ind mice. Data are shown as mean ± s.e.m. Each dot represents one biological replicate (a-e). Scale bars 100 µm (a-e), P-values were calculated using unpaired two-tailed t-tests (a-e). Source data
Extended Data Fig. 10
Extended Data Fig. 10. Rspo3 functions in the liver.
a. Liver-body weight ratio 48 h after 70% PHx (Rspo3 fl/fl n = 7, Rspo3 ΔHSC n = 6) and Ki-67 IHC 5 days after 70% PHx (Rspo3 fl/fl n = 4, Rspo3 ΔHSC n = 5) in Rspo3 fl/fl and Rspo3 ΔHSC mice. b. Rspo3 fl/fl (n = 6) and Rspo3 ΔHSC (n = 7) mice were treated with TCPOBOP. The liver-body weight ratio, total Ki-67 and zonal Ki-67 were quantified 48 h later. c. Rspo3 fl/fl x Hgf fl/fl (n = 5 for 70% PHx, n = 10 for TCPOBOP), and Rspo3 ΔHSC x Hgf ΔHSC dko mice (n = 7 for 70% PHx, n = 10 for TCPOBOP) were subjected to 70% PHx or TCPOBOP treatment, followed by determination of the liver-body weight ratio, Ki-67 IHC and morphometric quantification 48 h later. d. Rspo3 fl/fl and Rspo3 ΔHSC mice (n = 4/group) were treated with 8xCCl4, followed by Sirus red staining and morphometric quantification. e. Rspo3 fl/fl (n = 4) and Rspo3 ΔHSC (n = 6) mice were treated with alcohol-free control liquid diet, followed by Oil red O staining, ALT and AST determinations. f. Alcohol dehydrogenase 2 (ALDH2) western blot in Rspo3 fl/fl (n = 4) and Rspo3 ΔHSC (n = 4) livers and quantification. g. Representative TUNEL images in Rspo3 fl/fl and Rspo3 ΔHSC mice treated with CDAA-HFD for 6 weeks. h. qPCR for fibrogenic genes, Sirius red staining and quantification and serum ALT in Rspo3 fl/fl (n = 10) and Rspo3 ΔHSC (n = 11) mice treated with CDAA-HFD for 6 weeks. i. Determination of fibrogenic genes by qPCR in 32-42 weeks old aged Rspo3 fl/fl (n = 9) and Rspo3 ΔHSC mice (n = 11). j. qPCR for fibrogenic genes in HSCs from Rspo3 fl/fl and Rspo3 ΔHSC mice (n = 3 each). k. Determination of CCl4-induced liver injury in Rspo3 fl/fl mice (n = 4) and mice with inducible HSC-specific Rspo3 deletion (Rspo3 ΔHSC-ind, n = 4). l-n. Liver injury, Ki-67 IHC and Oil Red O staining in Rspo3 fl/fl (n = 8) and Rspo3 ΔEC mice (n = 6) subjected to APAP treatment (l), Rspo3 fl/fl (n = 6) and Rspo3 ΔEC n = 5) mice subjected to 70% PHx (m), or Rspo3 fl/fl (n = 14) and Rspo3 ΔEC (n = 9) mice subjected to 6 weeks of CDAA-HFD (n). o. CCl4-induced liver injury in Rspo3 fl/fl (n = 5) and Rspo3 ΔEC-ind mice (n = 5). p-r. Biocrates 500 XL metabolomic analysis of livers from Rspo3 ΔHSC (n = 5) and Rspo3 fl/fl (n = 5) mice showing a volcano plot of metabolites (p), enriched metabolite classes (q) and bile acids taurocholic acid (TCA), taurochenodeoxycholic acid (TCDCA) and tauromuricholic acid (TMCA) (r). Data are shown as mean ± s.e.m. Each dot represents one biological replicate (a-f,h-o,r). Scale bars 100 µm (b-e,g-h,k-o). P-values were calculated using unpaired two-tailed t-tests (a-f,h-o,r). Source data
Extended Data Fig. 11
Extended Data Fig. 11. Expression and regulation of Rspo3.
a. Rspo3 mRNA in bulk RNA-seq from mouse HSCs isolated from different fibrosis models. qHSC, quiescent HSC. b. Determination of RSPO3 protein in liver extracts from healthy mice (n = 5) and mice after treatment with 40xCCl4 injections (n = 4) by ELISA. c. scRNA-seq data showing Col1a1 expression from mice on HF-HFD at different stages of MASLD (related to Fig. 5b). d. scRNA-seq showing Col1a1 and Hgf mRNA in quiescent, activated and deactivated mouse HSCs (related to Fig. 5c). e. Zonation of TGFB1, TGFB2 and TGFB3 (left panel) from Xu et al, Nat Genet 2024 56:953-969) and qPCR for Rspo3 in primary mouse HSCs (n = 3/group) and RSPO3 in human LX-2 HSCs (n = 4/group) after treatment with rhTGFb1, rhTGFb2 and rhTGFb3 (right panel). f. UMAP showing cell annotations in human snRNA-seq from healthy, MASLD and ALD livers (related to Fig. 5e). g. sc/snRNA-seq showing RSPO3 expression and cell annotations in human livers from the indicated dataset. h. UMAP showing quiescence marker HHIP (higher in cyHSC) and activation marker COL15A1 (high in myHSC) in human snRNA-seq (related to Fig. 5g). i. RSPO3 mRNA in endothelial cells from snRNA-seq data of healthy controls (Ctrl), MASLD and patients with alcoholic cirrhosis or alcoholic hepatitis (mean + 95% confidence interval in purple). Data are shown as mean ± s.e.m. Each dot represents one biological replicate (b,e). In the violin plots, box plots represent the interquartile range (IQR), Q1, median and Q3, whiskers as minimum (Q1-1.5xIQR) and maximum (Q3 + 1.5xIQR), and outlier data as individual dots. Each data point represents one cell (c,d). P values were calculated using one-way ANOVA followed by Dunnett’s multiple comparisons test (a,e), unpaired two-tailed t-tests (b) or two-way ANOVA followed by Tukey’s multiple comparison test (c,d,i).
Extended Data Fig. 12
Extended Data Fig. 12. Expression and correlation with WNT target gene expression and outcomes of R-spondins in human cohorts with MASLD and ALD.
a. Expression of RSPO1, RSPO2, RSPO3 and RSPO4 in the GSE49541 MASLD cohort. b-d. Correlation of RSPO1 (b), RSPO2 (c) and RSPO4 (d) mRNA with WNT target genes CYP2E1, CYP1A2 and TBX3 in the GSE135251 MASLD cohort. e-f. Correlation of RSPO1, RSPO2, RSPO3 and RSPO4 mRNA with the expression of WNT target genes TBX3, CYP1A2 and CYP2E1 in the GSE49541 MASLD (e) and the GSE103580 ALD (hASWX) (f) cohorts. g. Expression of RSPO1, RSPO2, RSPO3 and RSPO4 in the GSE103580 ALD cohort. h. Survival and HCC development stratified by RSPO3 expression in the GSE192959 cohort. i. Liver-related coding events by RSPO3 expression in the SteatoSITE MASLD cohort. Box plots represent the interquartile Range (IQR), Q1, median and Q3, each data point represents one individual (a,g). P-values were calculated using Wilcoxon rank-sum test (a,g) and log-rank test (h,i). Correlations were evaluated by pearson correlation coefficient (b-f). Source data

References

    1. Friedman, S. L., Roll, F. J., Boyles, J. & Bissell, D. M. Hepatic lipocytes: the principal collagen-producing cells of normal rat liver. Proc. Natl Acad. Sci. USA82, 8681–8685 (1985). - PMC - PubMed
    1. Bataller, R. & Brenner, D. A. Liver fibrosis. J. Clin. Invest.115, 209–218 (2005). - PMC - PubMed
    1. Friedman, S. L. Hepatic stellate cells: protean, multifunctional, and enigmatic cells of the liver. Physiol. Rev.88, 125–172 (2008). - PMC - PubMed
    1. Mederacke, I. et al. Fate tracing reveals hepatic stellate cells as dominant contributors to liver fibrosis independent of its aetiology. Nat. Commun.4, 2823 (2013). - PMC - PubMed
    1. Tsuchida, T. & Friedman, S. L. Mechanisms of hepatic stellate cell activation. Nat. Rev. Gastroenterol. Hepatol.14, 397–411 (2017). - PubMed

MeSH terms