. 2025 Apr;640(8059):762-771.
doi: 10.1038/s41586-025-08697-6. Epub 2025 Mar 12.

TGFβ links EBV to multisystem inflammatory syndrome in children

Carl Christoph Goetzke  1   2   3   4   5 Mona Massoud  6 Stefan Frischbutter  7   8 Gabriela Maria Guerra  6 Marta Ferreira-Gomes  6 Frederik Heinrich  6 Anne Sae Lim von Stuckrad  9   10 Sebastian Wisniewski  9 Jan Robin Licha  6 Marina Bondareva  6 Lisa Ehlers  6   9   11 Samira Khaldi-Plassart  12   13 Etienne Javouhey  14 Sylvie Pons  15 Sophie Trouillet-Assant  15   16 Yasemin Ozsurekci  17 Yu Zhang  18 Maria Cecilia Poli  19   20 Valentina Discepolo  21   22 Andrea Lo Vecchio  21 Bengü Sahin  9 Murielle Verboom  23 Michael Hallensleben  23 Anja Isabelle Heuhsen  6 Camila Astudillo  20 Yazmin Espinosa  20 Maria Cecilia Vial Cox  19 Kerry Dobbs  18 Ottavia M Delmonte  18 Gina A Montealegre Sanchez  18 Mary Magliocco  18 Karyl Barron  18 Jeffrey Danielson  18 Lev Petrov  24 Nadine Unterwalder  25 Birgit Sawitzki  24 Mareen Matz  11 Katrin Lehmann  6 Alexander Gratopp  9 Horst von Bernuth  9   11   26   27 Lisa-Marie Burkhardt  28 Niklas Wiese  28 Lena Peter  27 Michael Schmueck-Henneresse  27 Leila Amini  27   28 Marcus Maurer  7   8 Jobst Fridolin Roehmel  9   11   29 Benjamin E Gewurz  30   31 Lael M Yonker  32   33   34 Mario Witkowski  6   35   36 Andrey Kruglov  6   37 Marcus Alexander Mall  9   11   38   29 Helen C Su  18 Seza Ozen  39 Andreas Radbruch  6 Alexandre Belot  12   40 Pawel Durek  6 Tilmann Kallinich  41   42   43   44   45 Mir-Farzin Mashreghi  46   47
Affiliations

TGFβ links EBV to multisystem inflammatory syndrome in children

Carl Christoph Goetzke et al. Nature. 2025 Apr.

Abstract

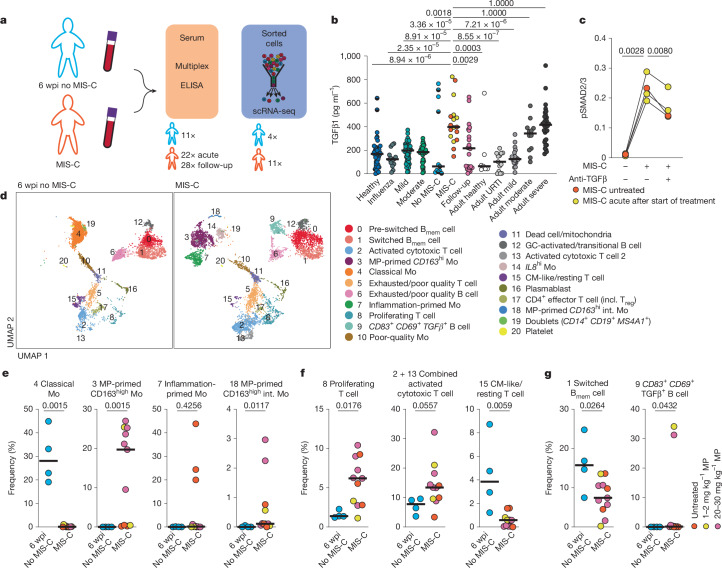
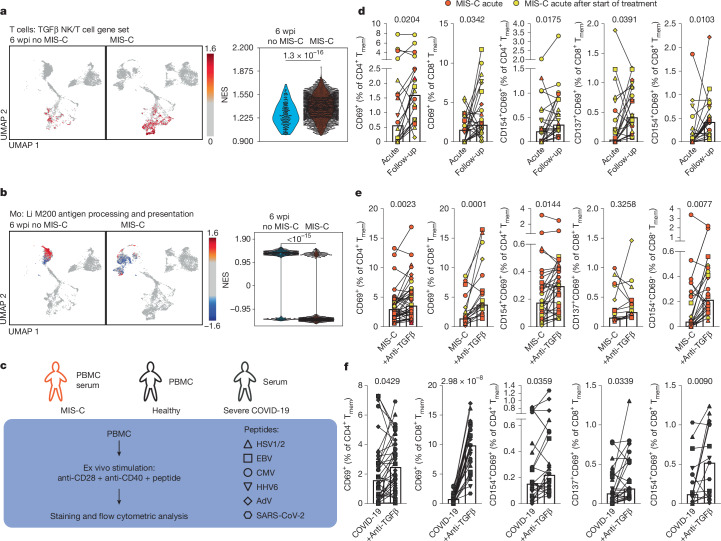
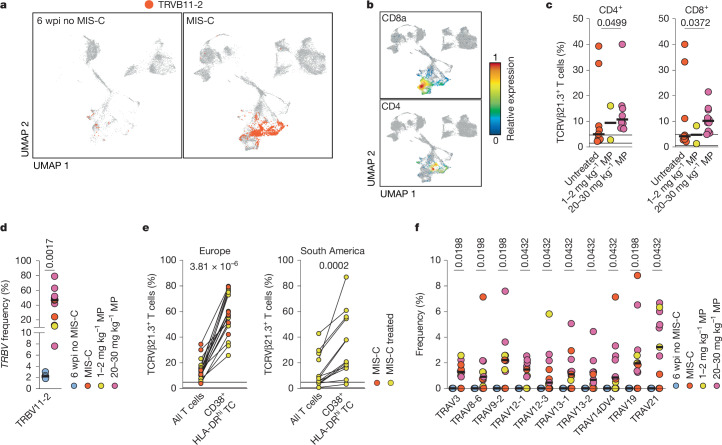
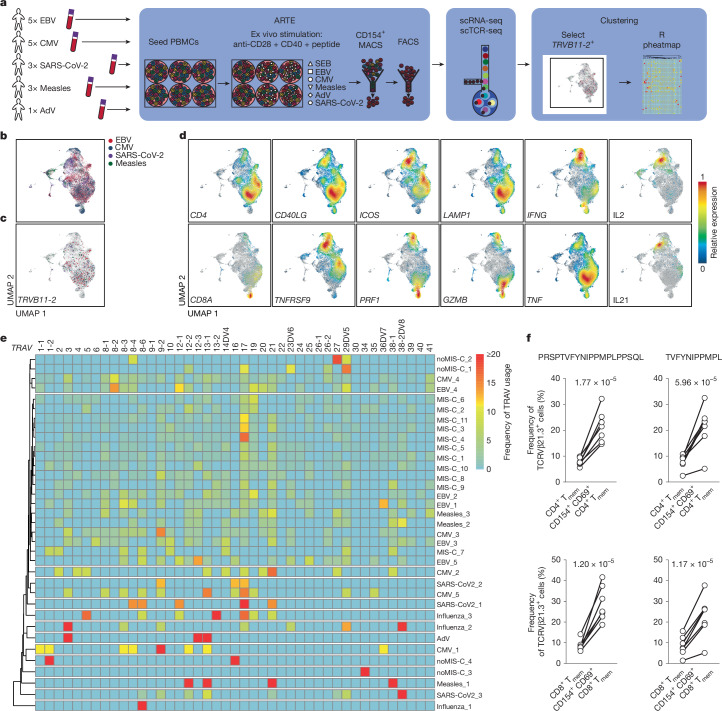
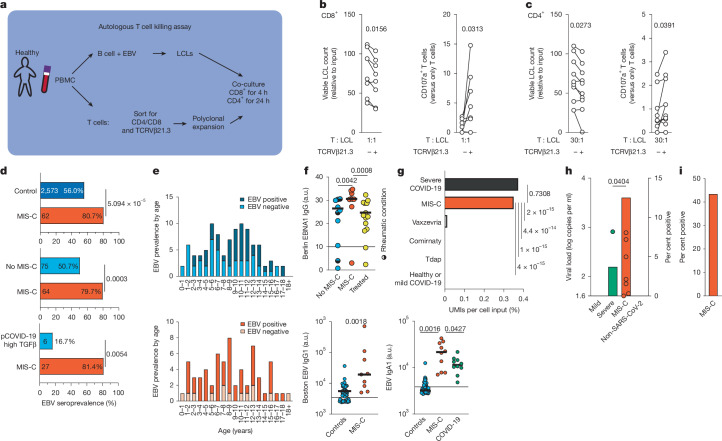
In a subset of children and adolescents, SARS-CoV-2 infection induces a severe acute hyperinflammatory shock1 termed multisystem inflammatory syndrome in children (MIS-C) at four to eight weeks after infection. MIS-C is characterized by a specific T cell expansion2 and systemic hyperinflammation3. The pathogenesis of MIS-C remains largely unknown. Here we show that acute MIS-C is characterized by impaired reactivation of virus-reactive memory T cells, which depends on increased serum levels of the cytokine TGFβ resembling those that occur during severe COVID-19 (refs. 4,5). This functional impairment in T cell reactivity is accompanied by the presence of TGFβ-response signatures in T cells, B cells and monocytes along with reduced antigen-presentation capabilities of monocytes, and can be reversed by blocking TGFβ. Furthermore, T cell receptor repertoires of patients with MIS-C exhibit expansion of T cells expressing TCRVβ21.3, resembling Epstein-Barr virus (EBV)-reactive T cell clones capable of eliminating EBV-infected B cells. Additionally, serum TGFβ in patients with MIS-C can trigger EBV reactivation, which is reversible with TGFβ blockade. Clinically, the TGFβ-induced defect in T cell reactivity correlates with a higher EBV seroprevalence in patients with MIS-C compared with age-matched controls, along with the occurrence of EBV reactivation. Our findings establish a connection between SARS-CoV-2 infection and COVID-19 sequelae in children, in which impaired T cell cytotoxicity triggered by TGFβ overproduction leads to EBV reactivation and subsequent hyperinflammation.


Conflict of interest statement

Competing interests: M.-F.M., C.C.G., T.K. and P.D. filed a patent using TGFβ blockade for management of MIS-C and other post-COVID-19 sequelae. S.P. is an employee of bioMérieux. Y.O. received lecture fees from Pfizer on topics unrelated to this article. S.O. received speaker and/or consultancy fees from Novartis and Sobi on topics unrelated to this article. The authors declare no further competing interests.

Figures

Fig. 1
Fig. 1. Cytokine profile and effect on immune cell compartments in MIS-C.
a, Schematic of the experimental setup. b, Serum TGFβ1 levels in patients with MIS-C during the first 7 days of hospitalization (n = 22) and during follow-up (n = 28 time points, 23 patients) versus paediatric controls: 6 weeks after SARS-CoV-2 infection (no MIS-C, n = 11, 5 with underlying rheumatic condition), acute influenza (influenza, n = 14), asymptomatic or mild (mild, n = 57, 13 without symptoms) or moderate or severe (moderate, n = 42, 2 with severe symptoms) SARS-CoV-2 infection, and non-infected children (healthy, n = 40, 5 with underlying rheumatic condition). Additional comparison was made with previously published TGFβ1 levels in healthy adults under 30 years of age (adult healthy, n = 7), adults with upper respiratory tract infection (URTI) (adult URTI, n = 13) and adults with COVID-19 in the first two weeks (adult mild, n = 19; adult moderate, n = 12; adult severe, n = 34). c, T cells from healthy donors (n = 2) were incubated with sera from patients with MIS-C (MIS-C, n = 4; 3 after start of treatment (yellow)) with or without neutralizing anti-TGFβ and SMAD2/3 phosphorylation (pSMAD2/3) was quantified using a capillary-based western blot assay (Extended Data Fig. 1i–o). dg, scRNA-seq of PBMCs enriched by FACS for monocytes, HLA-DRhiCD38+ T cells and CD27+ B cells from n = 4 paediatric controls (6 wpi no MIS-C) and n = 11 patients with MIS-C (sorting strategy in Extended Data Fig. 2b). d, UMAP of 6,589 cells from 6 wpi no MIS-C controls and 34,794 cells from the MIS-C group, separated by cohort and rarefied. Cluster colours are unsupervised. UMAPs for individual patients are presented in Extended Data Fig. 2j. Bmem, memory B cell; CM, central memory; GC, germinal centre; incl., including; int., intermediate; Mo, monocyte; MP, methylprednisolone. eg, Frequencies of cells per cluster for clusters 3, 4, 7 and 18 (e), 8, 2 and 13, and 15 (f) and 1 and 9 (g). Methylprednisolone treatment is colour-coded as indicated in g. Lines represent the median. Other cluster frequencies are shown in Extended Data Fig. 2k–n. Kruskal–Wallis test with Dunn’s multiple comparison with correction for multiple comparisons, comparing each group to patients with MIS-C (b); two-tailed repeated-measures ANOVA with Geisser–Greenhouse correction with Holm–Šídák’s multiple comparison test with correction for multiple comparisons (c); two-tailed Mann–Whitney U-tests (eg).
Fig. 2
Fig. 2. Impaired T cell reactivity during acute phase of MIS-C is induced by TGFβ.
a,b, GSEA using a previously defined TGFβ gene set applied to T cells (a) and the gene set ‘Li M200 antigen processing and presentation’ applied to monocyte clusters (b) depicted as both UMAP (left) and a dot plot (right). c, Schematic overview of T cell reactivation assays. d, Frequencies of overall activated (CD69+) and antigen-specific reactivated (CD137+CD69+ and CD154+CD69+) CD4+ or CD8+ memory T cells (Tmem, CD45RO+) from patients with MIS-C during the acute phase and at follow-up after symptoms resolved (n = 8 patients and n = 5 different viral peptides). e,f, Frequencies of overall activated and antigen-specific reactivated cells of CD4+ and CD8+ memory T cells (Tmem; CD45RO+) from healthy donors (n = 6) treated with serum from patients with MIS-C (e; n = 7) or patients with severe COVID-19 (fn = 5) with or without anti-TGFβ. Samples that were obtained more than 24 h after the start of treatment are colour-coded in yellow. Unpaired (a,b) or paired (df) two-tailed Mann–Whitney U-tests.
Fig. 3
Fig. 3. Expansion of a specific subset of TRBV11-2+ T cells occurs during MIS-C.
a, TRBV11-2+ T cells superimposed on UMAP of enriched activated cells of paediatric controls at 6 wpi and patients with MIS-C (Fig. 1d). b, Expression of CD8a and CD4 genes (CD4 expression only on T cells is depicted for better overview) superimposed on the UMAP from Fig. 1d. c, Flow cytometric analysis of TCRVβ21.3+ T cells among CD4+ or CD8+ T cells from patients with MIS-C before start of treatment (untreated, n = 9), after 1–3 days of 1–2 mg kg−1 methylprednisolone (n = 2) or after 1–3 days of 20–30 mg kg−1 methylprednisolone (n = 10). Contingencies of TCRVβ21.3+ T cell expansion above the laboratory determined upper cut-off were determined by two-tailed Fisher’s exact test. d, Frequency of TRBV11-2+ T cells among total T cells for paediatric controls at 6 wpi and patients with MIS-C during the acute phase (d; Berlin cohort) and validation of single-cell TCR sequencing data (Berlin cohort) using protein quantification by flow cytometry in two independent cohorts from Europe (France and Italy; n = 19) and South America (Chile; n = 13). Gating strategy in Extended Data Fig. 7l,m. Frequencies of TCRVβ21.3+ cells gated on all CD3+ cells were compared to frequencies of TCRVβ21.3+ cells gated on CD3+CD38+HLA-DR+ cells. f, Distribution of indicated TRAV genes associated with TRBV11-2 (n = 4 controls; n = 11 patients with MIS-C). Treatment with methylprednisolone is colour-coded as in d; MIS-C indicates sampling before start of treatment. Two-sided Mann–Whitney U-tests (d,f); two-sided Wilcoxon matched-pairs signed-rank tests (e).
Fig. 4
Fig. 4. TCR repertoires of expanded T cells in MIS-C show overlap with EBV-specific TCR repertoires.
a, Schematic showing generation of virus-specific TCR libraries and comparison of virus-specific TCRs with MIS-C-specific TCRs. scTCR-seq, single-cell TCR sequencing. b, UMAP of 22,344 virus-specific T cells from donors restimulated with EBV (n = 5), CMV (n = 5), SARS-CoV-2 (n = 3) or measles (n = 3) peptides, representing 18,010 sequenced TCRβ chains and 15,496 full TCRs. AdV-specific T cells were TCR-sequenced. Virus-specificities are colour-coded. c, TRVB11-2+ T cells superimposed on the UMAP in b. d, Gene expression superimposed on the UMAP of antigen-specific T cells, showing that most TRVB11-2+ T cells have a CD4 or CD8 cytotoxic phenotype (low: ICOS; high: PRF1, GZMB, LAMP1). e, TCR repertoires of EBV (n = 5), CMV (n = 5), SARS-CoV-2 (n = 3), measles (n = 3) and AdV (n = 1) virus-specific T cells from healthy donors, analysed by ARTE. Heat map showing distribution of TRAV gene expression associated with TRBV11-2-positive T cells in virus-specific and MIS-C T cells (n = 11) T cells, compared with 6 wpi no MIS-C (n = 4) and paediatric influenza (n = 3) T cells. Unsupervised clustering was performed with the R package pheatmap. f, TCRVβ21.3 expression on memory T (Tmem) cells after stimulation with EBNA2275–294 (left) or EBNA2279–289 (right) peptides, analysed by ARTE. Frequencies of TCRVβ21.3+ in all CD4+ (top) and CD8+ (bottom) memory T cells and those with antigen-specific reactivation (CD154+CD69+) from n = 7 donors. Flow cytometry gating is shown in Extended Data Fig. 8c. Two-sided paired t-test.
Fig. 5
Fig. 5. EBV reactivation is prominent in MIS-C.
a, Setup of autologous T cell killing assay. b,c, CD4+ and CD8+ T cells (n = 4 donors, 2 time points each) with enriched or depleted TCRVβ21.3+ cells were expanded. EBV-transfected LCLs were generated. T cells and LCLs were co-cultured. b, Viable LCL counts and CD107a expression measured by flow cytometry for CD8+ T cells grown in a 1:1 ratio with LCLs for 4 h (b) and CD4+ T cells grown in a 30:1 ratio with LCLs for 24 h (c). Normalized to LCL incubated without T cells. d, EBV seroprevalence from patients with MIS-C and age-matched controls (no MIS-C), paediatric patients with COVID-19 with high TGFβ (pCOVID-19 high TGFβ) and age-matched healthy controls (control). Group sizes are indicated on bars. e, EBV seroprevalence by age in patients with MIS-C and healthy controls. f, EBV antibody titres in MIS-C versus local paediatric control groups (Berlin: no MIS-C, n = 10; MIS-C, n = 9; MIS-C treated, n = 15; Boston: pre-pandemic healthy controls, n = 57; MIS-C, n = 9; age-matched COVID-19, n = 9). Titres depicted with assay-specific cut-offs. g, Unmapped reads from activated B cell and plasmablast datasets (healthy or mild COVID-19 (ref. ), n = 6; Tdap, n = 7; Comirnaty, n = 15; Vaxzevria, n = 8; MIS-C, n = 32; severe COVID-19 (ref. ), n = 12; same cells sorted) tested against the EBV genome. EBV-specific UMI counts were compared (healthy or mild COVID-19, n = 12,716 cells, 0 EBV UMIs; Tdap, n = 32,677 cells, 0 EBV UMIs; Comirnaty, n = 11,600 cells, 0 EBV UMIs; Vaxzevria, n = 16,445 cells, 2 EBV UMIs; MIS-C, n = 16,849 cells, 59 EBV UMIs; severe COVID-19, n = 96,703 cells, 361 EBV UMIs). h, Viral load in 100 µl of cell-free plasma from children with mild or asymptomatic COVID-19 (mild, n = 14), severe COVID-19 (severe, n = 27), MIS-C (n = 56) or other severe viral infections (non-SARS-CoV-2, n = 9), measured by quantitative PCR. i, EBV DNA detection in whole blood from patients with MIS-C. Two-tailed Wilcoxon signed-rank test (b,c); one-tailed Fisher’s exact test (d); two-tailed Mann–Whitney U-test or ANOVA followed by Welch’s t-tests (f); two-tailed Fisher’s exact test (g); Kruskal–Wallis test followed by Dunn’s multiple comparison test, comparing all groups to MIS-C (h).
Extended Data Fig. 1
Extended Data Fig. 1. Multiplex cytokine profiling in MIS-C.
a-f, Cytokine, chemokine and growth factor profiles of serum from MIS-C patients during the first seven days of hospitalization (n = 22), untreated samples are marked in red, and at follow-up visits (n = 28 time points, 23 patients), paediatric patients during an acute infection with a asymptomatic to mild SARS-CoV-2 (mild; n = 57 of which n = 13 had no symptoms) or a moderate to severe (mod.; n = 42 of which teo had severe symptoms), of non-infected children (n = 40 of which five have an underlying rheumatic condition) and of children six weeks after SARS-CoV-2-infection, that did not develop MIS-C (n = 11 of which n = 5 have an underlying rheumatic condition). a, Type 1 cytokines, b, type 2 cytokines, c, type 3 cytokines, d, IL-1 family cytokines and e, chemokines and f, growth factors. g, Correlation of cytokine quantity versus time after hospitalization and initiation of treatment. h, Serum levels over time (0 indicates day of initiation of treatment) in individuals with MIS-C are indicated and decline in TGFβ1 serum levels was correlated to time after initiation of treatment. i-j, Graph view results of simple western size-based assay results for i, SMAD2/3 and j, phospho-SMAD2/3 (Ser465/467) (Fig. 1c) of primary T cells restimulated ex vivo with sera from indicated patients for 30 min with or without addition of a neutralizing anti-TGFβ prior to stimulation. k-m, HEK293T cells were transfected with a plasmid expressing a dominant negative mutant human TGFBR2 or a non-expressing plasmid with Blasticidin-resistance. After positive selection with Blasticidin, cells were stimulated with MIS-C patients’ sera (MIS-C; n = 4; yellow indicates sampling after start of treatment as indicated in i) for 30 min or left unstimulated, lysed and SMAD2/3 and phospho-SMAD2/3 (Ser465/467) levels were quantified by Simple Western Size-Based assay. k, Phospho-SMAD2/3 (Ser465/467) levels normalised to total SMAD2/3 levels. l-m, Graph view results of simple western size-based assay results for (l) SMAD2/3 and m phospho-SMAD2/3 (Ser465/467). n-o, Graph view results of Tubulin used as a loading control for (n) T cells and (o) transfected HEK293T cells. a-f, Lower limits of quantification are indicated by horizontal lines, short lines indicate medians. A non-parametric ANOVA (Kruskal-Wallis test) was used followed by a Dunn’s multiple comparison test with correction for multiple comparisons, g-h, a two-tailed spearman-correlation was used, or k, a two-tailed ratio paired t-test was used.
Extended Data Fig. 2
Extended Data Fig. 2. Single cell sequencing in MIS-C.
a, Schematic outline of the scRNAseq approach. b, Flow cytometry gating strategy. c, UMAP with clustering at resolution 0.6 of all patients and controls combined. d, Quality controls are depicted on this UMAP. UMI counts, feature counts and % mitochondrial genes are depicted for each cell. As additional quality controls, gene expression for the indicated housekeeping genes are depicted. e, To assess cell proliferation expression of G1-phase cell cycle genes are plotted on the UMAP. f, Local density of TCR and BCR expressing cells is plotted. g-i, Relative expression of the indicated genes are plotted onto the UMAP to identify (g) monocyte, h, T-cell and (i) B-cell subsets including BCR isotypes. Cluster naming is based on marker gene expression and top differentially expressed genes (Supplementary Data 1). j, UMAP separated by individual patients organised by duration and dosage of methylprednisolone treatment. B07 (MIS-C patient Berlin 07), B09 and B 10 were captured before treatment with methylprednisolone, B08 was treated with 1-2 mg/kg methylprednisolone for two days, B06 was treated with 1-2 mg kg−1 methylprednisolone for three days. Patients B01, B02 B04, B05 and B11 were treated with 20–30 mg kg−1 methylprednisolone for one day and B03 was treated with 20–30 mg kg−1 methylprednisolone for four days before capturing (Supplementary Data 8). Paediatric controls 6 wpi with SARS-CoV-2 (ctrl 1–4) did not receive medication. k-n, Frequencies of cells per cluster in both groups (n = 4 no MIS-C and 11 MIS-C) for clusters not included in Fig. 1. Treatment with methylprednisolone is colour-coded in n. k-n, two-tailed Mann-Whitney-U-tests.
Extended Data Fig. 3
Extended Data Fig. 3. Single cell analysis of methylprednisolone treated patients.
a, Schematic outline of the scRNAseq approach to identify the effect of methylprednisolone treatment. b, Gating strategy used for scRNAseq experiment. c, UMAP of a total of 13646 cells enriched by FACS for monocytes, HLA-DRhigh cells, CD38+ T cells and CD27+ B cells of n = 4 patients prior (pre MP, 6839 cells) and after (post MP, 6807 cells) a three-day treatment with 20–30 mg kg−1 day−1 methylprednisolone. One patient was diagnosed with juvenile idiopathic arthritis (JIA), two patients with systemic lupus erythematosus (SLE) and one patient with morphea. d, Quality controls of the integrated data are depicted on this UMAP and UMI counts, feature counts and % mitochondrial genes are depicted for each cell. As an additional quality control, gene expression for the housekeeping gene GAPDH is depicted. e, Core marker gene expression for each cell is depicted and used for naming the clusters along with the top differentially expressed genes (Supplementary Data 2). fCD163 expression and (gIL1R2 which defines cluster 3 and 18 of the MIS-C cohort is depicted separately for pre MP and post MP. h-i, UMAP separated for individual patients’ cells before and after treatment are depicted with (hCD163 expression and (iIL1R2 expression depicted separately.
Extended Data Fig. 4
Extended Data Fig. 4. Gene Set Enrichment Analysis on a single cell level in MIS-C.
a-s, GSEA for indicated gene sets on indicated cell populations. For each GSEA the normalised enrichment score (NES) is depicted on the rarefied UMAP (see Fig. 1d). The NES of all cells with significant positive or negative enrichment are plotted in a violin-plot. P-values are determined by two-tailed Fisher’s exact test testing for positive versus negative enrichment. t-u, Pseudobulk GSEA for indicated gene sets on indicated cell populations. Enrichment Score, Normalised Enrichment Score, nominal P-value and FDR are indicated in next to the plot.
Extended Data Fig. 5
Extended Data Fig. 5. Single cell sequencing of additional influenza infected patient derived samples.
a, Gating strategy used for scRNAseq experiment of influenza infected patients. b, Projection of the clusters from Fig. 1d onto a split UMAP of non-integrated samples from the 3 influenza infected patients combined with data from Fig. 1d. c, Quality controls of the integrated data from three patients hospitalized due to influenza infection, eleven patients with MIS-C and four patients 6 wpi no MIS-C. A total of 44206 cells are depicted on this UMAP and UMI counts, feature counts and % mitochondrial genes are depicted for each cell. d, As additional quality controls, gene expression for the indicated housekeeping genes are depicted. e, To assess cell proliferation expression of G1-phase cell cycle genes are plotted on the UMAP. f, Cells expressing a BCR and TCR are colour-coded on the UMAP to identify B cells and T cells. g, The relative expression of the indicated genes are plotted onto the UMAP to identify monocytes. h, Gating of B cell like (BC like), T cell like (TC like) and monocyte like cells is depicted on the UMAP low quality cells are included for calculating frequencies (left), whilst low quality cells were removed for all other following analysis (right). i-o, After removal of the low quality cells, monocyte like, B cell like and T cell like cells were integrated for further analysis. i, To assess cell proliferation expression of G1-phase cell cycle genes are plotted on the UMAP. j, Local density of TCR, BCR and BCR isotypes are plotted on the UMAP. k-m, The relative expression of the indicated genes are plotted onto the UMAP to identify (k) monocyte, (l) T-cell and (m) B-cell subsets. n, Depicts the clustering at resolution 0.5 on the UMAP and (o) split by group. Cluster naming is based on marker gene expression (Extended Data Fig. 5j–m) and top differentially expressed genes (Supplementary Data 17). Frequencies of cells per cluster are in Supplementary Data 18.
Extended Data Fig. 6
Extended Data Fig. 6. Gene Set Enrichment Analysis on a single cell level in MIS-C and influenza infection.
In contrast to Fig. 2 and Extended Data Fig. 4 a FDR of <0.25 was used for identifying significantly up- or downregulated genes. a-u, GSEA for indicated gene sets on indicated cell populations. The NES of all cells with significant positive or negative enrichment are plotted in a violin-plot. v-ap, GSEA for indicated gene sets on indicated cell populations. The NES of all cells with significant positive or negative enrichment are plotted in a violin-plot. P-values are determined by two-tailed Fisher’s exact test testing for positive versus negative enrichment, or by two-tailed Mann-Whitney-U-tests to test for positivity of NES (for a + v and for c-e; marked by an *).
Extended Data Fig. 7
Extended Data Fig. 7. TGFβ impairs T-cell activation to viral epitopes.
a, Gating strategy used in flow cytometry of the T cell reactivity assays depicted in Fig. 2d–f. Cells were identified by size and granularity in a FSC-vs SSC plot, followed by doublet exclusion in an FSC-A vs. FSC-H plot. Dump+ (DAPI, CD14 and CD19)+ cells were also excluded. As CD3 is downregulated after T cell activation (SEB plot in second row), the gate was extended to include CD3low CD45RO+ cells. CD4+ epitope-specific T cells were identified as CD69+ CD154+ and CD8+ epitope specific T cells were identified as CD69+ CD137+ or as CD69+ CD154+. SEB was used as a positive control for correct gating. b, Cell counts for CD69+ or CD69+ and CD154+ or CD137+ memory T cells from Fig. 2d. c, Gating strategy used in flow cytometry of the T cell reactivity assays depicted in d. d, Frequencies of overall activated and antigen-specific reactivated cells of CD4+ and CD8+ memory T cells from six children with a confirmed infection with SARS-CoV-2 during the acute phase and follow-up upon after resolution of symptoms. e, Frequencies of overall activated and antigen-specific reactivated cells of CD4+ and CD8+ memory T cells from healthy donors (n = 6) treated with 50 ng ml−1 TGFβ1. f, Frequencies of TCRVβ21.3+ on total T cells were quantified by Flow cytometry over time after treatment start with IVIG and methylprednisolone. Horizontal lines indicate normal range (0.9-4.9% for CD8+ T cells; 1.5-4-7% for CD4+ T cells) of TCRVβ21.3+ T cells (n = 25, children with MIS-C). g, Significantly regulated TRBV determined by TCR sequencing of activated T cells. Dots indicate the frequency of specific TRBV in each sample relative to all TCRs sequenced. h, Frequencies of TRAV gene associated to TRBV11-2+ T cells not depicted in Fig. 3f. i, HLA-class I haplotyping and (j-k) HLA-class-II haplotyping of our MIS-C cohort (n = 20 patients and n = 10 healthy controls including the 4 children used as a control for the scRNAseq experiments). Additionally, HLA-haplotyping from a previously published MIS-C cohort (n = 7 patients and 9 controls) was included. l-m, Sorting strategy for Fig. 3e. P-values for (b + d-e + h) were determined by paired two-tailed Mann-Whitney-U-tests.
Extended Data Fig. 8
Extended Data Fig. 8. Antiviral immunity in MIS-C.
a, Flow cytometry gating strategies used for sorting of T cells obtained after the ARTE-assay and used for generation of a virus-specific TCR library (Fig. 4a, b). b, Frequencies of TRAV gene associated to TRBV11-2+ T cells from either EBV-, CMV-, SARS-CoV-2-, Measles-, or AdV-specific T cells used for clustering in Fig. 4e. c, Flow cytometry gating strategy of PBMC stimulated with the EBNA2275-294-peptide PRSPTVFYNIPPMPLPPSQL or the EBNA2279-289-peptide TVFYNIPPMPL for Fig. 4f. Flow cytometry gating strategies used (d) for sorting of TCRVβ21.3-positive or -negative CD4+- or CD8+ T cells for co-culture experiments (Fig. 5a), (e) analysing viable EBV infected B cells after co-culture with T cells for Fig. 5b,c and f analysing CD107a+ T cells after co-culture with EBV-infected B cells (Fig. 5b,c). g, LCL from healthy donors (n = 6) were treated with TGF-β, or with serum from MIS-C (n = 5) or severe COVID-19 (n = 6), with or without pre-incubation with anti-TGFβ blocking antibodies. EBV reactivation was evaluated by qPCR by quantifying the reactivation transcription factor BZLF1. Results were calculated using the 2−ΔCt method. h-k, Seroprevalences for different virus were compared between MIS-C patients, patients that did not develop MIS-C after infection with SARS-CoV-2 and controls after age-matching (Supplementary Data 8–12+15). Group sizes and percentages of and antibody-positivity are indicated on bars. h, Age-matched controls for EBV were compared to children that did not develop MIS-C after infection with SARS-CoV-2. i, CMV-seroprevalence was compared for children with MIS-C and age-matched controls or age-matched children that did not develop MIS-C after infection with SARS-CoV-2, and children that did not develop MIS-C and age-matched controls. j, Age-matched controls for HSV-1 seroprevalence and (k) age matched controls for HHV6-seroprevalence were compared to MIS-C patients. l, Antibody tires for anti-Adenovirus-IgG was compared between MIS-C patients (n = 9, of which 8 had a positive titre), children six weeks p.i. who did not develop MIS-C (n = 10) and MIS-C patients treated with IVIG (n = 15) from the Berlin cohort. For the Boston cohort anti-virus-IgG1- titres were compared between MIS-C patients (n = 9) and pre-pandemic paediatric controls (n = 9 Pertussis, n = 20 RSV). m, Age-distribution within the largest age-group used for age matching for no MIS-C and MIS-C patients. n, Percentage of actively EBV-mRNA transcribing patients determined by scRNAseq of B cells and plasmablasts. P-values for (g)are calculated by a two-tailed Wilcoxon signed-rank test; for (h-k) are calculated by one-tailed Fisher’s exact test to test if seroprevalences are increased in MIS-C or decreased in no MIS-C and for (l) by two-tailed Mann-Whitney U-tests comparing only the positive samples or determined by a non-parametric ANOVA (Kruskal-Wallis test) followed by a Dunn’s multiple comparison test with correction for multiple comparisons, comparing all groups to MIS-C; m, are calculated using a two-tailed Mann-Whiteney-U-test and for (n) a one-tailed Chi-Squared tests to test if EBV mRNA positivity is enriched in MIS-C were calculated.
Extended Data Fig. 9
Extended Data Fig. 9. Detection of EBV-mRNA by transcriptomics.
a, Flow cytometry gating strategies used for sorting of B cells and plasmablasts for single cell transcriptomics. b, Integrated UMAP depicting 186,990 cells from healthy adults or adults with mild COVID-19 (n = 6), healthy adults on day seven post vaccination (Tdap vaccine, n = 7 of which one had mild COVID-19 at time of sampling, Comirnaty vaccine n = 15 or Vaxzevria vaccine n = 8), MIS-C (n = 6) or adults with severe COVID-19 (n = 12). Clustering at a resolution of 0.1 was used to show the position of B cells and plasmablasts on the UMAP. c, For quality controls of the B cell and plasmablast UMAP UMI counts, feature counts and % mitochondrial genes are depicted for each cell. As additional quality controls, gene expression for the indicated housekeeping genes are depicted. d, To assess cell proliferation expression of G1-phase cell cycle genes and MKI67 are plotted on the UMAP. e, The relative expression of the indicated genes are plotted onto the UMAP to identify B cells, plasmablasts and doublets. f, Cells positive for EBV-mRNA that could be mapped onto the UMAP are highlighted in red.

References

    1. Riphagen, S., Gomez, X., Gonzalez-Martinez, C., Wilkinson, N. & Theocharis, P. Hyperinflammatory shock in children during COVID-19 pandemic. Lancet395, 1607–1608 (2020). - PMC - PubMed
    1. Moreews, M. et al. Polyclonal expansion of TCR Vbeta 21.3+ CD4+ and CD8+ T cells is a hallmark of multisystem inflammatory syndrome in children. Sci. Immunol.6, eabh1516 (2021). - PMC - PubMed
    1. Sacco, K. et al. Immunopathological signatures in multisystem inflammatory syndrome in children and pediatric COVID-19. Nat. Med.28, 1050–1062 (2022). - PMC - PubMed
    1. Witkowski, M. et al. Untimely TGFβ responses in COVID-19 limit antiviral functions of NK cells. Nature600, 295–301 (2021). - PubMed
    1. Frischbutter, S. et al. Serum TGF-β as a predictive biomarker for severe disease and fatality of COVID-19. Eur. J. Immunol.53, e2350433 (2023). - PubMed

MeSH terms

Substances

Supplementary concepts