. 2025 Apr;640(8059):811-820.
doi: 10.1038/s41586-025-08721-9. Epub 2025 Mar 12.

MYC ecDNA promotes intratumour heterogeneity and plasticity in PDAC

Affiliations

MYC ecDNA promotes intratumour heterogeneity and plasticity in PDAC

Elena Fiorini et al. Nature. 2025 Apr.

Abstract

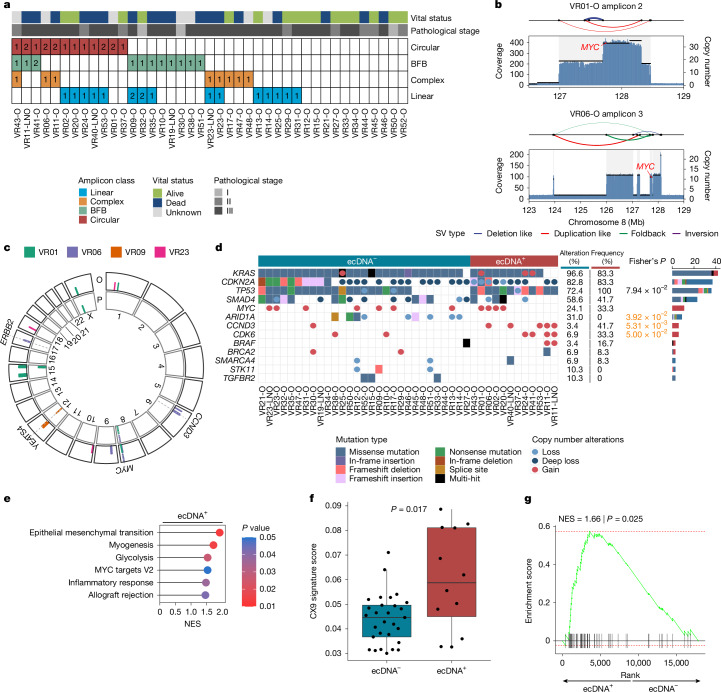
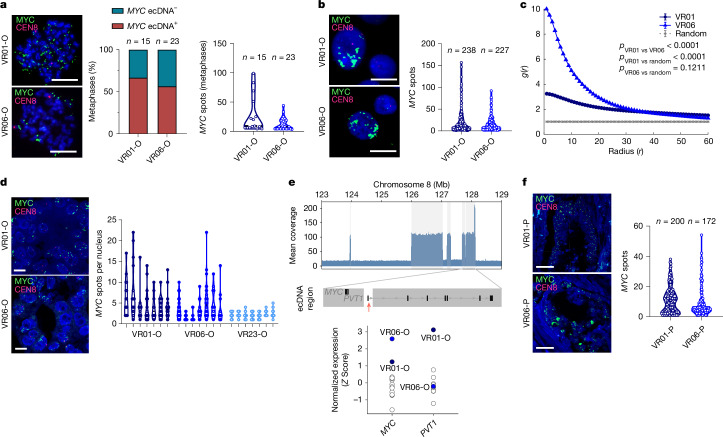
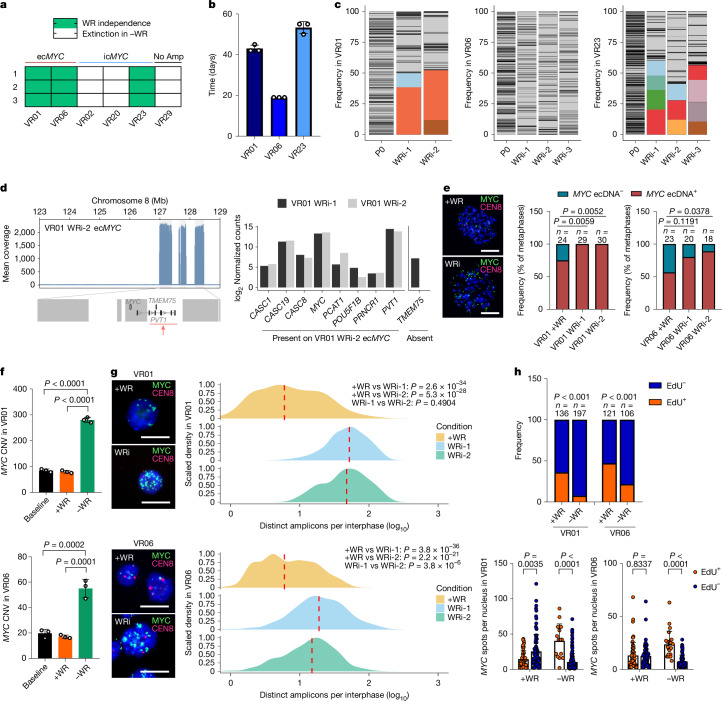
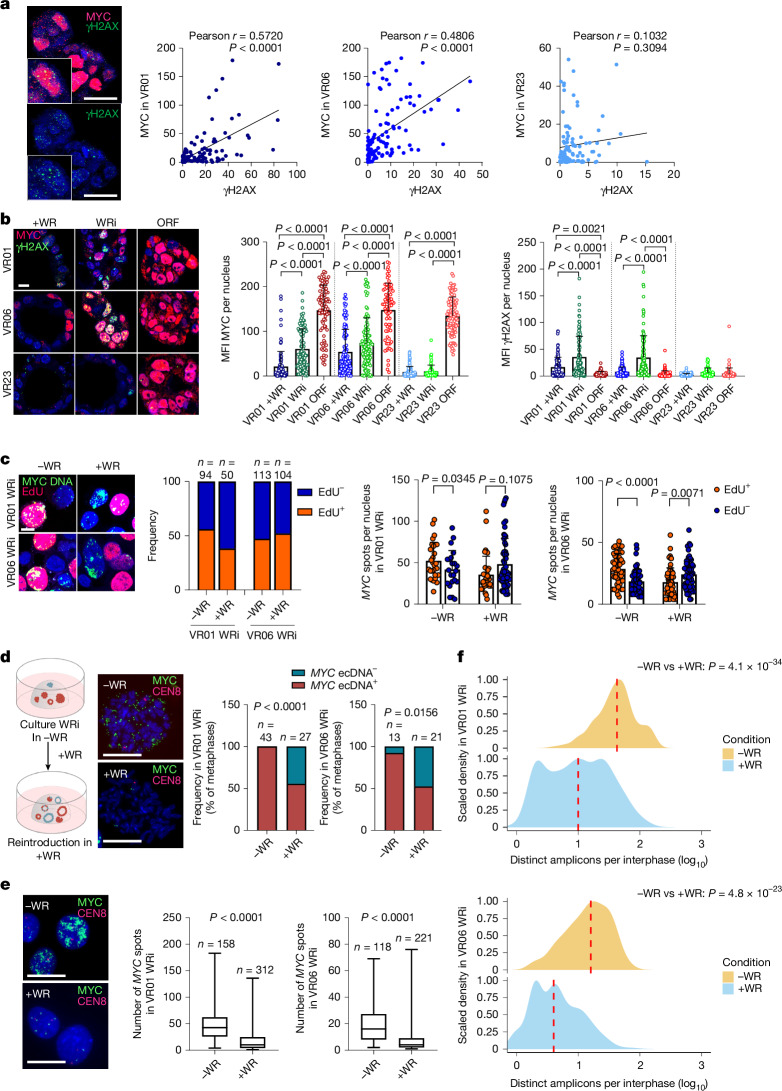
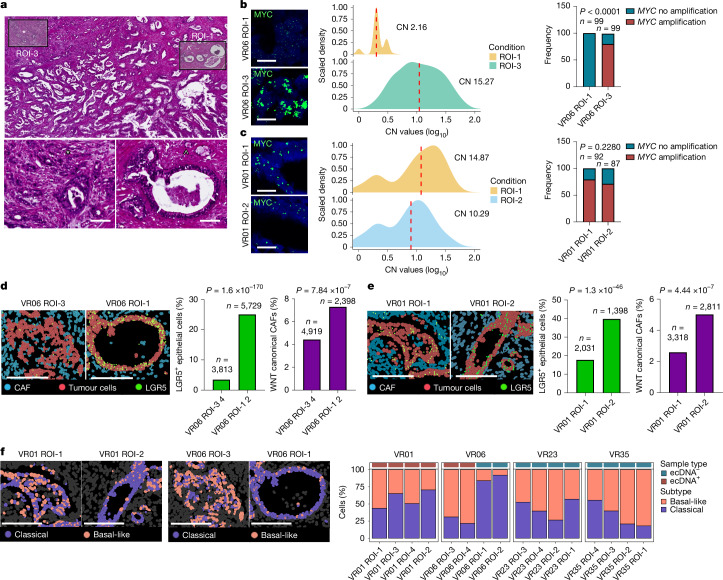
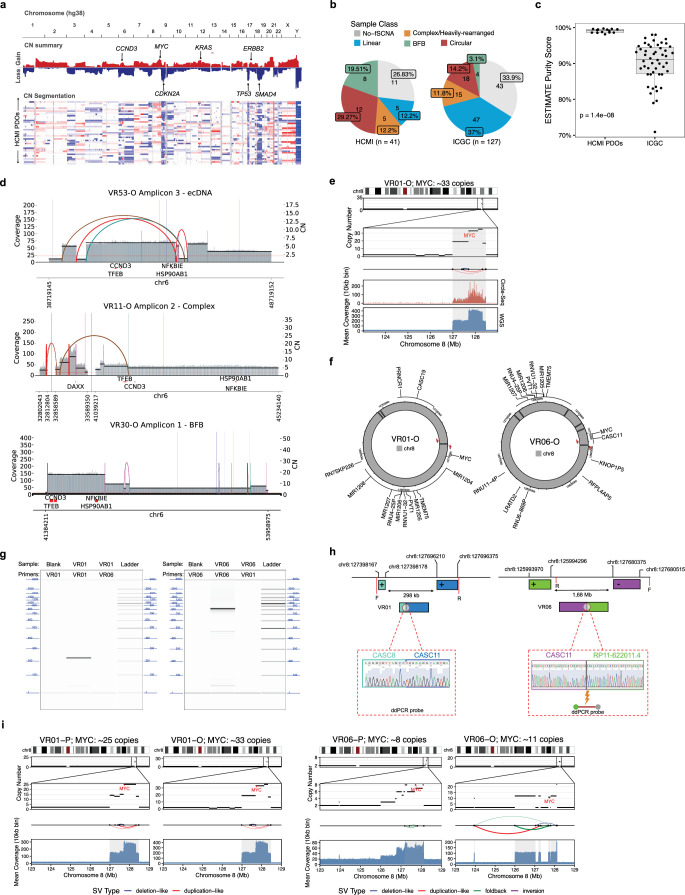
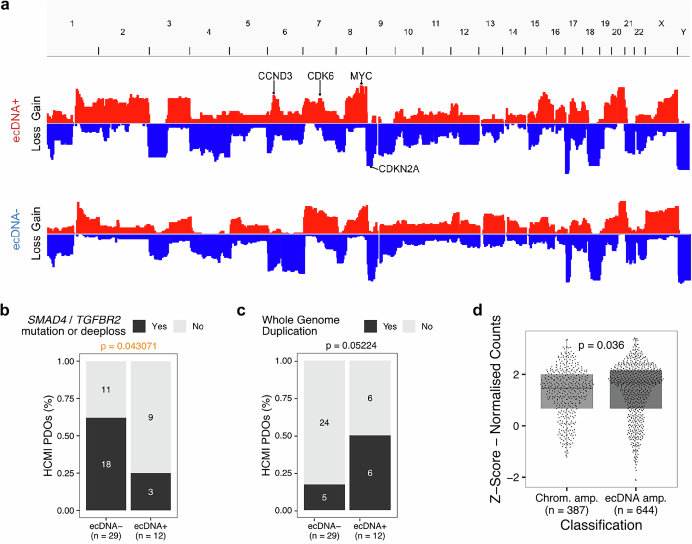
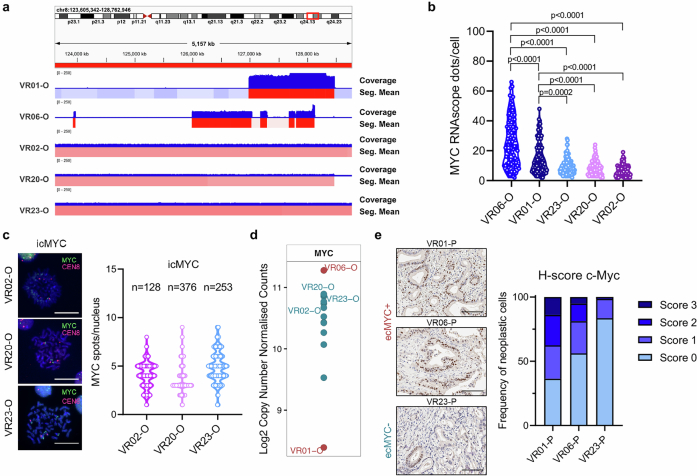
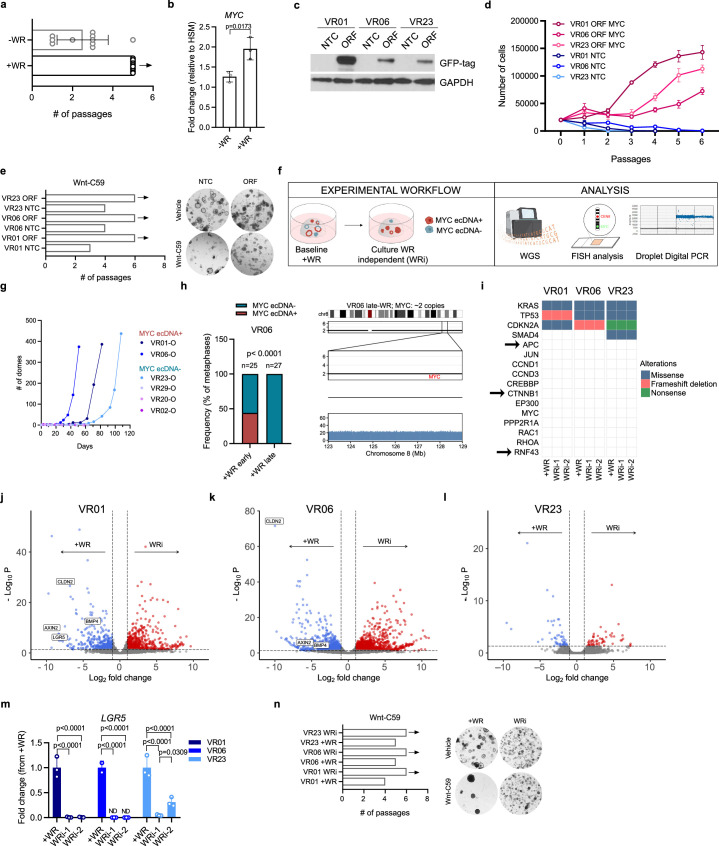
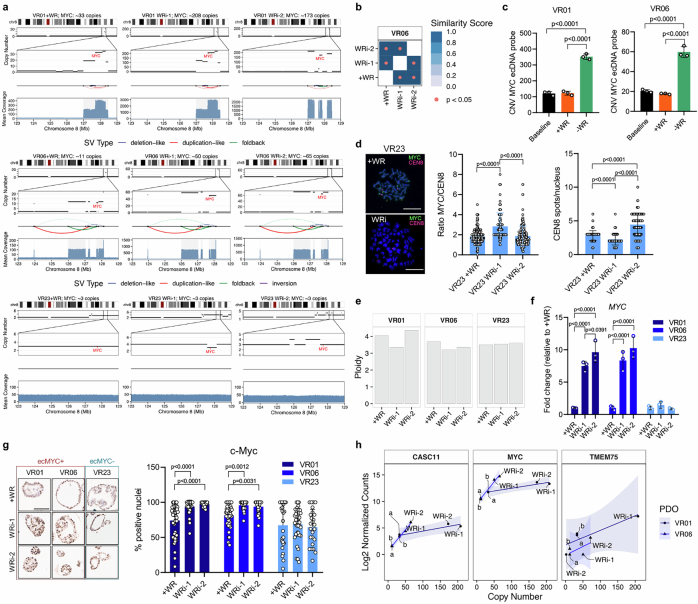
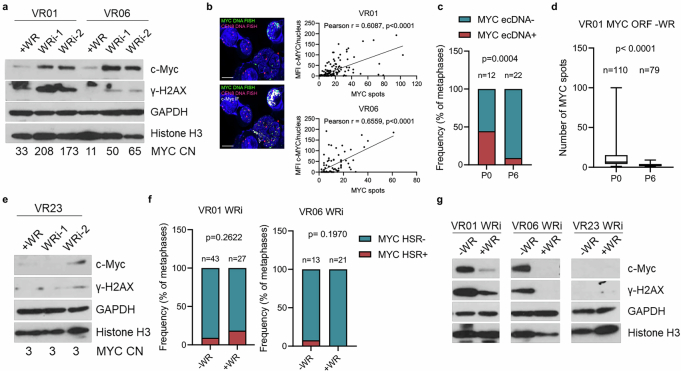
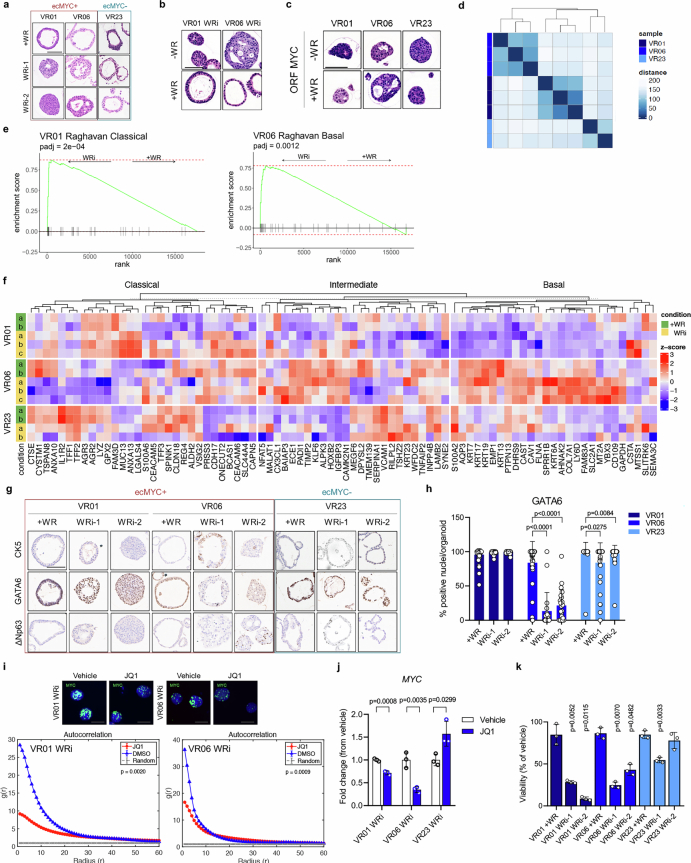
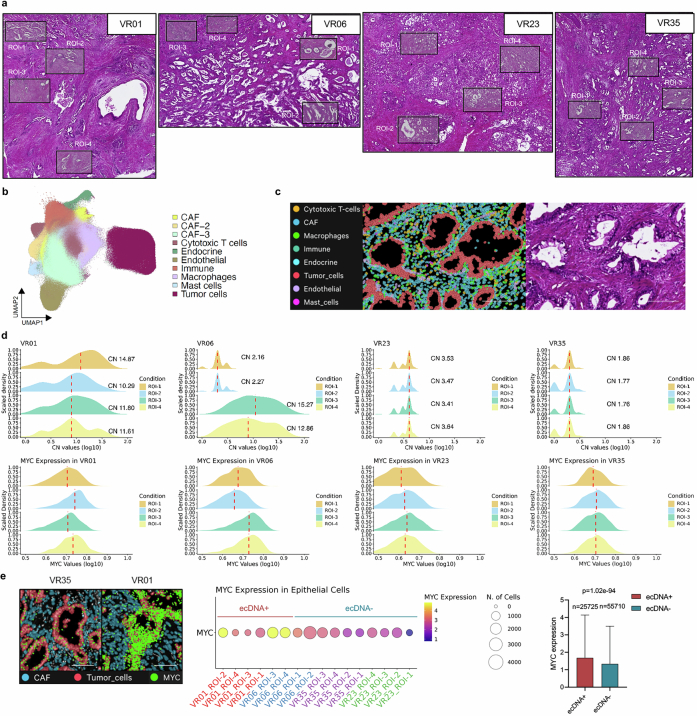
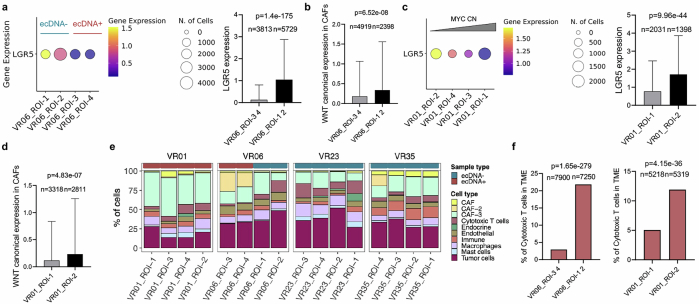
Intratumour heterogeneity and phenotypic plasticity drive tumour progression and therapy resistance1,2. Oncogene dosage variation contributes to cell-state transitions and phenotypic heterogeneity3, thereby providing a substrate for somatic evolution. Nonetheless, the genetic mechanisms underlying phenotypic heterogeneity are still poorly understood. Here we show that extrachromosomal DNA (ecDNA) is a major source of high-level focal amplification in key oncogenes and a major contributor of MYC heterogeneity in pancreatic ductal adenocarcinoma (PDAC). We demonstrate that ecDNAs drive varying levels of MYC dosage, depending on their regulatory landscape, enabling cancer cells to rapidly and reversibly adapt to microenvironmental changes. In the absence of selective pressure, a high ecDNA copy number imposes a substantial fitness cost on PDAC cells. We also show that MYC dosage affects cell morphology and dependence of cancer cells on stromal niche factors. Our work provides a detailed analysis of ecDNAs in PDAC and describes a new genetic mechanism driving MYC heterogeneity in PDAC.


Conflict of interest statement

Competing interests: The authors declare no competing interests.

Figures

Fig. 1
Fig. 1. Gene amplification landscape of PDAC.
a, AmpliconArchitect-based classification of PDOs. The number of amplicons for each sample is indicated. The pathological stage of patients at time of resection and the vital status at follow-up are colour coded. b, Genomic view of AmpliconArchitect-reconstructed amplicon structures spanning the MYC locus for the organoids with MYC ecDNA. Coverage depth, copy number segments and structural variant (SV) connections are shown. c, Circular plot showing amplicon regions identified in primary tumours (P) from four patients are retained in the matched organoids (O). d, Oncoplot showing the altered genes in PDOs classified as ecDNA+ (red) and ecDNA (blue). The types of alterations are colour and shape coded. Gain denotes copy number ≥3, loss indicates copy number ≤1, and deep loss refers to copy number ≤ 0.25. Fisher’s exact test (two-sided) was used to identify associations between genomic alterations in specific genes and ecDNA status. P < 0.1 is displayed, and significance (P < 0.05) is highlighted in orange. e, Lollipop plot showing gene set enrichment analysis on Hallmark pathways significantly enriched in ecDNA+ PDOs (n = 7) compared with ecDNA PDOs (n = 7). The P value was calculated using the multilevel splitting Monte Carlo approach. NES, normalized enrichment score. f, Boxplot showing the CX9 chromosomal instability signature enriched in ecDNA+ PDOs. The boxplots show the median (centre line), upper and lower quartiles (box limits), and 1.5× interquartile range (whiskers). n = 29 PDOs (ecDNA) and n = 12 PDOs (ecDNA+). Statistical significance was evaluated using a two-sided Wilcoxon rank-sum test. g, Gene set enrichment analysis of differentially expressed genes between ecDNA+ (n = 7) and ecDNA (n = 7) PDOs in the CIN70 transcriptomic signature. The P value was calculated using the multilevel splitting Monte Carlo approach. The red dashed lines indicate the maximum and the minimum of the enrichment score.
Fig. 2
Fig. 2. ecDNAs promote intratumour heterogeneity of MYC copy number in PDAC.
a, Representative FISH images validating the presence of MYC on ecDNA in VR01 and VR06 PDOs (left). Scale bars, 20 μm. The stacked barplot displays the frequency of ecDNA+ metaphases in VR01-O (n = 15) and VR06-O (n = 23) (middle). Quantification of MYC signals per metaphase (as a proxy for ecDNA copy number) in VR01-O and VR06-O (right). b, Representative FISH images of interphase nuclei of VR01-O and VR06-O (left). Scale bars, 20 μm. Quantification of MYC signals per nucleus as a proxy for ecDNA copy number in VR01-O (n = 238) and VR06-O (n = 227) (right). c, Interphase signal clustering by autocorrelation g(r). The P values were determined by two-sided Wilcoxon test at r = 0 compared with random distribution (grey). d, Representative FISH images of ecMYC-embedded organoids (left). Scale bars, 10 µm. Histograms show the distribution of MYC signals per cell in seven individual organoids from VR01-O, VR06-O and VR23-O (right). e, Genomic view of VR06 ecMYC segments (top; highlighted in grey) and the location of MYC and PVT1. The PVT1 starting region is absent on the VR06 ecMYC (arrow) (middle). MYC and PVT1 normalized expression values (Z score) of the two ecMYC PDOs (blue) compared with non-ecDNA-bearing cultures (white) (bottom). f, Representative FISH images of VR01 primary (VR01-P) and VR06-P tissues (left). Scale bars, 40 μm. Quantification of MYC spots per nucleus of VR01-P (n = 200) and VR06-P (n = 172) (right). Source data
Fig. 3
Fig. 3. ecMYC promotes adaptation to niche factor withdrawal.
a, PDOs, classified by MYC status, acquired independence from WNT agonists (WR; green; three independent repetitions). Amp, amplification. b, Days to WRi phenotype. Data are mean ± s.d. from three experiments. c, Lentiviral barcode proportions quantified from genomic DNA. Barcodes with a frequency above 10% are coloured. P0, parental culture. d, Structural difference between putative ecDNAs in VR01 WRi-1 and VR01 WRi-2 (left), and expression of genes on the ecDNAs (right). e, Metaphase FISH signals before (+WR) and after WRi emergence in VR01 (left). Scale bars, 20 μm. MYC ecDNA+ metaphase frequency at baseline (VR01 n = 24 and VR06 n = 23) and after WRi (two biological replicates; VR01 WRi-1 n = 29, VR01 WRi-2 n = 30, VR06 WRi-1 n = 20 and VR06 WRi-2 n = 18) (right). The P value was calculated using Fisher’s exact two-sided test. f, MYC copy number by ddPCR at baseline and following culture with (+WR) or without (−WR) WNT agonists. Data are mean ± s.d. of three biological replicates. The P value was calculated using one-way analysis of variance with Tukey’s multiple comparisons test. CNV, copy number variation. g, Interphase FISH signals before (+WR) and after WRi (left). Scale bars, 20 μm. The copy number measured by interphase FISH of 103 and 308 nuclei for VR01 (top right) and VR06 (bottom right), respectively, at baseline (+WR). For WRi cultures, VR01 WRi-1 n = 192, VR01 WRi-2 n = 136, VR06 WRi-1 n = 296 and VR06 WRi-2 n = 341. The P values were determined by Wilcoxon rank-sum two-sided test. The red dashed line indicates the median copy number state. h, EdU+ and EdU nucleus frequency in PDOs cultivated with (+WR) or without (−WR) WNT agonists (top). The P values were determined by Fisher’s exact two-sided test. MYC copies per nucleus stratified by EdU status (bottom). Data are mean ± s.d. The P values were determined by two-tailed Student’s t-test. Quantifications summarize the data from one experiment; nuclei analysed: VR01 +WR n = 136, VR01 −WR n = 197, VR06 +WR n = 121 and VR06 −WR n = 106. Source data
Fig. 4
Fig. 4. The fitness cost of an elevated ecDNA per cell content.
a, Representative immunofluorescence for MYC and γH2AX in the ecMYC organoid at baseline (left). Scale bars, 20 μm. Per-cell MYC and γH2AX mean fluorescent intensity (MFI) in PDO cultures (two-sided Pearson’s r; VR01 n = 105, VR06 n = 107 and VR23 n = 99) (right). b, Immunofluorescence for MYC and γH2AX in three conditions: +WR (baseline), WRi and ORF (exogenous MYC overexpression) (left). Scale bar, 10 µm. MYC and γH2AX expression per nucleus is also provided (middle and right, respectively). Data are mean ± s.d.; VR01 +WR n = 105, VR01 WRi n = 98, VR01 ORF n = 84, VR06 +WR n = 107, VR06 WRi n = 101, VR06 ORF n = 74, VR23 +WR n = 99, VR23 WRi n = 71 and VR23 ORF n = 91. The P values were determined by one-way analysis of variance with Tukey’s multiple comparisons test. c, Immuno-FISH for MYC ecDNA and EdU in WRi PDOs cultivated ±WNT agonists for 3 days (left). Scale bar, 10 μm. Frequency of EdU+ and EdU nuclei in each condition (middle). MYC copies per nucleus stratified by EdU status (right). Data are mean ± s.d. The P values were determined by two-tailed Student’s t-test. Quantifications from one experiment: VR01 WRi −WR n = 94, VR01 WRi +WR n = 50, VR06 WRi −WR n = 113 and VR06 WRi +WR n = 104. d, Schematic of the experiment (left). Representative FISH metaphase for VR01 WRi cultured in ±WR media for 30 days (middle). Scale bars, 20 μm. Frequency of MYC ecDNA+ metaphases (right): VR01 WRi −WR n = 43, VR01 WRi +WR n = 27, VR06 WRi −WR n = 13 and VR06 WRi +WR n = 21. The P values were determined by Fisher’s exact two-sided test. The schematic in panel d was created in BioRender. Corbo, V. (2025) https://BioRender.com/f18c396. e, Representative FISH interphases for WRi VR01 in ±WR media for 30 days (left). Scale bars, 20 μm. MYC spots per nucleus quantified for VR01 and VR06 WRi cultures (right). The boxplots show the median (centre line), upper and lower quartiles (box limits), and 1.5× interquartile range (whiskers). VR01 WRi −WR n = 158 cells, VR01 WRi +WR n = 312 cells, VR06 WRi −WR n = 118 cells and VR06 WRi +WR n = 221 cells. The P values were determined by Wilcoxon rank-sum two-sided test. f, VR01 (top) and VR06 (bottom) shifted MYC ecDNA copy number distribution following the reintroduction of WNT agonists for 30 days. The P values were determined by Wilcoxon rank-sum two-sided test. The red dashed line indicates the median copy number state. Source data
Fig. 5
Fig. 5. Spatial mapping of ecDNA-driven MYC amplifications and epithelial cell states.
a, Post-Xenium haematoxylin and eosin of VR06-P (top). The magnifications of ROI-1 (caret; bottom right) and ROI-3 (asterisk; bottom left) demonstrate the different morphology of the neoplastic epithelium. Scale bars, 100 µm. b, Interphase FISH of ROI-1 and ROI-3 from VR06-P (left). Scale bars, 20 µm. Distribution of MYC copy number (CN) states per nucleus with indication of the average MYC copy number per ROI (middle). The dashed red line indicates the median copy number state. In the two selected ROIs, the proportion of nuclei (ROI-1 n = 99 and ROI-3 n = 99) with MYC amplification (defined as copy number > 5) is shown (right). The P value was calculated using Fisher’s exact two-sided test. c, Interphase FISH of ROI-1 and ROI-2 from VR01-P (left). Scale bars, 20 µm. Distribution of MYC copy number states per nucleus with indication of the average MYC copy number per ROI (middle). The dashed red line indicates the median copy number state. In the two selected ROIs, the proportion of nuclei (ROI-1 n = 92 and ROI-2 n = 87) with MYC amplification (defined as copy number > 5) is also shown (right). The P value was calculated using Fisher’s exact two-sided test. d,e, Xenium spatial plots showing localization of LGR5 in the epithelial cells of the selected ROIs (left), and the frequency of epithelial cells expressing LGR5 (middle) and cancer-associated fibroblasts (CAFs) expressing canonical WNT ligands (right) in the selected ROIs from VR06 (d) and VR01 (e). The P values were determined by a Chi-squared test (two-sided). Scale bars, 200 µm. f, Xenium spatial plot showing localization of neoplastic cells classified as either classical or basal-like (left). Scale bars, 200 µm. Distribution of individual epithelial subtypes within the indicated ROIs for each tissue (right). Areas presenting MYC amplification or not are annotated on top. Source data
Extended Data Fig. 1
Extended Data Fig. 1. EcDNA based amplifications in PDAC.
a, Copy number (CN) analysis showing: top panel, CN frequency plot displaying the frequency of copy number gains (0.1) and losses (-0.1) observed across the genome (segmentation mean) for the HCMI PDOs (Verona cohort). Representative genes are shown on the plot at their genomic location; bottom panel, CN calls for individual samples. Red represents CN gain and blue represents CN loss. b, Pie charts showing proportion of primary tumours (ICGC) and PDOs (HCMI) falling in each sample class based on their existing amplicon types. If a sample contained multiple amplicons, it was classified based on the following order: Circular > BFB > Complex > Linear. If no amplicon was detected, the sample was classified as no-focal somatic copy number amplification detected (No-fSCNA). c, Distribution of ESTIMATE purity score in a subset of samples from the PDOs and the ICGC cohorts. The box plots show the median (centre line), upper and lower quartiles (box limits), and 1.5× interquartile range (whiskers). PDOs: n = 14; ICGC: n = 50. Statistical significance was evaluated using a two-sided Wilcoxon rank sum test. d, Structural variant (SV) view of AA reconstructed amplicon structures containing the CCND3 locus for three PDOs with different amplicon classifications. SV view shows coverage depth, copy number segments and discordant genomic connections (curves spanning copy number segments). e, Validation of the presence of MYC on ecDNA by Circle-Seq for VR01-O. f, Representative Circos plots showing amplicon regions identified by AA in VR01-O and VR06-O for the ecDNAs containing MYC. Red arrows indicate the interconnected breakpoints for which primer pairs were designed. g, Gel-like image showing the size-based separation of the regions spanning the interconnected breakpoints of the circular amplicons detected in VR01-O and VR06-O. The primer pairs used are indicated in panel f. h, Capillary sequencing traces generated from the purified products (displayed in g). The chromosomal coordinates and strand orientation of the two loci spanning the interconnected breakpoints are shown in the schematic (top panel). i, Copy number alterations on chromosome 8 with a focus on MYC region of primary tissues (P) and matched organoids (O) for VR01 (left) and VR06 (right). SVs that connect amplified regions and form ecDNAs are displayed below copy number levels. WGS Coverage is depicted at the bottom.
Extended Data Fig. 2
Extended Data Fig. 2. Extrachromosomal amplifications are associated with features of advanced disease.
a, CN frequency plot showing gains (red) and losses (blue) for ecDNA+ (n = 12) and ecDNA- (n = 29) organoids. CDKN2A was found to be lost in 10/12 ecDNA+ organoids in comparison to 14/29 ecDNA- organoids (p value = 0.0026). CCND3 gain was more common in ecDNA+ organoids (5/12) than ecDNA- organoids (1/29) (p value = 0.0053) and CDK6 gain was identified in 4/12 ecDNA+ and 2/29 ecDNA- organoids (p value = 0.05). Loss: copy number ≤ 1; Gain: copy number ≥ 3. P values were calculated using a two-sided Fisher’s exact test. b, Bar plot showing enrichment for SMAD4/TGFBR2 inactivating mutations or deep loss in ecDNA- HCMI PDOs. P value was calculated using a two-sided Fisher’s exact test c, Bar plot displaying enrichment of whole genome duplication in ecDNA+ HCMI PDOs. P value was calculated using a two-sided Fisher’s exact test. d, Boxplot showing normalised expression of genes (Z-scores) located on circular amplicons (ecDNA amp) or chromosomally amplified (chrom amp). The box plots show the median (centre line), upper and lower quartiles (box limits), and 1.5× interquartile range (whiskers). Chrom. Amp.: n = 387; ecDNA amp.: n = 644. Statistical significance was evaluated using a two-sided Wilcoxon rank sum test.
Extended Data Fig. 3
Extended Data Fig. 3. MYC copy number heterogeneity in PDAC.
a, Coverage and segmentation mean histograms spanning the MYC locus for the samples indicated. b, Quantification of mRNA expression, as number of dots/cells, in ecDNA+ (VR01-O, VR06-O) and ecDNA- (VR23-O, VR20-O, VR02-O) organoids. At least 100 individual cells per culture were analyzed. P values determined by One-way ANOVA, using the Sidak’s multiple comparison test. c, Representative FISH images of metaphases from icMYC PDOs. Scale bar: 20 μm (left). On the right, quantification of MYC copy-number per nucleus (number of nuclei analysed: VR02 n = 128, VR20 n = 376, VR23 n = 253). d, MYC expression values normalised by copy-number of ecMYC+ PDOs (red) and ecMYC- PDOs (blue). e, Representative immunohistochemistry for c-Myc in VR01, VR06, and VR23 patients’ primary tumours. Scale bar: 100 μm (left). Quantification is provided on the right as distribution of H-scores per tissue. At least 1000 cells were analysed for each case. Source data
Extended Data Fig. 4
Extended Data Fig. 4. Elevated MYC activity drives adaptation to a WNT deficient environment.
a, Bar plot showing mean ± SD of number of passages at which organoid cultures (n = 9) passaged every week with a splitting ratio of 1:3 in -WR media reach extinction, compared to +WR media. The arrow indicates that the culture could be propagated indefinitely. b, Changes in relative expression levels of MYC of starved organoids (HSM), after culture in -WR, and +WR media for 8 h. Results shown as mean ± SD of three biological replicates (VR01, VR02, and VR23). P value was determined by Student’s two tailed t-test. GAPDH was used as a housekeeping control gene to normalise results. c, Immunoblot analysis of GFP-tag in whole cell lysate of VR01-O, VR06-O and VR23-O transduced with NTC (non-targeting control) and a GFP-tagged Myc ORF (open reading frame). GAPDH was used as loading control. d, Cell proliferation of parental (NTC) and MYC overexpressing (ORF) cultures over six passages in -WR medium. Cells were passaged weekly, and cell counts were measured at each passage. Results are expressed as the mean ± SD of three technical replicates for each condition. e, Bar plot showing the number of passages at which each organoid culture could be propagated in the presence of Wnt-C59 (100 nm, PORCN inhibitor). The arrows indicate that the culture could be propagated indefinitely (left). Representative brightfield images of parental (NTC) and MYC overexpressing cultures (ORF) cultivated in the absence (vehicle) or in the presence (Wnt-C59) of the PORCN inhibitor (right). f, Schematic representation of the experimental workflow. Created in BioRender. Corbo, V. (2025) https://BioRender.com/v05m748. g, Growth curve of MYC ecDNA+ (n = 2) and MYC ecDNA- (n = 4) organoids in -WR media. Culture growth is represented as number of domes (50 μl Matrigel/dome). h, Frequency of ecDNA+ metaphases for VR06-O cultured in +WR medium at early (n = 25) and late passages (n = 27). P value as determined by two-sided Chi-square (left). Copy number alterations on chromosome 8 (with a focus on MYC region) of VR06 late passage after few passages in depleted media (-WR). WGS coverage is displayed below the copy number level (right). i, Oncoplot displaying absence of mutations in genes involved in WNT pathway that could explain the acquisition of WR independence of WRi organoids. The arrows indicate WNT pathway genes commonly altered in cancers. j-l, Volcano plots showing differentially expressed genes between parental and WRi cultures. Upregulated genes are showed as red dots (padj < 0.05 and log2foldchange > 1). Downregulated genes are showed as blue dots (padj < 0.05 and log2foldchange < -1). P adjusted is calculated by two-sided Wald test with Benjamini-Hochberg correction. Canonical WNT target genes are indicated. m, Changes in the relative expression levels of LGR5 in WRi organoids compared to parental cultures (+WR). Results shown as mean ± SD of three technical replicates. Significance was determined by Two-way ANOVA with Tukey’s multiple comparisons test. HPRT1 was used as a control. ND, not determined. n, Bar plot showing the number of passages at which each organoid could be propagated in the presence of Wnt-C59 (left). Representative brightfield images of parental (+WR) and WRi organoids cultured in the presence of Wnt-C59 (100 nM, PORCN inhibitor) or appropriate vehicle (right). Source data
Extended Data Fig. 5
Extended Data Fig. 5. Changes in MYC copy-number and expression following emergence of the WRi phenotype.
a, Copy number alterations on chromosome 8 with a focus on MYC region, of VR01-O (top), VR06-O (middle), and VR23-O (bottom) cultures at baseline (+WR) and following acquisition of the WRi phenotype (WRi, two biological replicates). SVs that connect amplified regions and form ecDNA and WGS Coverage are displayed below the copy number levels. b, Similarity score of the circular amplicons containing MYC for VR06-O cultures across conditions suggesting common origins for the structures. The p value was calculated by the similarity score program. c, Quantification of ecMYC copy-number by ddPCR for both VR01-O and VR06-O at baseline and following cultivation in medium supplemented with (+WR) or depleted of (-WR) WNT agonists. Data are presented as mean of 3 biological replicates ± SD. P values were calculated using One-way ANOVA with Tukey’s multiple comparisons test. d, Representative FISH metaphases of VR23-O at baseline (+WR) and after acquisition of the WRi phenotype. Scale bar: 20 μm (left). Bar plot showing the ratio of MYC signal over CEN8 (middle) and the number of CEN8 spots (right) in VR23 at baseline (n = 250) and after WR independence (two biological replicates: WRi-1 n = 101, WRi-2 n = 197). Data are presented as mean ± SD. P values by One-way ANOVA with Holm-Sidak’s multiple comparisons test. e, Ploidy analysis of organoids at baseline (+WR) and after acquisition of the WRi phenotype. Ploidy was assessed from the WGS data using AMBER, COBALT, and PURPLE in tumor only mode (https://github.com/hartwigmedical/hmftools). f, Changes in the relative expression levels of MYC in WRi organoids compared to parental cultures. Results shown as mean ± SD of three replicates. P value determined by Two-way ANOVA with Tukey’s multiple comparisons test. GAPDH was used as housekeeping control gene to normalise results. g, Representative immunohistochemistry for c-Myc of formalin-fixed paraffin-embedded organoids at baseline and adapted to grow in -WR media. Scale bar: 100 μm (left). Quantification is provided on the right as frequency of positive nuclei per organoid. A minimum of 25 organoids per sample were analysed. Data are presented as mean ± SD. P values determined by Two-way ANOVA with Tukey’s multiple comparisons test. h, Copy number and expression levels of the genes MYC, CASC11, and TMEM75, in parental (a, b) and WRi cultures. Grey area represents 95% confidence interval. Source data
Extended Data Fig. 6
Extended Data Fig. 6. Accumulation of ecDNA is associated with increased γH2AX foci.
a, Immunoblot analysis in whole cell lysate of ecMYC organoids at baseline (+WR) and following emergence of the WRi phenotype (2 biological replicates). GAPDH and Histone H3 were used as loading controls. MYC CN: WGS-based copy number. Conducted n = 1. b, Immuno-FISH analysis for MYC/CEN8 and MYC protein in ecDNA+ PDOs. Scale bar, 10 µm (left). Scatter plot showing the Pearson’s r correlation of MYC protein level and MYC copy-number. Individual nuclei were quantified (VR01 n = 146, VR06 n = 115). Two-tailed p value was obtained from r correlation test (right). c, The stacked bar plots show the changes in the frequency of MYC ecDNA+ metaphases of VR01-O overexpressing MYC following cultivation in WNT-depleted medium (P0: n = 12; P6: n = 22). P values determined by two-sided Chi-square. d, Quantification of MYC copy-number in VR01-O overexpressing MYC (ORF) following cultivation in WNT-depleted medium. The box plots show the median (centre line), upper and lower quartiles (box limits), and 1.5× interquartile range (whiskers). P0: n = 110, P6: n = 79. P values determined by Wilcoxon rank sum two-sided test. e, Immunoblot analysis of VR23-O at baseline (+WR) and following emergence of the WRi phenotype (2 biological replicates). GAPDH and Histone H3 were used as loading controls. MYC CN: WGS-based copy number. Conducted n = 1. f, Stacked bar plots showing changes in the frequency of HSR+ metaphases in VR01-O and VR06-O WRi following re-introduction of WNT agonists in the culture medium (VR01 WRi: -WR n = 43, +WR n = 27; VR06 WRi: -WR n = 13, +WR n = 21). P values determined by Fisher’s exact two-sided test. g, Immunoblot analysis in whole cell lysates of WRi cultures cultivated in the absence and presence (+WR) of WNT agonists. GAPDH and Histone H3 were used as loading controls. Conducted n = 1. Source data
Extended Data Fig. 7
Extended Data Fig. 7. Accumulation of ecDNA is associated with morphological and phenotypic changes.
a, Representative Haematoxylin and Eosin (H&E) staining of formalin-fixed paraffin-embedded organoids at baseline and after WRi. Scale bar: 100 μm. Conducted n = 3. b, Representative H&E staining demonstrating reversibility of morphological changes of WRi cultures following reintroduction of WNT agonists in the culture medium. Scale bars, 100 µm. Conducted n = 1. c, Representative H&E staining demonstrating the irreversibility of morphological changes induced by the acquisition of the WRi phenotype due to exogeneous overexpression of MYC (ORF). Scale bars, 100 µm. Conducted n = 1. d, Similarity heatmap based on the Euclidean sample distance. e, Gene set enrichment analysis (GSEA). Left panel, enrichment of Classical geneset computed over the ranked lists of VR01 differentially expressed genes, derived from the comparison of WRi and parental cultures. Right panel, enrichment of Basal geneset computed over the ranked lists of VR06 differentially expressed genes, derived from the comparison of WRi and parental cultures. P adjusted was calculated using Permutation test with Benjamini-Hochberg correction. f, Heatmap displaying the expression of Classical, Intermediate, and Basal genes from Raghavan et al. in parental and WRi organoids. g, Representative immunohistochemistry for cytokeratin 5 (CK5), GATA6, and ΔNp63 of parental (+WR) and WRi organoids. Scale bar: 100 μm. Quantification for GATA6 is provided in h as mean frequency ± SD of GATA6+ nuclei per organoid, at least 20 organoids were analysed for each condition. P values were calculated by Two-way ANOVA with Tukey’s multiple comparisons test. i, Representative FISH interphase nuclei of WRi organoids treated with JQ1 (500 nM) or appropriate vehicle control for 72 h showing reduction of MYC hubs upon treatment. Scale bar: 20 μm (top). Interphase signal clustering measured by autocorrelation g(r) in WRi cultures treated with JQ1 or vehicle (DMSO) for 72 h. P values determined by two-sided Wilcoxon test at r = 0. j, Changes in the relative expression levels of MYC in WRi organoids treated with JQ1 (500 nM) for 72 h. P value determined by Two-way ANOVA. Results shown as mean ± SD of three replicates. GAPDH was used as housekeeping control gene to normalise results. k, Bar plot showing mean of three technical replicates ± SD of cell viability of parental (+WR) and WRi organoids upon 72 h of JQ1 treatment (500 nM). P value determined by paired two-tailed Student’s t test. Source data
Extended Data Fig. 8
Extended Data Fig. 8. Integrated spatial transcriptomics and cytogenetic analysis of PDAC tissues.
a, Post Xenium H&E of 4 PDAC tissues with annotation of the regions of interest (ROIs) selected for analysis. b, UMAP plot showing the 10 annotated Xenium clusters. c, Spatial plot showing mapping of the annotated clusters (left) along with the post-xenium H&E (right). Scale bar, 100 µm. d, Distribution of MYC copy-number (top) and MYC expression levels (bottom) per cell in the 4 ROIs selected for each of the PDAC tissues. The average CN for each ROIs is provided. The red dashed line indicates the median value. e, Spatial plot showing localization and levels of MYC mRNA in tumor cells of VR35 (ecDNA-) and VR01 (ecDNA+). Scale bars, 100 µm (left). Bubble plot of the scaled average expression of MYC in epithelial cells. The colour intensity represents the expression level, and the size of the bubbles represents the percentage of expressing cells (middle). Quantification as mean ± SD MYC expression of cells in ecDNA+ (n = 25725) and ecDNA- (n = 55710) areas. P values determined by Wilcoxon test (two-sided) (right). Source data
Extended Data Fig. 9
Extended Data Fig. 9. Immune territory of MYC amplified cells.
a, Bubble plot of the scaled average expression of LGR5 in epithelial cells of VR06. The colour intensity represents the expression level, and the size of the bubbles represents the number of expressing cells (left). Quantification of LGR5 expression in epithelial cells is provided on the right as mean ± SD of ROIs 3 and 4 (n = 3813) and ROIs 1 and 2 (n = 5729) of VR06. P values determined by Wilcoxon test (two-sided). b, Quantification of the WNT canonical ligand expression in CAFs as mean ± SD in ROIs 3 and 4 (n = 4919) and ROIs 1 and 2 (n = 2398) of VR06. P values determined by Wilcoxon test (two-sided). c, Bubble plot of the scaled average expression of LGR5 in epithelial cells of VR01. The colour intensity represents the expression level, and the size of the bubbles represents the number of expressing cells (left). Quantification of LGR5 expression in epithelial cells is provided on the right as mean ± SD of ROI 1 (n = 2031) and ROI 2 (n = 1398) of VR01. P values determined by Wilcoxon test (two-sided) (right). d, Quantification of WNT canonical ligands expression in CAFs as mean ± SD of ROI 1(n = 3318) and ROI 2 (n = 2811) of VR01. P values determined by Wilcoxon test (two-sided). e, Frequency of the annotated cell types across selected ROIs for each PDAC tissue. Areas containing MYC amplified cells (ecDNA+) are indicated. f, Proportion of cytotoxic T cells (CD8 expressing cells) per case stratified by presence or absence of MYC amplification. Statistical significance by Chi square (two-sided).

Similar articles

Cited by

References

    1. Bielski, C. M. et al. Widespread selection for oncogenic mutant allele imbalance in cancer. Cancer Cell34, 852–862.e4 (2018). - PMC - PubMed
    1. Marusyk, A., Janiszewska, M. & Polyak, K. Intratumor heterogeneity: the Rosetta stone of therapy resistance. Cancer Cell37, 471–484 (2020). - PMC - PubMed
    1. Mueller, S. et al. Evolutionary routes and KRAS dosage define pancreatic cancer phenotypes. Nature554, 62–68 (2018). - PMC - PubMed
    1. Yi, E. et al. Live-cell imaging shows uneven segregation of extrachromosomal DNA elements and transcriptionally active extrachromosomal DNA hubs in cancer. Cancer Discov.12, 468–483 (2022). - PMC - PubMed
    1. Levan, G., Mandahl, N., Bregula, U., Klein, G. & Levan, A. Double minute chromosomes are not centromeric regions of the host chromosomes. Hereditas83, 83–90 (1976). - PubMed

Substances

LinkOut - more resources