

Construction of a prognostic risk model for clear cell renal cell carcinomas based on centrosome amplification-related genes
- PMID: 40075035
- PMCID: PMC11903526
- DOI: 10.1007/s00438-025-02237-7
Construction of a prognostic risk model for clear cell renal cell carcinomas based on centrosome amplification-related genes
Abstract
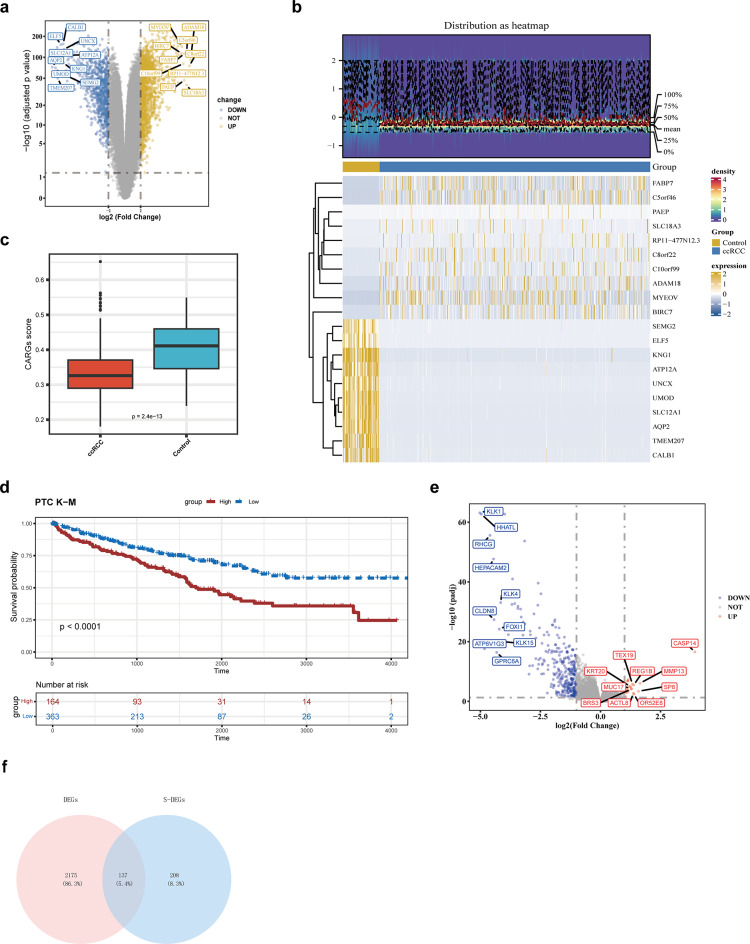
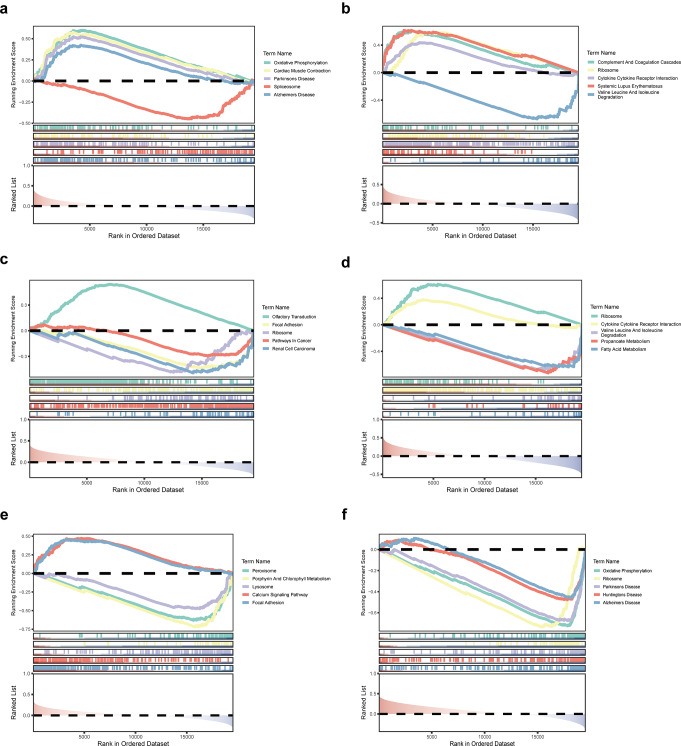
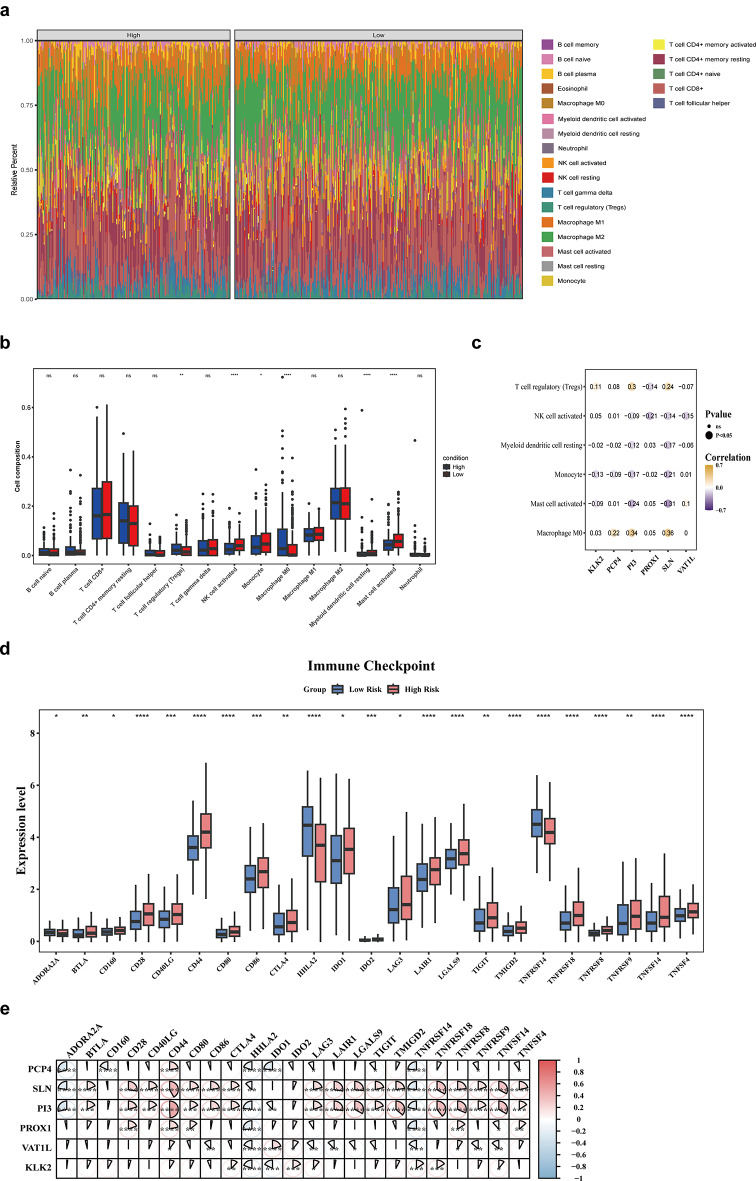
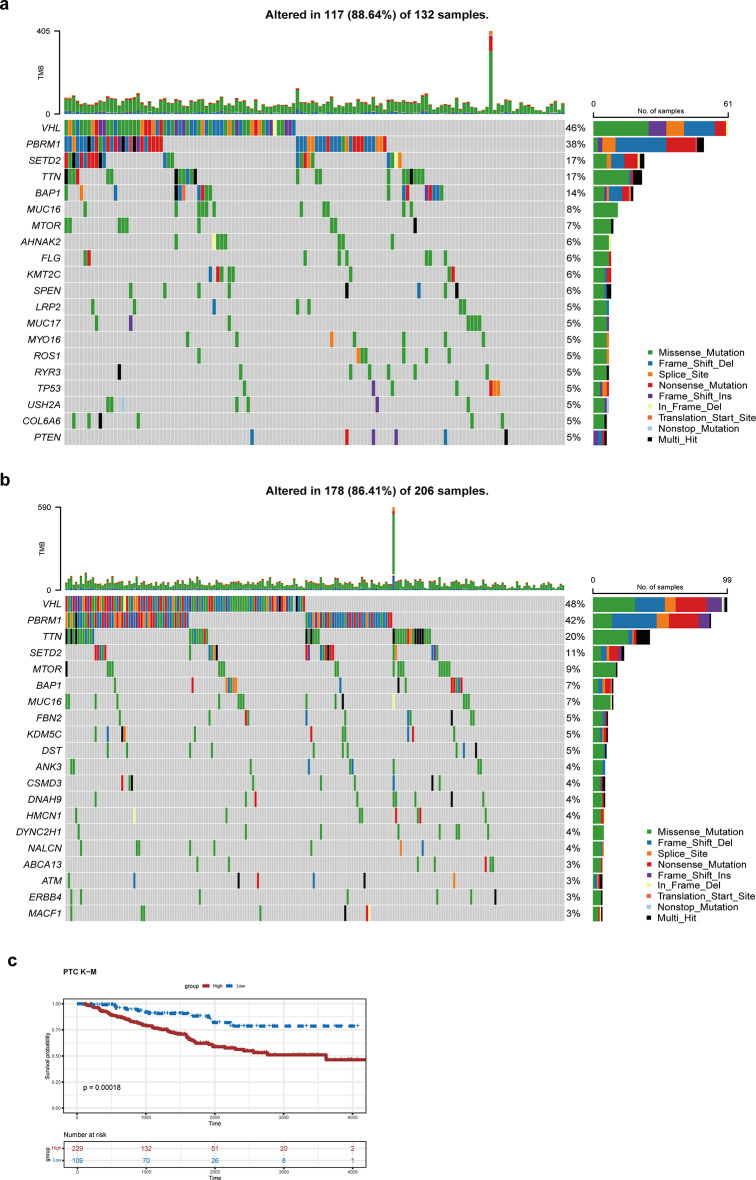
Clear cell renal cell carcinoma (ccRCC) is the urological malignancy with the highest incidence, centrosome amplification-associated genes (CARGs) have been suggested to be associated with carcinogenesis, but their roles in ccRCC are still incompletely understood. This study utilizes bioinformatics to explore the role of CARGs in the pathogenesis of ccRCC and to establish a prognostic model for ccRCC related to CARGs. Based on publicly available ccRCC datasets, 2312 differentially expressed genes (DEGs) were identified (control vs. ccRCC). Disease samples were classified into high and low scoring groups based on CARG scores and analysed for differences to obtain 345 DEGs associated with CARG scores (S-DEGs). 137 candidate genes were obtained by taking the intersection of DEGs and S-DEGs. Six prognostic genes (PCP4, SLN, PI3, PROX1, VAT1L, and KLK2) were then screened by univariate Cox, LASSO, and multifactorial Cox regression. These genes exhibit a high degree of enrichment in ribosome-associated pathways. Both risk score and age were independent prognostic factors, and the Nomogram constructed based on them had a good predictive performance (AUC > 0.7). In addition, immunological analyses identified 6 different immune cells and 23 immune checkpoints between the high- and low-risk groups, whereas mutational analyses identified frequent VHL mutations in both high- and low-risk groups. Finally, 93 potentially sensitive drugs were identified. In conclusion, this study identified six CARGs as prognostic genes for ccRCC and established a risk model with predictive value. These findings provide insights for prognostic prediction of ccRCC, optimisation of clinical management and development of targeted therapeutic strategies.
Keywords: Centrosome amplification-related genes; Clear cell renal cell carcinomas; Prognostic genes; Risk model.
© 2025. The Author(s).
Conflict of interest statement
Declarations. Ethical approval: Not applicable. Consent to participate: Not applicable. Consent to publish: Not applicable. Competing interests: The authors declare that the study was conducted in the absence of any commercial or financial relationship that could be viewed as a potential conflict of interest.
Figures


References
-
- Anderhub SJ, Krämer A, Maier B (2012) Centrosome amplification in tumorigenesis. Cancer Lett 322(1):8–17. 10.1016/j.canlet.2012.02.006 - PubMed
-
- Berenjeno IM, Piñeiro R, Castillo SD, Pearce W, McGranahan N, Dewhurst SM, Meniel V, Birkbak NJ, Lau E, Sansregret L, Morelli D, Kanu N, Srinivas S, Graupera M, Parker VER, Montgomery KG, Moniz LS, Scudamore CL, Phillips WA, Semple RK, Clarke A, Swanton C, Vanhaesebroeck B (2017) Oncogenic PIK3CA induces centrosome amplification and tolerance to genome doubling. Nat Commun 8(1):1773. 10.1038/s41467-017-02002-4 - PMC - PubMed
-
- Bose A, Dalal SN (2019) Centrosome amplification and tumorigenesis: cause or effect?? Results Probl Cell Differ 67:413–440. 10.1007/978-3-030-23173-6_18 - PubMed
-
- Brannon AR, Reddy A, Seiler M, Arreola A, Moore DT, Pruthi RS, Wallen EM, Nielsen ME, Liu H, Nathanson KL, Ljungberg B, Zhao H, Brooks JD, Ganesan S, Bhanot G, Rathmell WK (2010) Molecular stratification of clear cell renal cell carcinoma by consensus clustering reveals distinct subtypes and survival patterns. Genes Cancer 1(2):152–163. 10.1177/1947601909359929 - PMC - PubMed
MeSH terms
Substances
Grants and funding
LinkOut - more resources
Full Text Sources
Medical
Miscellaneous
