. 2025 Mar 12;16(1):2479.
doi: 10.1038/s41467-025-56628-w.

Mapping variants in thyroid hormone transporter MCT8 to disease severity by genomic, phenotypic, functional, structural and deep learning integration

Stefan Groeneweg #  1 Ferdy S van Geest #  1 Mariano Martín  2   3 Mafalda Dias  4   5 Jonathan Frazer  4   5 Carolina Medina-Gomez  6 Rosalie B T M Sterenborg  1   7 Hao Wang  8 Anna Dolcetta-Capuzzo  1 Linda J de Rooij  1 Alexander Teumer  9   10 Ayhan Abaci  11 Erica L T van den Akker  12 Gautam P Ambegaonkar  13 Christine M Armour  14 Iiuliu Bacos  15 Priyanka Bakhtiani  16   17 Diana Barca  18 Andrew J Bauer  19 Sjoerd A A van den Berg  20 Amanda van den Berge  1 Enrico Bertini  21 Ingrid M van Beynum  22 Nicola Brunetti-Pierri  23   24   25 Doris Brunner  26 Marco Cappa  27 Gerarda Cappuccio  23   28 Barbara Castellotti  29 Claudia Castiglioni  30 Krishna Chatterjee  31 Alexander Chesover  32   33 Peter Christian  34 Jet Coenen-van der Spek  35 Irenaeus F M de Coo  36 Regis Coutant  37 Dana Craiu  18 Patricia Crock  38 Christian DeGoede  39 Korcan Demir  11 Cheyenne Dewey  40 Alice Dica  18 Paul Dimitri  41 Marjolein H G Dremmen  42 Rachana Dubey  43 Anina Enderli  44 Jan Fairchild  45 Jonathan Gallichan  46 Luigi Garibaldi  47 Belinda George  48 Evelien F Gevers  49 Erin Greenup  50   51 Annette Hackenberg  44 Zita Halász  52 Bianka Heinrich  44 Anna C Hurst  53 Tony Huynh  54 Amber R Isaza  19 Anna Klosowska  55 Marieke M van der Knoop  56 Daniel Konrad  57 David A Koolen  35 Heiko Krude  58 Abhishek Kulkarni  59 Alexander Laemmle  60 Stephen H LaFranchi  61 Amy Lawson-Yuen  40   62 Jan Lebl  63 Selmar Leeuwenburgh  1 Michaela Linder-Lucht  64 Anna López Martí  1 Cláudia F Lorea  65   66 Charles M Lourenço  67   68 Roelineke J Lunsing  69 Greta Lyons  31 Jana Krenek Malikova  63 Edna E Mancilla  19 Kenneth L McCormick  50 Anne McGowan  31 Veronica Mericq  70 Felipe Monti Lora  71 Carla Moran  31 Katalin E Muller  72 Lindsey E Nicol  61 Isabelle Oliver-Petit  73 Laura Paone  74 Praveen G Paul  75 Michel Polak  76 Francesco Porta  77 Fabiano O Poswar  78 Christina Reinauer  79 Klara Rozenkova  63 Rowen Seckold  38 Tuba Seven Menevse  80 Peter Simm  81 Anna Simon  75 Yogen Singh  82   83 Marco Spada  77 Milou A M Stals  1 Merel T Stegenga  1 Athanasia Stoupa  76 Gopinath M Subramanian  38 Lilla Szeifert  52 Davide Tonduti  84   85 Serap Turan  80 Joel Vanderniet  38 Adri van der Walt  86 Jean-Louis Wémeau  87 Anne-Marie van Wermeskerken  88 Jolanta Wierzba  89 Marie-Claire Y de Wit  56 Nicole I Wolf  90   91 Michael Wurm  92 Federica Zibordi  93 Amnon Zung  94 Nitash Zwaveling-Soonawala  95 Fernando Rivadeneira  6 Marcel E Meima  1 Debora S Marks  4 Juan P Nicola  2 Chi-Hua Chen  8 Marco Medici  1 W Edward Visser  96
Affiliations

Mapping variants in thyroid hormone transporter MCT8 to disease severity by genomic, phenotypic, functional, structural and deep learning integration

Stefan Groeneweg et al. Nat Commun. .

Abstract

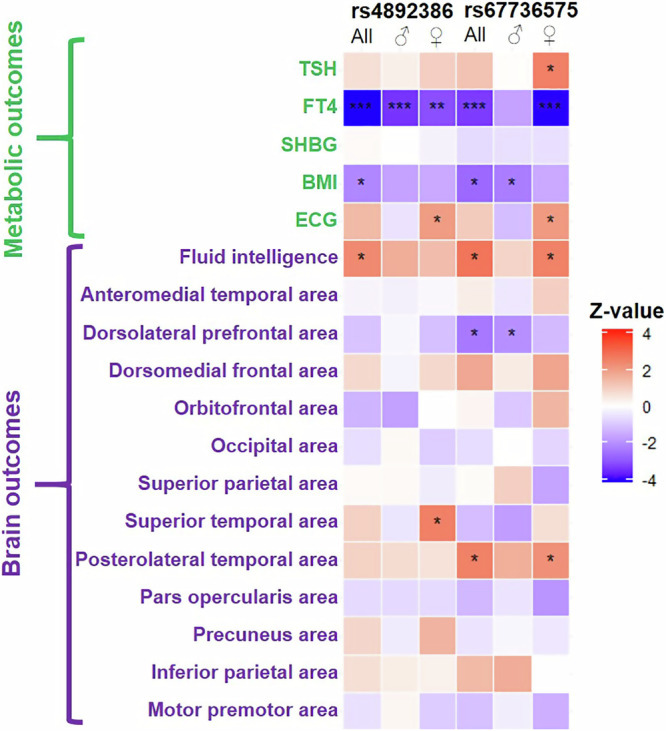
Predicting and quantifying phenotypic consequences of genetic variants in rare disorders is a major challenge, particularly pertinent for 'actionable' genes such as thyroid hormone transporter MCT8 (encoded by the X-linked SLC16A2 gene), where loss-of-function (LoF) variants cause a rare neurodevelopmental and (treatable) metabolic disorder in males. The combination of deep phenotyping data with functional and computational tests and with outcomes in population cohorts, enabled us to: (i) identify the genetic aetiology of divergent clinical phenotypes of MCT8 deficiency with genotype-phenotype relationships present across survival and 24 out of 32 disease features; (ii) demonstrate a mild phenocopy in ~400,000 individuals with common genetic variants in MCT8; (iii) assess therapeutic effectiveness, which did not differ among LoF-categories; (iv) advance structural insights in normal and mutated MCT8 by delineating seven critical functional domains; (v) create a pathogenicity-severity MCT8 variant classifier that accurately predicted pathogenicity (AUC:0.91) and severity (AUC:0.86) for 8151 variants. Our information-dense mapping provides a generalizable approach to advance multiple dimensions of rare genetic disorders.


Conflict of interest statement

Competing interests: The Erasmus Medical Center (Rotterdam, Netherlands), which employs SG, FSvG, RBTMS, ELTvdA, SAAvdB, IMvB, MHGD, SL, ALM, MTS, HvT, MdW, RvdW, MCYdW, MEM, MM and WEV receives royalties from Egetis Therapeutics (the manufacturer of Triac). None of the authors will benefit personally from any royalties. Egetis Therapeutics had no influence on the conduct or analysis of this study. The remaining authors declare no competing interests.

Figures

Fig. 1
Fig. 1. Overview of study and characteristics of the study cohort.
A Overview of workflow. (1) Meta-analysis of disease features in patients with MCT8 deficiency; (2) functional analysis of benign and disease-causing variants and mapping functional outcomes to disease manifestations; (3) genotype-phenotype analysis in non-affected populations; (4) evaluation of therapy effectiveness in different disease-severity classes; (5) alanine-scanning and in-depth functional characterization to map critical residues onto the protein structure; (6) disease variant and severity classifier. Dashed blue arrows between boxes indicate input for other packages. Created in BioRender. Visser, E. (2023) BioRender.com/c51c336. B Developmental, clinical, imaging and biochemical disease features in a meta-analysis of patients (n = 371) with MCT8 deficiency. Abbreviations: MRS, magnetic resonance spectroscopy; WMV, white matter volume; WML, white matter lesions; ALT, alanine aminotransferase; EEG, electroencephalogram; SHBG, sex-hormone binding globulin. C Overview of unique genetic mutations identified in the SLC16A2 gene, encoding MCT8, and investigated in this study. (left panel) deletions (lines) and splice site mutations (arrow heads) and (right panel) missense (circles), nonsense (triangles), indel (squares) and frameshift (diamonds) mutations. Mutations that occurred >1 in independent families are indicated with their frequency inside the symbol. Details of mutations are presented in Supplementary Fig. 3. D Schematic overview of the nature and functional impact of all tested missense, nonsense, frameshift and indel MCT8 variants. The inner ring indicates the proportion of the nature of variants (strongly transparent: missense variants; mildly transparent: nonsense variants; hardly transparent: frameshifts; not transparent: indels). The outer ring represents residual T3 transport capacity of all tested MCT8 variants shown as functional impact (0% = wild-type MCT8; 100% = no residual function; mean ± s.e.m.) in COS-1 cells. Data were derived from ≥3 experiments with technical duplicates. Red indicates exon 1; orange indicates exon 2; yellow indicates exon 3; green indicates exon 4; blue indicates exon 5; purple indicates exon 6; * common or rare SNPs in non-patients; # indicates a missense variant that also likely affects splicing.
Fig. 2
Fig. 2. Phenotypic and treatment outcomes in MCT8 deficiency linked to transport capacity of pathogenic MCT8 variants.
Phenotypic and treatment outcomes in MCT8 deficiency linked to transport capacity of pathogenic variants in transfected COS-1 cells (AJ and O), or patient-derived fibroblasts (K–M) Patients with MCT8 deficiency are stratified across different LoF classes of functional impact: residual T3 transport capacity in COS-1 cells: <20%, severe LoF (red); 20–40%, moderate LoF (orange), 40–75%, mild LoF (blue), and residual T3 transport capacity in patient-derived fibroblasts: <50%, severe LoF (red); 50–75%, mild LoF (blue). A, K Overall survival based on age at last follow-up (Kaplan-Meier estimates). B, L Gross Motor Function Measure (GMFM)-88, where 100% corresponds to motor development of a healthy 4-years-old child. C, M Ascertainment of developmental milestones. D Brain outcomes. E EEG-proven or clinical suspected seizures. F Clinical features of feeding status. G Premature atrial contractions (PACs) during 24 h cardiac monitoring. HJ Biochemical measurements. Serum concentrations of (H) T3 and (I) FT4 and (J) sex hormone binding globulin (SHBG). N Disease outcomes in patients treated with Triac. Five of the 85 patients with available treatment data (Supplementary Fig. 1) were excluded from the analyses as they harbored a splice-site variant. Changes from baseline to last available follow-up visit in serum concentrations of T3 (upper), heart rate-for-age (middle) and bodyweight-for-age (bottom). Median treatment duration was 22.4 months (range 2.0 – 74.5 months). * denotes patients with less than 2 years of treatment. Dashed lines represent reference intervals. For BM statistically significant differences between groups are denoted by * P < 0.05, ** P < 0.01, *** P < 0.001, **** P < 0.0001, # P < 0.1 with a Chi-squared test (CG, M), Kruskal-Wallis test followed by Dunn’s multiple comparisons test (B, H), unpaired t-test (L), one-way ANOVA followed by Tukey’s multiple comparisons test (I, J) and one-way ANOVA (N). Exact P values are provided in Supplementary Table 9. Source data are provided as a Source Data file.
Fig. 3
Fig. 3. Association of SNPs in SLC16A2 and relevant traits across the UKBiobank.
Association of rs4892386 and rs67736575 and different traits in participants of the UK Biobank was assessed using a multiple linear regression model with additive genetif effects, in sex-specific and joint –analyses. Multiple-testing adjustment was applied at 3 levels, nominal, with P < 0.05, denoted by *; categorical, denoted by **, for metabolic/thyrotoxic traits at P < 0.005 (5 traits), and for brain outcomes at P < 0.0019 (13 traits), and study-wise, with P < 0.0014 denoted by *** (18 traits). Exact P values are provided in Supplementary Table 5.
Fig. 4
Fig. 4. Structural and functional features of Ala variants.
A Functional impact of MCT8 Ala variants on T4 transport in JEG-3 cells, shown as functional reduction compared to WT (red: >90–100%, severe impact; orange: 60–90%, moderate impact; yellow:30–60%, mild impact; grey: 0–30% impact with wild-type MCT8 set as 0% impact). Grey box indicates boundaries for Ala scanning (Pro169–His575). B Color-coded mapping (see A) of functional impact identified through alanine scanning onto the MCT8 homology structure. (upper panel) frontal view and rear view of MCT8 and (lower panel) inside views (vertical section of frontal view) of the N-terminal (left) and C-terminal (right) halves. C Critical functional domains in MCT8: 1) residues at substrate binding center (red), 2) channel-facing residues out substrate binding center (orange), 3) residues supporting substrate-interacting residues in group 1) and 2) (magenta), 4) cluster 1 composed of TMD5 and TMD 8 (purple), 5) cluster 2 composed of TMD2 and TMD11 (dark blue), and 6) a linker region connecting clusters 1 and 2 (light blue), as well as 7) residual residues (side-chains indicated as sticks) and zoom-in of the linker region (group 6) composed of TMD4 (and partly by TMD10) connecting clusters 1 and 2, with residues color-coded according to (B). See Supplemental Figs. 21–25 for representation of all critical domains. D T4 vs T3 transport capacity in Ala variants indicates discordant transport for N193A. E Halogen-bonds between Asn193 and iodothyronines. Prior to arriving at the substrate binding center, the C5-iodine of T4 and the side-chain oxygen of Asn193 are in close structural proximity ( ~ 3.1 Å) with overlapping Van der Waals radii and an σ-hole angle of 130–150°, which is optimal for the formation of a halogen bond between an iodobenzene and the side-chain oxygen of Asn (Ref: ). Simultaneously, the σ-hole of the C5’-iodine is perpendicular to the side-chain nitrogen of Asn193 at a distance of 3.3 Å, allowing the formation of a second halogen-bond that directing the large outer ring of T4. F Transport of iodothyronines with (rT3 and T4) and without (3,3’-T2 and T3) saturated outer ring in COS-1 cells expressing WT or N193A MCT8 and CRYM. For all substrates, values are expressed relative to WT uptake levels (set at 100%). Data were derived from ≥3 experiments with technical duplicates. P values were calculated using one-way ANOVA with Tukey’s post-test, ** p < 0.005 *** p < 0.001 and **** p < 0.0001. Exact P values are provided in Supplementary Table 9. Source data are provided as a Source Data file.
Fig. 5
Fig. 5. Molecular characterization of patient mutants.
A T4 uptake capacity of all tested Ala variants (blue; ranked from 0% to 100% transport capacity), LoF patient variants (red), and benign non-synonymous missense variants (grey). Patients variants affecting residues within the grey box are likely pathogenic due to the loss of a critical native residue; patient variants affecting other residue are likely pathogenic due to the introduction of an unfavorable residue. B T4 uptake capacity in selected panel (dashed box in Fig. 5A) of Ala variants (blue), LoF patient variants (red) and artificial variants, where the native residue at the position of patient variants was replaced by a residue with similar properties (dark grey). C distribution of pathogenic variants identified in patients with MCT8 deficiency among the 12 transmembrane domains (TMDs) of MCT8. Variants were categorized based on residual T3 uptake in COS-1 cells with <20%, severe LoF (red); 20–40%, moderate LoF (orange); 40–75%, mild LoF (blue). D Exemplary mutations for different pathogenic mechanisms. (left panel) Like the patient variant D498N with normal membrane expression, there is complete LoF in artificial variant D498A but preserved transport capacity in artificial D498E which has similar properties, highlighting the critical role of the original residue. (right panel) In contrast to the complete LoF patient variant C283Y which has low membrane expression, transport capacity is largely preserved in the artificial variant C283A, highlighting the damaging effect of the substituent rather the loss of the native residue. T4 transport capacity (mean±s.e.m.) in JEG3 cells expressing WT (set as 100%) or mutant MCT8. Data were derived from ≥3 experiments with technical duplicates. P values were calculated using one-way ANOVA followed by Tukey’s multiple comparisons test; * p < 0.05, *** p < 0.001. Exact P values are provided in Supplementary Table 9. Source data are provided as a Source Data file. Immunoblot of total lysates and cell surface biotinylated fraction of COS-1 cells expressing WT or mutant MCT8. GAPDH was used as a loading and purity control. Immunocytochemistry in JEG-3 cells showing co-localization of MCT8 (green) and the membrane marker ZO-1 (red) for WT and mutant MCT8. Nuclei were stained with DAPI (blue). Scale bar corresponds to 15 uM. MCT8 homology model highlighting the affected residues (red) and the impact of the LoF patient variants (orange). Full data on all LoF patient variants is available in Supplemental Fig. 5.
Fig. 6
Fig. 6. MCT8 variant classifier for benign vs pathogenic and for different LoF classes.
A Design of the dual pathogenicity-severity MCT8 variant classifier. Pathogenicity of all variants is predicted by the first algorithm (MCT8 pathogenicity classifier); variants that are predicted pathogenic are segregated by the second algorithm in having mild or combined moderate and severe LoF, thereby assessing disease severity (MCT8 severity classifier). Created in BioRender. Visser, E. (2023) BioRender.com/s06h168. B Pathogenicity and severity prediction of all functionally evaluated variants by the unsupervised approached based on EVE; higher number denotes a stronger evolutionary constraint. Color and size of dots correspond to prediction by the dual pathogenicity-severity classifier. Dashed lines represent cut-off values for different LoF classes. C Performance of the MCT8 pathogenicity classifier for all functionally evaluated variants as shown by receiver operating characteristic (ROC) curve, with direct comparison to the unsupervised machine learning tool (EVE) and commonly used pathogenicity prediction tools. Validation of the classifier was done with a 10-fold cross-validation. AUPRC curves are presented in Supplementary Fig. 28a. D Performance of the MCT8 severity classifier for all functionally evaluated variants (that were predicted pathogenic in C as shown by receiver operating characteristic (ROC) curve, with direct comparison to EVE. Validation of the classifier was done with a 10-fold cross-validation. AUPRC curves are presented in Supplementary Fig. 28b. E Validation of the MCT8 pathogenicity classifier by functional evaluation of 11 novel patient variants and 6 random artificial variants. Green: wild-type function, red:pathogenic LoF (based on residual uptake capacity). F Validation of the MCT8 severity classifier by functional evaluation of the variants predicted pathogenic in E. Orange: mild LoF, dark red: moderate or severe LoF. G Predicted mutational landscape for MCT8. Example of predicted pathogenicity and severity of all variants on one transmembrane domain (region G161 to H192). The background shows a 2D structural model of MCT8, with colors indicating overall tolerability of missense variants in the amino acid residues in this region (red: no variants tolerated; green: all variants tolerated). The front shows the mutational landscape of amino acid residues in this domain (green: predicted benign; red: predicted pathogenic; yellow in red: predicted mild and moderate; brown in red: predicted severe; the size of the circle denotes the probability of correct prediction: larger circle, higher probability). Source data are provided as a Source Data file.

References

    1. Rehm, H. L. et al. ClinGen-the Clinical Genome Resource. N. Engl. J. Med372, 2235–2242 (2015). - PMC - PubMed
    1. Fagerberg, L., Jonasson, K., von Heijne, G., Uhlen, M. & Berglund, L. Prediction of the human membrane proteome. Proteomics10, 1141–1149 (2010). - PubMed
    1. Almeida, J. G., Preto, A. J., Koukos, P. I., Bonvin, A. & Moreira, I. S. Membrane proteins structures: A review on computational modeling tools. Biochim Biophys. Acta Biomembr.1859, 2021–2039 (2017). - PubMed
    1. Errasti-Murugarren, E., Bartoccioni, P. & Palacin, M. Membrane Protein Stabilization Strategies for Structural and Functional Studies. Membr. (Basel)11, 155 (2021). - PMC - PubMed
    1. Pires, D. E. V., Rodrigues, C. H. M. & Ascher, D. B. mCSM-membrane: predicting the effects of mutations on transmembrane proteins. Nucleic Acids Res48, W147–W153 (2020). - PMC - PubMed

Supplementary concepts