. 2025 Mar 12;16(1):134.
doi: 10.1186/s13287-025-04224-6.

Umbilical mesenchymal stem cells mitigate T-cell compartments shift and Th17/Treg imbalance in acute ischemic stroke via mitochondrial transfer

Affiliations

Umbilical mesenchymal stem cells mitigate T-cell compartments shift and Th17/Treg imbalance in acute ischemic stroke via mitochondrial transfer

Shuna Chen et al. Stem Cell Res Ther. .

Abstract

Background: Acute ischemic stroke (AIS) initiates secondary injuries that worsen neurological damage and hinder recovery. While peripheral immune responses play a key role in stroke outcomes, clinical results from immunotherapy have been suboptimal, with limited focus on T-cell dynamics. Umbilical mesenchymal stem cells (UMSCs) offer therapeutic potential due to their immunomodulatory properties. They can regulate immune responses and reduce neuroinflammation, potentially enhancing recovery by fostering a pro-regenerative peripheral immune environment. However, the effect of UMSCs on T-cell dynamics in AIS remains underexplored. This study investigates T-cell dynamics following AIS and examines how UMSCs may mitigate immune dysregulation to develop better treatment strategies.

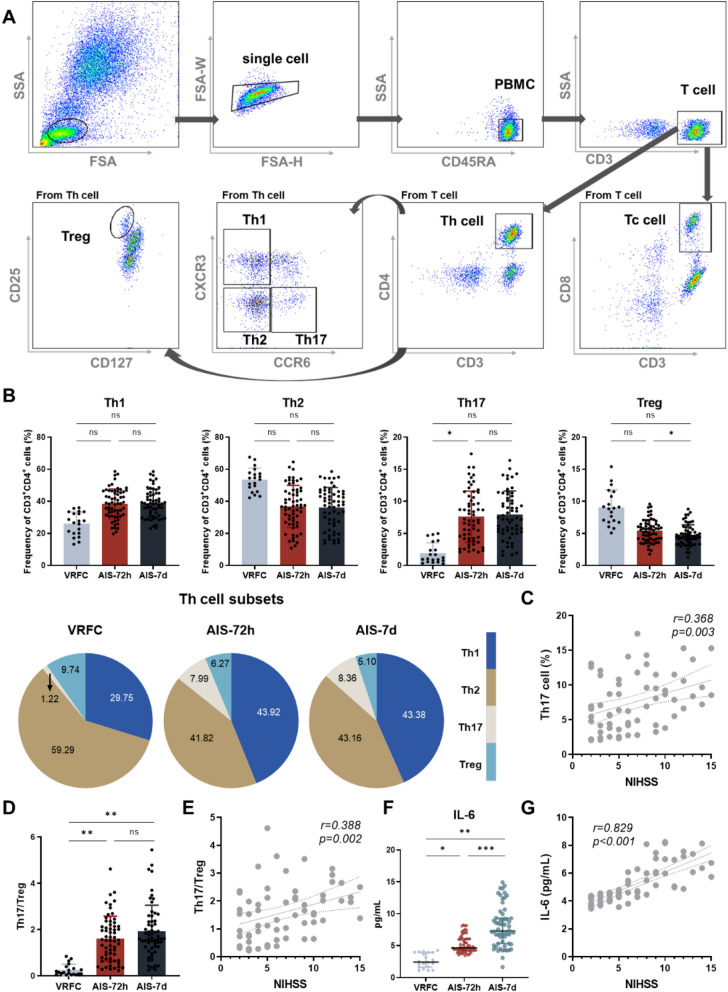
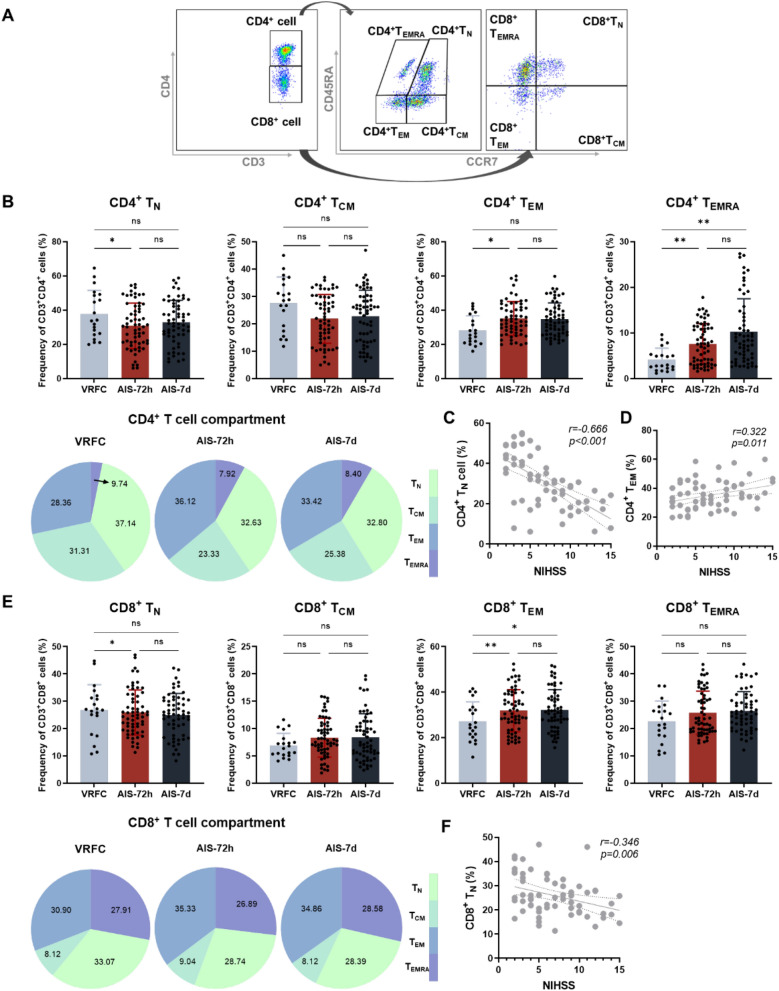
Methods: AIS patients (NIHSS scores 0-15) were recruited within 72 h of stroke onset, with peripheral blood samples collected on Day 0 (enrollment) and Day 7. T-cell compartments were identified by flow cytometry, and plasma cytokine levels were quantified using a cytometric bead array (CBA). Mitochondria in UMSCs were labeled with MitoTracker. Peripheral blood mononuclear cells from patients were isolated, treated with lipopolysaccharide (LPS), and cocultured with UMSCs in both direct contact and Transwell systems. Flow cytometry, CBA, RT-qPCR, and immunofluorescence assays were used to detect T-cell compartments, gene expression markers for helper T (Th) cell differentiation, cytokine profiles, mitochondrial transfer, reactive oxygen species (ROS) production, and mitochondrial membrane potential. Additionally, mitochondrial DNA in UMSCs was depleted. The effects of UMSCs and mitochondria-depleted UMSCs on ischemic stroke mice were compared through behavioral assessments and analysis of the peripheral immune microenvironment.

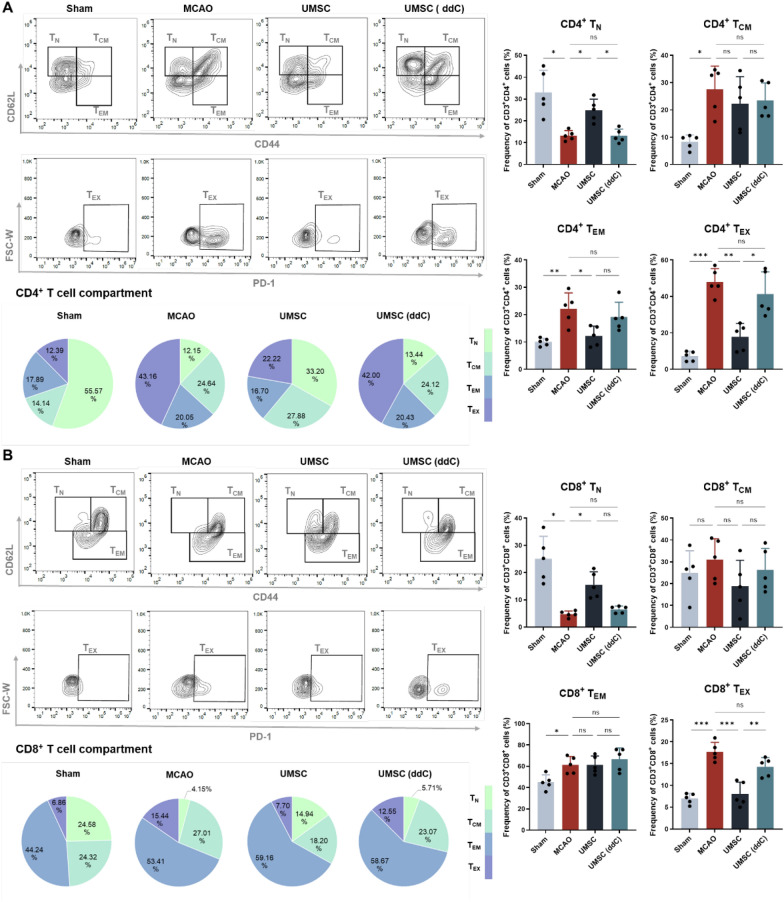
Results: In AIS, T-cell compartments underwent a phenotypic shift from naïve to effector or memory states, with a specific increase in Th17 cells and a decrease in regulatory T cells, leading to alterations in T-cell-mediated immune functions. In an ex vivo co-culture system, LPS stimulation further amplified these disparities, inducing mitochondrial dysfunction and oxidative stress in T cells. Notably, UMSCs restored mitochondrial function and reversed the shift in T-cell compartments through mitochondrial transfer. Critically, UMSC treatment significantly improved both neurological deficits and peripheral immune disorders in ischemic stroke mice, whereas mitochondria-depleted UMSCs failed to produce this effect.

Conclusions: Our comprehensive insights into the key attributes of T-cell compartments in acute ischemic stroke and the immune regulatory mechanisms of UMSCs provide a crucial theoretical foundation for understanding peripheral immune disorders in ischemic stroke and the therapeutic potential of UMSC treatment.

Keywords: Acute ischemic stroke; Mitochondrial transfer; T-cell compartment; Th17/Treg imbalance; Umbilical mesenchymal stem cells.


Conflict of interest statement

Declarations. Ethics approval and consent to participate: This study was conducted at the Stem Cell Clinical Research Center of the First Affiliated Hospital of Dalian Medical University. The study, titled "Clinical Study of Umbilical Cord Mesenchymal Stem Cell Therapy for Acute Ischemic Stroke" (No. YJ-GXB-2022-01, January 16, 2022), received ethical approval from the Ethics Committee of the First Affiliated Hospital of Dalian Medical University. The approval encompassed the isolation and preparation of human umbilical cord mesenchymal stem cells, the recruitment of patients with acute ischemic stroke, and the collection of their biological samples for research purposes. Written informed consent was obtained from all patients or their legally authorized representatives. The animal studies were approved by the Ethics Committee of the Animal Experiment Center of Dalian Medical University and conducted in accordance with the Guide for the Care and Use of Laboratory Animals of the National Institutes of Health. The approved project was titled "Investigation of the Effects of Stem Cells and Engineered Vesicles on Neurological Repair in Ischemic Stroke" (No. AEE23127, February 28, 2023). In addition, this work has been reported in line with the ARRIVE guidelines 2.0. There were no ethical conflicts associated with this manuscript. Consent for publication: Not applicable. Artificial intelligence (AI): The authors declare that they have not use AI-generated work in this manuscript" in this section. Competing interests: The authors declare that they have no competing interests.

Figures

Fig. 1
Fig. 1
Longitudinal analysis of T-cell subsets and cytokine concentrations in the peripheral blood of patients post-stroke. A Representative FACS plots showing the flow cytometric gating strategy used to identify T (CD3+), Th (CD3+CD4+) and Tc (CD3+CD8+) cells within the PBMC population, as well as Th1 (CXCR3+CCR6), Th2 (CXCR3CCR6), Th17 (CXCR3CCR6+) and Treg (CD25+CD127low) cells within the Th cell population. B Frequency and distribution of Th cell subsets among CD4+ T cells in VRFC and AIS patients. Data are represented as percentages of total CD4+ T cells. The pie chart shows the mean relative proportions of different Th cell subsets within the CD4+ T cell population in VRFC and AIS patients. C Correlation plots of the baseline Th17 cell percentage with NIHSS score. D Th17/Treg ratio in VRFC and AIS patients and its correlation with NIHSS score (E). F IL-6 concentrations in VRFC and AIS patients. G Correlation plots of the baseline IL-6 concentration with NIHSS score. Data in B and D are presented as scatter plots showing mean with SD, while data in F are presented as scatter plots showing median with IQR. For correlations, the regression line and standard error are shown. Statistical comparisons between AIS and VRFC patients were performed via generalized linear models, adjusting for age, sex, smoking, drinking, hypertension, and diabetes mellitus. Statistical comparisons between baseline and 7-day data among AIS patients were made using the Mann‒Whitney U test. Correlation analysis was conducted with Spearman’s rank correlation test. p values < 0.05 are considered statistically significant. ns indicates not significant or p ≥ 0.05; *p < 0.05, **p < 0.01, and ***p < 0.001. Abbreviations: PBMC, peripheral blood mononuclear cell; Th cell, helper T cell; Tc cell, cytotoxic T cell; Treg cell, regulatory T cell; IL, interleukin
Fig. 2
Fig. 2
Characterization of T-cell compartment dynamics post-stroke and their correlations with stroke severity. A Representative FACS plots showing the flow cytometric gating strategy used to identify T-cell compartments, including TN (CD45RA+CCR7+), TCM (CD45RACCR7+), TEM (CD45RACCR7), and TEMRA (CD45RA+CCR7) cells within CD4+ and CD8+ cells. B Frequency and distribution of T cell compartments among CD4+ T cells in VRFC and AIS patients. Data are represented as percentages of total CD4+ T cells. The pie chart shows the mean relative proportions of different T cell compartments within the CD4+ T cell population in VRFC and AIS patients. Correlation plots of the baseline CD4+ TN (C) and CD4+ TEM (D) cell frequency with NIHSS score. E Frequency and distribution of T cell compartments among CD8+ T cells in VRFC and AIS patients. Data are represented as percentages of total CD8+ T cells. The pie chart shows the mean relative proportions of different T cell compartments within the CD8+ T cell population in VRFC and AIS patients. F Correlation plots of the baseline CD8+ TN cell frequency with NIHSS score. Data in B and E are presented as scatter plots showing mean values with SD. For correlations, the regression line and standard error are shown. Statistical comparisons between AIS and VRFC patients were performed via generalized linear models (age, sex, smoking, drinking, hypertension, and diabetes mellitus were included in the model during analysis). Statistical comparisons between baseline and 7-day data among AIS patients were made using the Mann‒Whitney U test. Correlation analysis was conducted with Spearman’s rank correlation test. p values < 0.05 are considered statistically significant. ns indicates not significant or p ≥ 0.05; *p < 0.05, **p < 0.01, and ***p < 0.001. Abbreviations: TEMRA cell, terminally differentiated effector memory T cell; TEM cell, effector memory T cell; TCM cell, central memory T cell; TN cell, naïve T cell
Fig. 3
Fig. 3
UMSCs regulate LPS-induced Th-cell polarization and cytokine expression in PBMCs from AIS patients through a contact-dependent mechanism. A Schematic diagram of the ex vivo experimental setup. PBMCs were isolated from AIS patients within 3 d of stroke onset and then cocultured with UMSCs under LPS stimulation for 72 h. PBMCs and coculture supernatants were collected separately for cell phenotype identification and cytokine quantification. Experiments were conducted under both direct contact (CC) and indirect contact (TW) conditions (N = 6/group). B Frequency and distribution of Th cell subsets under LPS stimulation and UMSCs coculture. Data are represented as percentages of total CD4+ T cells. The pie chart shows the mean relative proportions of different Th cell subsets within the CD4+ T cell population under different coculture conditions. C Th17/Treg cell ratio under various coculture conditions. D Expression levels of key genes involved in Th cell differentiation under CC coculture conditions. Concentration of IL-6 (E), IL-10 (F), IL-17 (G), TNF-α (H), and IFN-γ (I) in different coculture systems. Statistical data are presented as scatter plots showing mean values with SD. Multiple data comparisons were performed using one-way ANOVA with the LSD post hoc test or Welch’s t-test with Dunnett’s post hoc test, while two-group comparisons were conducted using a t-test, with p < 0.05 considered statistically significant. *p < 0.05, **p < 0.01, and ***p < 0.001. Abbreviations: LPS, lipopolysaccharide; CC, contact coculture system; TW, Transwell coculture system; IFN-γ, interferon-gamma; TNF-α, tumor necrosis factor-alpha
Fig. 4
Fig. 4
UMSCs target LPS-induced T-cell compartments shift in PBMCs from AIS patients. Frequency and distribution of T cell compartments among CD4+ (A) and CD8+ (B) T cells under various coculture conditions. Data are represented as percentages of total CD4+ (A) and CD8+ (B) T cells. The pie charts show the mean relative proportions of different T cell compartments within the CD4+ (A) and CD8+ (B) T cell populations across different coculture systems. Statistical data are presented as scatter plots with mean values and SD. Comparisons were performed using one-way ANOVA with the LSD post hoc test or Welch’s t-test with Dunnett’s post hoc test, with p < 0.05 considered statistically significant. *p < 0.05, **p < 0.01, and ***p < 0.001
Fig. 5
Fig. 5
UMSCs transfer mitochondria to PBMCs in AIS patients and restore their mitochondrial function. PBMCs were isolated from AIS patients within 3 d of stroke onset and cocultured with MitoTracker-labeled UMSCs under LPS stimulation ex vivo for 72 h. The effects of UMSCs on MMP and ROS levels in PBMCs were assessed via JC-1 and ROS staining. Experiments were conducted under both direct contact (CC) and indirect contact (TW) conditions (N = 6/group). A, B Representative images of PBMCs following mitochondrial transfer in the coculture system. Violet: MitoTracker; blue: DAPI (cell nuclei); scale bars: 20 and 50 μm. B Merged image of stained exogenous mitochondria overlaid with visible microscopy under the CC coculture system. The black arrow indicates UMSCs, and the white arrow indicates PBMCs. C Representative flow cytometry plots and statistical graphs of mitochondrial fluorescence expression in T cells. D Fluorescence microscopy of PBMCs stained with JC-1 after coculture. The images depict JC-1 aggregates (red fluorescence), JC-1 monomers (green fluorescence), and merged images. The accumulation of JC-1 dye in the mitochondrial matrix results in red fluorescence; as the MMP decreases, JC-1 remains in its monomeric form, producing green fluorescence. E Quantified JC-1 fluorescence intensity data obtained through flow cytometry. F Fluorescence microscopy of PBMCs stained for ROS after coculture. The images show ROS (green fluorescence), DAPI (blue fluorescence), and merged images. G ROS levels measured by flow cytometry, presented as the percentage of ROS-positive cells (left) and the fluorescence intensity of ROS (right). Statistical data are presented as scatter plots with mean values and SD. T-tests (C) and the Welch T-test with Dunnett's post hoc test (E, G) were used for group comparisons, with p < 0.05 considered statistically significant. ns indicates not significant or p ≥ 0.05; *p < 0.05, **p < 0.01, and ***p < 0.001. Abbreviations: Pos: LPS stimulated; Neg: negative stimulated; Ctrl: control group (without UMSCs); ROS, reactive oxygen species; MFI, mean fluorescence intensity
Fig. 6
Fig. 6
Mitochondrial depletion abolishes the therapeutic effect of UMSCs on neurological deficits and peripheral immune microenvironment in MCAO mouse models. A RT-qPCR analysis of mtDNA expression in UMSCs during ddC depletion. B Experimental design for UMSCs treatment in experimental ischemic stroke. The experiment included four groups: sham surgery, MCAO, MCAO + UMSC treatment, and MCAO + UMSC (ddC) treatment (N = 5/group). Brain tissues were collected for TTC staining, spleens were harvested and weighed, and peripheral T cells and plasma were isolated for T cell phenotype and cytokine analysis. Data are presented as scatter plots with median values and IQR. Severity and recovery of sensorimotor deficits after cerebral focal ischemia were assessed using the Longa test (C) and cylinder test (D). (E) TTC staining of brain slices 3 days post-ischemia (white indicates the infarct area), with quantification of infarct volume based on relative proportion from TTC staining. F Comparison of spleen weights across different treatment groups. G Representative flow plot and frequencies of Tcell subsets in different treatment groups, expressed as percentages of total CD45+ cells. H Representative flow plot and frequencies of Th17 and Treg cells, expressed as percentages of total CD4+ T cells. I Comparison of Th17/Treg cell ratio among groups. J IL-6 concentration in different mouse model groups. K Flow histogram and ROS expression in total T cell across different groups. Except for additional annotations, data are presented as scatter plots with mean values and SD. Statistical comparisons were performed using repeated measures analysis of variance, one-way ANOVA with Tukey's post hoc test, Welch’s t-test with Dunnett’s post hoc test, or the Kruskal–Wallis test, with p < 0.05 considered statistically significant. *p < 0.05, **p < 0.01, and ***p < 0.001. Abbreviations: mtDNA, mitochondrial DNA; MCAO, middle cerebral artery occlusion
Fig. 7
Fig. 7
Mitochondrial depletion abrogates the effect of UMSCs on peripheral blood T cell compartments shift in MCAO mouse models. Representative flow plot, frequency, and distribution of T cell compartments among CD4+ (A) and CD8+ (B) T cells in different treatment groups. Data are represented as percentages of total CD4+ (A) and CD8+ (B) T cells. The pie charts show the mean relative proportions of different T cell compartments within the CD4+ (A) and CD8+ (B) T cell populations across different groups. Statistical data are presented as scatter plots with mean values and SD (N = 5/group). Comparisons were performed using one-way ANOVA with Tukey's post hoc test or Welch’s t-test with Dunnett’s post hoc test, with p < 0.05 considered statistically significant. *p < 0.05, **p < 0.01, and ***p < 0.001. Abbreviations: TEX cells, exhausted T cells

References

    1. Feigin VL, Stark BA, Johnson CO, Roth GA, Bisignano C, Abady GG, et al. Global, regional, and national burden of stroke and its risk factors, 1990–2019: a systematic analysis for the Global Burden of Disease Study 2019. Lancet Neurol. 2021;20(10):795–820. - PMC - PubMed
    1. Tu W-J, Wang L-D. China stroke surveillance report 2021. Mil Med Res. 2023;10(1):33. - PMC - PubMed
    1. Aguiar d -Sousa D, von Martial R, Abilleira S, Gattringer T, Kobayashi A, Gallofré M, et al. Access to and delivery of acute ischaemic stroke treatments: A survey of national scientific societies and stroke experts in 44 European countries. Eur Stroke J. 2019;4(1):13–28. - PMC - PubMed
    1. Phipps MS, Cronin CA. Management of acute ischemic stroke. BMJ. 2020;368:l6983. - PubMed
    1. Wassélius J, Arnberg F, von Euler M, Wester P, Ullberg T. Endovascular thrombectomy for acute ischemic stroke. J Intern Med. 2022;291(3):303–16. - PubMed

LinkOut - more resources