. 2025 Feb 27;17(5):832.
doi: 10.3390/cancers17050832.

Proteogenomic Profiling of Treatment-Naïve Metastatic Malignant Melanoma

Affiliations

Proteogenomic Profiling of Treatment-Naïve Metastatic Malignant Melanoma

Magdalena Kuras et al. Cancers (Basel). .

Abstract

Background: Melanoma is a highly heterogeneous disease, and a deeper molecular classification is essential for improving patient stratification and treatment approaches. Here, we describe the histopathology-driven proteogenomic landscape of 142 treatment-naïve metastatic melanoma samples to uncover molecular subtypes and clinically relevant biomarkers.

Methods: We performed an integrative proteogenomic analysis to identify proteomic subtypes, assess the impact of BRAF V600 mutations, and study the molecular profiles and cellular composition of the tumor microenvironment. Clinical and histopathological data were used to support findings related to tissue morphology, disease progression, and patient outcomes.

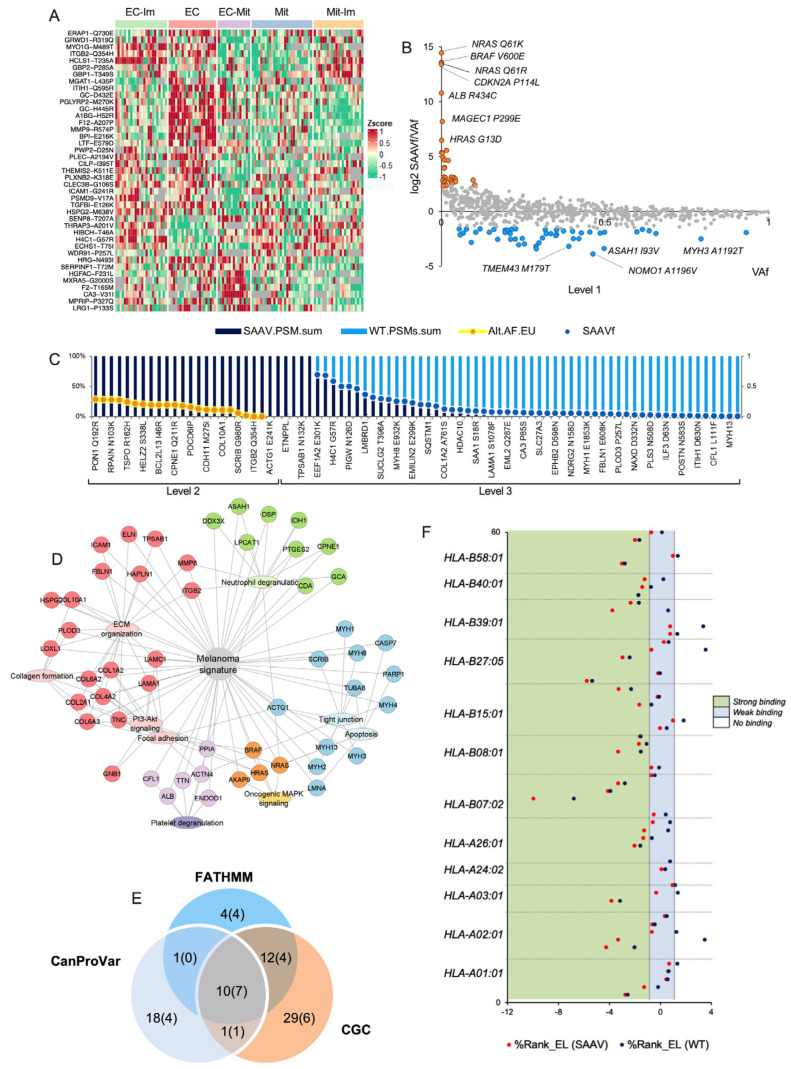
Results: Our analysis revealed five distinct proteomic subtypes that integrate immune and stromal microenvironment components and correlate with clinical and histopathological parameters. We demonstrated that BRAF V600-mutated melanomas exhibit biological heterogeneity, where an oncogene-induced senescence-like phenotype is associated with improved survival. This led to a proposed mortality risk-based stratification that may contribute to more personalized treatment strategies. Furthermore, tumor microenvironment composition strongly correlated with disease progression and patient outcomes, highlighting a histopathological connective tissue-to-tumor ratio assessment as a potential decision-making tool. We identified a melanoma-associated SAAV signature linked to extracellular matrix remodeling and SAAV-derived neoantigens as potential targets for anti-tumor immune responses.

Conclusions: This study provides a comprehensive stratification of metastatic melanoma, integrating proteogenomic insights with histopathological features. The findings may aid in the development of tailored diagnostic and therapeutic strategies, improving patient management and outcomes.

Keywords: BRAF V600E; histopathology; lymph node metastases; melanoma; proteogenomics; proteomics; single amino acid variants; stratification; subtypes; tumor microenvironment.


Conflict of interest statement

The authors declare no conflicts of interest.

Figures

Figure 1
Figure 1
Proteomic classification of metastatic melanoma. (A) Overview of tumors grouped according to the proteomic subtypes established in this study, annotated with the transcriptomic classifications and clinical and histological data. Heatmaps of the most variable proteins (top 500, FDR < 0.005), phosphosites (top 1000, FDR < 0.05), and transcripts (top 500, FDR < 0.05) based on ANOVA across the five proteomic subtypes and enriched pathways annotation. (B) Representative histological images of the proteomic subtypes, EC (pink), EC-Im (green), EC-Mit (purple), Mit (blue), and Mit-Im (yellow). (C) Distribution of the annotated histological parameters, tumor content, adjacent lymph node, lymphatic score, connective tissue, and necrosis among the five proteomic subtypes (Kruskal–Wallis and Dunn’s multiple comparisons test). (D) Sankey diagram showing the association between proteomic (this study) and published transcriptomic subtypes. The EC-Im subtype was significantly associated with the high-immune (FDR = 0.021) and immune (FDR = 0.0095) groups. The Mit-Im subtype was significantly linked to the pigmentation (FDR = 0.021) and the immune (FDR = 0.0021) groups. In comparison, the EC-Mit was significantly associated with the proliferative (p-value = 0.014) and the MITF-low (FDR = 0.026) groups. The Mit proteomic subtype was significantly linked to the keratin class (FDR = 0.040) from the TCGA classification. The EC subtype was associated with the proliferative (p-value = 0.0244) and the MITF-low (p-value = 0.032) groups. (E) Disease-specific survival (DSS, time from surgical intervention to death or censoring) probability for patients with tumors in subtypes associated with long and short survival.
Figure 2
Figure 2
Markers of melanoma and various phenotypic states among the five proteomic subtypes. (A) Protein expression of melanoma markers and markers of EMT in each subtype. In bold, melanoma markers commonly used in clinical practice using IHC. (B) Transcript expression of melanoma markers and markers of EMT in each subtype. In bold, melanoma markers commonly used in clinical practice using IHC. (C) Ratio comparison of the EMT markers CDH1 and CDH2 across the proteomic subtypes. (D) Ratio comparison of the EMT markers MITF and AXL across the proteomic subtypes. (E) Protein expression of the proliferation marker mki67 across the proteomic subtypes. (F) S100 protein expression across the proteomic subtypes. (G) Principal component analysis of the S100 protein expression. (H) Dysregulated, activated kinases across the proteomic subtypes.
Figure 3
Figure 3
Insights from studying BRAF V600E-mutated metastases. (A) Kaplan–Meier curves of BRAF V600 subgroups of patients. Subgroups colored by survival probabilities: red (high risk of mortality, n = 16), green (medium risk, n = 12), and blue (low risk, n = 21). Median survival times for the three groups are shown. (B) Status (alive/dead) distribution of BRAF patients after 1 to 5 years from sample collection. X-axis: patient distribution stratified according to mortality risk classification. The number of patients in which levels of mutated BRAF V600E protein could be quantified is indicated in yellow (low) and green (high). (C) Proteins from the most significant pathways enriched in the patients with BRAF mutation. Green and red indicate the decrease and increase of protein expression, respectively, in the high-mortality-risk group. (D) Histological features linked to BRAF mortality groups. (E) Significantly upregulated proteins (green) of the antigen processing and presentation pathway in the low-mortality-risk group compared to the medium-high-risk group. Identified proteins are shown in (grey). (F) Proteins and phosphorylation sites linked to cellular senescence and their expression patterns between the low- and medium-high mortality-risk groups. (G) Association between BRAF mortality groups and the five proteomic subtypes.
Figure 4
Figure 4
The landscape of SAAVs in melanoma. (A) Differentially expressed SAAVs across the proteomic subtypes. (B) Level 1 of the melanoma-associated SAAV signature defined in this study, with over-(orange) and under-(blue) represented SAAVs from what is expected based on SAAVf and Vaf ratio. (C) Proteomic evidence (#PSMs of wild-type and SAAV peptides) and genomic data (VAf) for Levels 2 and 3 of melanoma-associated SAAV signature defined in this study. (D) Melanoma-associated SAAV signature interconnections between corresponding proteins/genes and pathways, based on enrichment analysis using KEGG and the Reactome databases. (E) Overlap of the SAAVs and genes annotated by CanProvar and CGS or predicted by FATHMM as implicated in cancer. The numbers in parenthesis represent the melanoma-associated SAAV signature covered by these predictors. (F) Predicted affinity SAAV-neoantigen candidates per HLA, which ranked better than wild-type counterparts using NetMHC.
Figure 5
Figure 5
The tumor microenvironment composition is an independent prognostic marker in melanoma lymph node metastases. (A) ROCs of tumor-associated adjacent lymph node (top) and connective tissue (bottom) for DSS < or ≥3 years. (B) Adjacent lymph node (top, cut-off = 27%) and connective tissue (bottom, cut-off = 45.5%) content in the TME for the subgroups of samples generated from the ROC analysis. (C) Venn diagram of the patient overlap between the HLN and LCT groups and between the LLN and HCT groups. (D) DSS probability for patients with tumors grouped based on their content, HLN and LLN (top) or HCT and LCT (bottom). (E) Histological images from different tumor areas in the HLN and HCT groups. (F) Cell-specific signatures at protein (HLN.P and LLN.P) and transcript level (HLN.T and LLN.T) for the HLN and LLN groups. The displayed markers were significant in either the proteomic or transcriptomic analyses (t-test p-value < 0.05). Bold indicates significance in both. (G) 2D enrichment analysis displaying significant pathways (FDR < 0.001) commonly dysregulated on the proteomic and transcriptomic levels between the HLN and LLN groups.
Figure 6
Figure 6
ICA connects pathways with clinical and histopathological features. (A) Percentage of significant correlations between independent components (ICs) and clinical and histological features (p-value < 0.00001) for each omics dataset. IC showing the highest overall correlation percentage in each dataset is highlighted with a black contour. (B) Interconnections between proteins with an IC score > 2 and pathways based on enrichment analysis using the Reactome database (FDR < 0.05) for the ICs 48 (proteomics), 10 (phosphoproteomics), and 92 (transcriptomics). The green color scale of the protein nodes indicates their quartile (dark green corresponds to the highest protein score).
Figure 7
Figure 7
Association of protein marker expression with survival as the disease progression. (A) Visualization of different phases of melanoma showing the relationship between cancer biology and its clinical impact on survival. (B) Representative IHC staining images of markers expression in melanoma and stromal cells of primary tumors. (C) Significant differences found in marker expression associated with OS. (D) Kaplan–Meier survival analyses displaying OS rates for patients in association with high (green) and low (red) expression of the markers in melanoma and stroma cells. (E) Significant differences of the protein markers in pairs of matching primary melanomas and corresponding lymph node metastases. *, **, and *** above the bar plots indicate significant p-values of <0.05, <0.001, and <0.0001, respectively.

References

    1. Thomas D., Bello D.M. Adjuvant immunotherapy for melanoma. J. Surg. Oncol. 2021;123:789–797. doi: 10.1002/jso.26329. - DOI - PubMed
    1. Boussios S., Rassy E., Samartzis E., Moschetta M., Sheriff M., Pérez-Fidalgo J.A., Pavlidis N. Melanoma of unknown primary: New perspectives for an old story. Crit. Rev. Oncol. Hematol. 2021;158:103208. doi: 10.1016/j.critrevonc.2020.103208. - DOI - PubMed
    1. Bertolotto C. Melanoma: From melanocyte to genetic alterations and clinical options. Scientifica. 2013;2013:635203. doi: 10.1155/2013/635203. - DOI - PMC - PubMed
    1. Grzywa T.M., Paskal W., Wlodarski P.K. Intratumor and Intertumor Heterogeneity in Melanoma. Transl. Oncol. 2017;10:956–975. doi: 10.1016/j.tranon.2017.09.007. - DOI - PMC - PubMed
    1. Willmore-Payne C., Holden J.A., Hirschowitz S., Layfield L.J. BRAF and c-kit gene copy number in mutation-positive malignant melanoma. Hum. Pathol. 2006;37:520–527. doi: 10.1016/j.humpath.2006.01.003. - DOI - PubMed

LinkOut - more resources