. 2025 Mar 1;17(5):852.
doi: 10.3390/cancers17050852.

Spatial Transcriptomics Reveals Novel Mechanisms Involved in Perineural Invasion in Pancreatic Ductal Adenocarcinomas

Affiliations

Spatial Transcriptomics Reveals Novel Mechanisms Involved in Perineural Invasion in Pancreatic Ductal Adenocarcinomas

Vanessa Lakis et al. Cancers (Basel). .

Abstract

Background: Pancreatic ductal adenocarcinoma (PDAC) has a high incidence of perineural invasion (PNI), a pathological feature of the cancer invasion of nerves. PNI is associated with a poor prognosis, local recurrence and cancer pain. It has been suggested that interactions between nerves and the tumor microenvironment (TME) play a role in PDAC tumorigenesis.

Methods: Here, we used Nanostring GeoMx Digital Spatial Profiler to analyze the whole transcriptome of both cancer and nerve cells in the microenvironment of PNI and non-PNI foci from 13 PDAC patients.

Conclusions: We identified previously reported pathways involved in PNI, including Axonal Guidance and ROBO-SLIT Signaling. Spatial transcriptomics highlighted the role of PNI foci in influencing the immune landscape of the TME and similarities between PNI and nerve injury response. This study revealed that endocannabinoid and polyamine metabolism may contribute to PNI, cancer growth and cancer pain. Key members of these pathways can be targeted, offering potential novel research avenues for exploring new cancer treatment and/or pain management options in PDAC.

Keywords: MGLL; SAT1; nerve; pain; perineural invasion; spatial transcriptomics.


Conflict of interest statement

The authors declare no conflicts of interest.

Figures

Figure 1
Figure 1
Representative images of regions collected in this study. (a) H&E image of sample used in this study with circled regions containing PNI and cancer or nerves (non-PNI). (bd) Black squares in specimen indicate regions selected for GeoMx. (e) Zoomed image of region selected in H&E in (b) (PNI region). (f) Same region presented in (e), showing GeoMx DSP ROI and segmented AOIs in terms of PanCK and PGP9.5 positivity for collection of tags. Cancer (arrowhead) and nerve (arrow) compartments in PNI focus. (g) H&E of cancer compartment (non-PNI) indicated in (c) (square), cancer away from any visible nerve. (h) GeoMx DSP ROI showing segmented AOI in terms of PanCK positivity (purple) for collection of tags. (i) H&E image of uninvolved nerve (non-PNI) away from tumor microenvironment indicated in (d) (square), with no visible cancer invasion. (j) GeoMx DSP of collected ROI. Regions (ej) are examples of regions where gene expression was measured; selection of regions was based on visual inspection of adjacent H&E and PanCK or PGP9.5 positivity for collection of expression tags.
Figure 2
Figure 2
Expression measured in 74 regions collected by DSP GeoMx. (a) Principal component analysis (PCA) of normalized expression of regions profiled in cancer and nerve compartments that pass QC (n = 74). Gene counts showed separations of cancer and nerve regions. Each dot represents expression of region profiled and is colored by location in PNI or non-PNI foci. Circles indicate 95th percentile of expression. (b) PCA, same data presented in (a), colored by patient from whom samples were collected. (c) Normalized expression of full ROIs collected from nerve compartments (n = 17) in PNI or non-PNI foci. PCA separated nerves with PNI from non-PNI (without visual signs of invasion). (d) Same data presented in (c), colored by patient from whom samples were collected. (e) Normalized expression of AOIs (areas segmented by PanCK positivity) collected from cancer compartments (n = 40) in PNI or non-PNI foci. (f) Same data presented in (e), colored by patient from whom samples were collected.
Figure 3
Figure 3
Differentially expressed genes and pathways enriched in cancer compartment of PNI foci. (a) Volcano plot showing differentially expressed genes in PNI cancer compartment compared with non-PNI foci. Each dot represents gene, with red dots indicating genes significantly up-regulated (adjusted p-value < 0.20 and fold change > 1.4), dark blue dots indicating genes that are significantly down-regulated (adjusted p-value < 0.20 and fold change < −1.4) and black dots indicating genes differentially expressed (adjusted p-value < 0.20) with fold change between −1.4 and 1.4. Pink and light blue dots are genes with fold change >1.4 and fold change < −1.4, respectively, but are not statistically significant (adjusted p-value > 0.20). Dotted lines represent threshold for statistical significance (adjusted p-value < 0.20) and threshold for fold change (fold change > 1.4 or <−1.4). Gene symbols for some significantly differentially expressed genes are shown (for complete list, see Table S3). (b) Pathways predicted to be activated or inhibited by up-regulated genes in PNI cancer compartment (n = 288), (for full list of pathways, see Table S4). Pathways were obtained using IPA and up-regulated genes. (c) MGLL gene expression in cancer AOIs (PanCK-positive) in PNI and non-PNI regions (adjusted p = 0.091). (d) SAT1 gene expression in cancer AOIs (PanCK-positive) in PNI and non-PNI regions (adjusted p = 0.035).
Figure 4
Figure 4
Immunohistochemistry (IHC) for MGLL. (a) Representative histology (H&E staining) images of regions selected to measure immunoreactivity of MGLL in cancer cells in PNI and non-PNI foci. Arrow indicates nerve. IHC double immunofluorescence of morphological regions selected with PanCK and MGLL staining. (b) Mean intensity of MGLL in PanCK-positive regions (PNI and non-PNI foci). (c) Number of cells detected/region. (d) Percentage of cells with positive expression of MGLL. IHC was performed in 8 PDAC samples and quantification of MGLL immunoreactivity performed in 59 regions (31 PNI and 28 non-PNI). Indicated p-values from T-test.
Figure 5
Figure 5
Differentially expressed genes and pathways enriched in nerve compartment of PNI foci. (a) Volcano plot showing differentially expressed genes in PNI nerve compartment compared with non-PNI foci. Each dot represents gene, with red dots indicating genes that are significantly up-regulated (adjusted p-value < 0.20 and fold change > 1.4), dark blue dots indicating genes that are significantly down-regulated (adjusted p-value < 0.20 and fold change < −1.4) and black dots indicating genes that are significantly differentially expressed (adjusted p-value < 0.20) with fold change between −1.4 and 1.4. Pink and light blue dots are genes with fold change > 1.4 and fold change < −1.4, respectively, but are not statistically significant (adjusted p-value > 0.20). Dotted lines represent threshold for statistical significance (adjusted p-value < 0.20) and threshold for fold change (fold change > 1.4 or <−1.4). Gene symbols for significantly differentially expressed genes are shown (for complete list, see Table S5). (b) Pathways predicted to be activated by up-regulated genes (n = 178) (for full list of pathways, see Table S6). Pathways were obtained using IPA. (c) Normalized gene expression of Nestin (NES) (adjusted p = 0.009). (d) GAP43’s normalized expression in nerves with PNI and non-PNI evidence (adjusted p = 0.025).
Figure 6
Figure 6
Immunohistochemistry (IHC) of Nestin. (a) Representative histology (H&E staining) images of regions selected to measure immunoreactivity of Nestin in nerves with PNI and non-PNI foci. Arrow indicates nerve fibers. IHC double immunofluorescence of morphological regions selected in H&E with Nestin and S100 staining. (b) Mean intensity of Nestin in S100-positive regions in nerve areas in PNI and non-PNI foci. (c) Number of cells detected/region. (d) Percentage of cells with positive expression of Nestin. IHC was performed in 7 PDAC samples and quantification performed in 41 regions (25 PNI and 16 non-PNI). Indicated p-values from T-test.
Figure 7
Figure 7
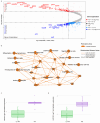
Receptor–ligand expression in cancer and nerve compartments in PNI and non-PNI foci. Scatterplots of normalized gene expression of significant differentially expressed ligand–receptor pathways (LPRs), obtained using BulkSignalR (adjusted p value < 0.20) with superimposed linear model line. (a) EPHA2 (receptor) and EFNA1 (ligand) expression in cancer compartment of PNI (purple) and non-PNI (green). (b) BMPR2 (receptor) and GDF7 (ligand) expression in nerve compartment of PNI (purple) and non-PNI (green). (c) CD47 (receptor) and THBS2 (ligand) expression in nerve compartment of PNI (purple) and non-PNI (green).

References

    1. Mizrahi J.D., Surana R., Valle J.W., Shroff R.T. Pancreatic cancer. Lancet. 2020;395:2008–2020. doi: 10.1016/S0140-6736(20)30974-0. - DOI - PubMed
    1. Park W., Chawla A., O’Reilly E.M. Pancreatic Cancer: A Review. JAMA. 2021;326:851–862. doi: 10.1001/jama.2021.13027. - DOI - PMC - PubMed
    1. Selvaggi F., Melchiorre E., Casari I., Cinalli S., Cinalli M., Aceto G.M., Cotellese R., Garajova I., Falasca M. Perineural Invasion in Pancreatic Ductal Adenocarcinoma: From Molecules towards Drugs of Clinical Relevance. Cancers. 2022;14:5793. doi: 10.3390/cancers14235793. - DOI - PMC - PubMed
    1. Ceyhan G.O., Bergmann F., Kadihasanoglu M., Altintas B., Demir I.E., Hinz U., Muller M.W., Giese T., Buchler M.W., Giese N.A., et al. Pancreatic neuropathy and neuropathic pain—A comprehensive pathomorphological study of 546 cases. Gastroenterology. 2009;136:177–186. doi: 10.1053/j.gastro.2008.09.029. - DOI - PubMed
    1. Jurcak N., Zheng L. Signaling in the microenvironment of pancreatic cancer: Transmitting along the nerve. Pharmacol. Ther. 2019;200:126–134. doi: 10.1016/j.pharmthera.2019.04.010. - DOI - PMC - PubMed

LinkOut - more resources