Review
. 2025 Feb 25;15(5):553.
doi: 10.3390/diagnostics15050553.

Water Hammer Phenomenon in Coronary Arteries: Scientific Basis for Diagnostic and Predictive Modeling with Acoustic Action Mapping

Affiliations
Review

Water Hammer Phenomenon in Coronary Arteries: Scientific Basis for Diagnostic and Predictive Modeling with Acoustic Action Mapping

Khiem D Ngo et al. Diagnostics (Basel). .

Abstract

Background: In the study of coronary artery disease, the mechanisms underlying atherosclerosis initiation and progression or regression remain incompletely understood. Our research conceptualized the cardiovascular system as an integrated network of pumps and pipes, advocating for a paradigm shift from static imaging of coronary stenosis to dynamic assessments of coronary flow. Further review of fluid mechanics highlighted the water hammer phenomenon as a compelling analog for processes in coronary arteries. Methods: In this review, the analytical methodology employed a comprehensive, multifaceted approach that incorporated a review of fluid mechanics principles, in vitro acoustic experimentation, frame-by-frame visual angiographic assessments of in vivo coronary flow, and an artificial intelligence (AI) protocol designed to analyze the water hammer phenomenon within an acoustic framework. In the analysis of coronary flow, the angiograms were selected from patients with unstable angina if they had previously undergone one or more coronary angiograms, allowing for a longitudinal comparison of dynamic flow and phenomena. Results: The acoustic investigations pinpointed pockets of contrast concentrations, which might correspond to compression and rarefaction zones. Compression antinodes were correlated to severe stenosis, due to rapid shifts from low-pressure diastolic flow to high-pressure systolic surges, resulting in intimal injury. Rarefaction antinodes were correlated with milder lesions, due to de-escalating transitions from high systolic pressure to lower diastolic pressure. The areas of nodes remained without lesions. Based on the locations of antinodes and nodes, a coronary acoustic action map was constructed, enabling the identification of existing lesions, forecasting the progression of current lesions, and predicting the development of future lesions. Conclusions: The results suggested that intimal injury was likely induced by acoustic retrograde pressure waves from the water hammer phenomenon and developed new lesions at specifically exact locations.

Keywords: acoustics; antinode; compression zone; coronary acoustic action map; coronary lesion; fluid mechanics; nodes; pressure wave reflection; rarefaction zone; water hammer.


Conflict of interest statement

The authors declare no conflicts of interest.

Figures

Figure 1
Figure 1
Flowchart of the analysis-combined-investigation review.
Figure 2
Figure 2
The left anterior descending (LAD) artery exhibits severe narrowing in its proximal segment (indicated by an arrow), while the right coronary artery (RCA) demonstrates a subtotal lesion in its mid-segment. Current angiographic techniques capture these lesions but fail to provide critical insights into their formation mechanisms or potential progression over time. (A) The lesion in the proximal LAD has a characteristic “rat tail” appearance—featuring progressively severe narrowing in the distal direction. (B) The mid-RCA lesion has a “reversed rat tail” pattern, characterized by more severe narrowing proximally and a gradual reduction in severity distally. WHY?
Figure 3
Figure 3
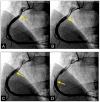
(AD) Laminar flow. These four coronary images are of consecutive sequence. (A) This is the angiogram of the right coronary artery (RCA), which is filled with contrast in black. (B) The blood (in white) is seen well organized with sharp border and a pointed tip, typical for laminar flow, moving in (yellow arrow). (C,D) The blood is seen following the apex of the curves (yellow arrow). This is the laminar flow following the curves in a helical fashion.
Figure 4
Figure 4
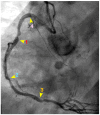
This is the angiogram of the right coronary artery. The lesions are at locations 1, 2, and 3. Why is the lesion at 1 more severe than the ones at 2 and 3? Why is the lesion at 2 less severe than 1 and 3? Why is there no lesion in 4? Could fluid mechanics and acoustics explain the mechanism of formation and growth of the lesions at these specific locations?
Figure 5
Figure 5
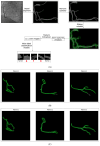
(A) Artificial intelligence algorithm to segment the arteries and the catheter. (B) Window size = 10 pixels. (C) Window size = 15 pixels. (D) Window size = 20 pixels.
Figure 5
Figure 5
(A) Artificial intelligence algorithm to segment the arteries and the catheter. (B) Window size = 10 pixels. (C) Window size = 15 pixels. (D) Window size = 20 pixels.
Figure 6
Figure 6
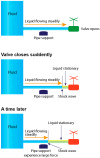
A water hammer event occurs when there is an abrupt change in velocity or flow direction in the pipe systems such as power failure, pump start-up, and shut-down operations as a pressure wave propagates backward in the pipe [2].
Figure 7
Figure 7
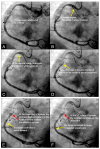
(AD) Collision in the right coronary artery. This is a series of eight consecutive images of an angiogram of the right coronary artery (RCA) separated by a 0.067 s gap. (A) The artery is filled with contrasts. There is a moderate lesion at the mid-segment. (B) The blood (white) is seen entering the ostium of the RCA (arrow). This is the beginning of diastole. (C) The blood (white) is seen at the outer border of the first curve of the RCA (yellow arrow). (D) The blood (white) moves to the mid-segment of the RCA (yellow arrow). (EH)ollision during the transition from diastole to systole. (E,F) The blood is seen reaching the mid-segment of the RCA (yellow arrow) at the end of diastole and beginning of systole. Here, the blood (white) is mixed with the contrast (black), seen as a random, disorganized flow (mixed of black and white) This is the visual image of disorganized, turbulent flow (red arrow). (G) The contrast (black) concentrates at the mid-segment, at the collision line (red arrow). The antegrade flow still moves forward slowly (yellow arrow). (H) The blood is seen reaching the beginning of the distal segment (yellow arrow). The turbulent flow (mixing black contrast and white blood) is still seen prominently at the collision site (red arrow).
Figure 7
Figure 7
(AD) Collision in the right coronary artery. This is a series of eight consecutive images of an angiogram of the right coronary artery (RCA) separated by a 0.067 s gap. (A) The artery is filled with contrasts. There is a moderate lesion at the mid-segment. (B) The blood (white) is seen entering the ostium of the RCA (arrow). This is the beginning of diastole. (C) The blood (white) is seen at the outer border of the first curve of the RCA (yellow arrow). (D) The blood (white) moves to the mid-segment of the RCA (yellow arrow). (EH)ollision during the transition from diastole to systole. (E,F) The blood is seen reaching the mid-segment of the RCA (yellow arrow) at the end of diastole and beginning of systole. Here, the blood (white) is mixed with the contrast (black), seen as a random, disorganized flow (mixed of black and white) This is the visual image of disorganized, turbulent flow (red arrow). (G) The contrast (black) concentrates at the mid-segment, at the collision line (red arrow). The antegrade flow still moves forward slowly (yellow arrow). (H) The blood is seen reaching the beginning of the distal segment (yellow arrow). The turbulent flow (mixing black contrast and white blood) is still seen prominently at the collision site (red arrow).
Figure 8
Figure 8
As the coronary artery is modeled as a tubular structure, the ostium of the coronary artery is an open end. As result, the flow will reverse as a rarefaction pulse, which has less concentrated particles.
Figure 9
Figure 9
Pressure wave reflections in short artery. A water hammer event can occur in the coronary arteries when there is an abrupt change in velocity or flow direction due to sudden contraction of the left ventricle, creating a pressure shockwave reflecting at the speed of sound. The short length of a tube or an artery can result in a higher frequency of pressure oscillations, which is also called vibration.
Figure 10
Figure 10
(A,B) Calcification without flow limiting lesion. (A) The proximal segment of the left anterior descending (LAD) artery was well calcified (arrows), while the mid and distal segment were spared. (B) In the same view, the angiogram of the proximal segment of the LAD shows no severe lesion. Prolonged mild to moderate turbulence without high cholesterol level causes only injuries to the intima, leading to heavy calcification without forming atherosclerotic plaques.
Figure 11
Figure 11
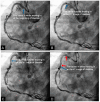
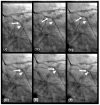
(AH) This is a series of six consecutive images of an angiogram of the right coronary artery (RCA) right after stenting of the mid-segment. The baseline images before stenting are in Figure 7. (A) The artery is filled with contrasts. (B) The blood (white) is seen entering the ostium of the RCA (arrow). This is the beginning of diastole. (CH) The blood (white) moves forward without encountering the retrograde pressure wave. Most likely the arterial wall is scaffolded by the stent which interrupts the propagation of retrograde pressure wave on the arterial wall.
Figure 12
Figure 12
The particles of air are in equilibrium, evenly spaced in a random pattern (adapted from reference [26]).
Figure 13
Figure 13
When a pressure wave passes by, the air particles are concentrated in zones of high density (compression), alternating with areas of moderate density (rarefaction). The zones of compression depict high pressure and turbulence. The zone of rarefaction has lower pressure fluctuation, and therefore, less turbulence.
Figure 14
Figure 14
This is a conceptual schema of air particles when a pressure wave passes by, producing zones of high concentration of particles (compression) or moderate level of concentration (rarefaction). These zones of antinodes depict high pressure. The zone of nodes, which is located between the zone of compression and rarefaction, has no pressure fluctuation and a minimal concentration of particles [32,33,34].
Figure 15
Figure 15
(A,B) This is the angiogram of the right coronary artery at the end of diastole with all the contrast almost flushed out. Pockets of high contrast concentration persist. These stagnation zones represent the high or moderate concentration of contrast particles and may correspond to zones of compression and rarefaction at the location of anti-nodes. The anti-node at 4 may define the distal end of the coronary artery as a tube based on the retrograde direction of the pressure wave. The anti-nodes at 1 and 3 may depict the zones of compression, while 2 and 4 may depict the zone of rarefaction. In between these antinodes, these coronary segments are the locations of nodes, which are clear of lesions because possibly there is no clash with the pressure wave.
Figure 16
Figure 16
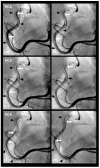
(AD) These are four consecutive coronary images. (A) The blood in white begins to move in at the beginning of diastole (1D). (B) The blood in white is seen moving to the proximal segment of the right coronary artery (RCA) (2D). (C) The blood arrives at the center of the mid-segment of the RCA. (D) The blood in white is seen to advance a little more, reaching the lesion at the mid RCA. (E) This is the fifth image of the sequence from diastole to systole. From (AD), the blood moves in rapidly in diastole. (E) The blood is stopped abruptly due to water hammer shock. The contrast concentration is more prominent at the location 1, where the retrograde pressure wave at the beginning of systole collides with the tip of the antegrade flow of diastole. The blue arrow shows a place where contrast is concentrated at the end of diastole. At the same time, the pressure wave reflects at the speed of sound, the anti-node 4 at the open end of the coronary artery could be seen early.
Figure 16
Figure 16
(AD) These are four consecutive coronary images. (A) The blood in white begins to move in at the beginning of diastole (1D). (B) The blood in white is seen moving to the proximal segment of the right coronary artery (RCA) (2D). (C) The blood arrives at the center of the mid-segment of the RCA. (D) The blood in white is seen to advance a little more, reaching the lesion at the mid RCA. (E) This is the fifth image of the sequence from diastole to systole. From (AD), the blood moves in rapidly in diastole. (E) The blood is stopped abruptly due to water hammer shock. The contrast concentration is more prominent at the location 1, where the retrograde pressure wave at the beginning of systole collides with the tip of the antegrade flow of diastole. The blue arrow shows a place where contrast is concentrated at the end of diastole. At the same time, the pressure wave reflects at the speed of sound, the anti-node 4 at the open end of the coronary artery could be seen early.
Figure 17
Figure 17
(AD) This is the right coronary artery in mid-systole because the contrast in black is still seen at the distal segment. The concentration of dense contrast (antinode) persists at the mid segment (labeled as 1) and at the proximal segment (labeled as 4).
Figure 17
Figure 17
(AD) This is the right coronary artery in mid-systole because the contrast in black is still seen at the distal segment. The concentration of dense contrast (antinode) persists at the mid segment (labeled as 1) and at the proximal segment (labeled as 4).
Figure 18
Figure 18
(AD) This is the right coronary artery in mid-systole because the contrast in black is still seen at the distal segment. The concentration of dense contrast (antinode) persisted through segments. Between the locations of the antinodes (1, 2, 3, and 4) the segments had no lesions or only minimal plaques. The reason is because at the locations of nodes, there was no high-pressure change, so no major damage of the intima was experienced.
Figure 19
Figure 19
Coronary acoustic action map. In this right coronary artery (RCA), the antinodes with elevated turbulent pressure show strong correlation with lesion formation and progression. The most severe lesion happens at the compression antinodes (location 1 and 3), while less severe lesion happens at the rarefaction antinodes (2 and 4). Conversely, at the segments in between the antinodes (4-1, 1-2 and 2-3), regions with minimal pressure fluctuations show little to no lesion.
Figure 20
Figure 20
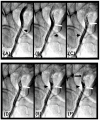
(AF) Laminar flow in right coronary angiogram. (AD) The blood (in white color) was observed moving along the apices of the curves (black arrowheads). The contrast (in black) with high viscosity occupied the inner curve (white arrows). (E,F) The blood in white is seen moving along the apices of the curves (three black arrows). The contrast in black with high viscosity occupies the inner curve. The contrast moves from one inner curve (first white arrow) to another inner curve (second white arrow). Laminar flow protects the intima from injury, so no lesion develops.
Figure 21
Figure 21
Collision in the iliac artery. This is a sequence of six consecutive angiographic images of the iliac artery. (A) The iliac artery is filled contrast in black. (B) Sixty-seven milliseconds later, the blood in homogenously white is seen moving down with a sharp tip of laminar flow (white arrow) (C) Subsequently, the pointed tip of the blood flow is halted abruptly, with all layers recoiling like a collapsing stack of dominoes (white arrow). (D) The tip of the flow then twists and turns on itself, resembling a vortex. (E,F) This turbulent vortical motion dissipates and is replaced by a mass of black contrast (arrowhead) moving in a retrograde direction along the inner curve (black arrow).
Figure 22
Figure 22
The left anterior descending (LAD) artery exhibits severe narrowing in its proximal segment (indicated by an arrow), while the right coronary artery (RCA) demonstrates a subtotal lesion in its mid-segment. In (A), the lesion in the proximal LAD appears to have resulted from damage inflicted by antegrade flow from uncontrolled diastolic hypertension, with the injury impacting the arterial wall and producing a characteristic “rat tail” appearance—featuring progressively severe narrowing in the distal direction. In (B), the mid-RCA lesion is attributed to damage from retrograde flow due to persistent uncontrolled systolic hypertension, which induced wall damage, leading to a “reversed rat tail” pattern, characterized by more severe narrowing proximally and a gradual reduction in severity distally.
Figure 23
Figure 23
(A) The left anterior descending (LAD) artery exhibits mild to moderate narrowing in its proximal segment (indicated by an arrow). (B) This patient was interested in having optimal medical management with well-controlled blood pressure by betablockers and statins to decrease the low-density lipoprotein (LDL) cholesterol level < 75 mg%. There was laminar flow across the lesion (three yellow arrows in (B)). The patient has been stable for the last one year, without conversion to acute coronary syndrome.
Figure 24
Figure 24
(A,B) Left coronary artery angiogram. (A) This is the left coronary angiogram with a patent left main (LM) and left circumflex (LCX) artery in a patient. (B) Three months later, a severe lesion in the mid-segment was observed (arrow). Could the physician have predicted the appearance of the severe lesion by reviewing the coronary flow of the July coronary angiogram? (C,D) The blood is seen moving in a proximal-to-distal segment at fast speed of diastole in laminar fashion with a thin boundary layer. (E) The blood flowed further downstream, but only at a minimal distance because this was the beginning of systole.
Figure 24
Figure 24
(A,B) Left coronary artery angiogram. (A) This is the left coronary angiogram with a patent left main (LM) and left circumflex (LCX) artery in a patient. (B) Three months later, a severe lesion in the mid-segment was observed (arrow). Could the physician have predicted the appearance of the severe lesion by reviewing the coronary flow of the July coronary angiogram? (C,D) The blood is seen moving in a proximal-to-distal segment at fast speed of diastole in laminar fashion with a thin boundary layer. (E) The blood flowed further downstream, but only at a minimal distance because this was the beginning of systole.
Figure 25
Figure 25
(A) The blood flowed further downstream (white arrow); however, there was a marked area with high concentration of contrast at the location transitioning from diastole to systole. This was the location of future lesion 3 months later (white arrowhead). This is the second image of the systole. (B) The high concentration of contrast (white arrowhead) continued at the location while the blood flow continued to flow forward distally (white arrow). This is the 3rd image of the systole. (C) The distal flow moved forward (black arrow, while there is some attenuation of the contrast (white arrow)). The flow looks more disorganized with a large boundary layer. This is the 4th image of the systole.
Figure 26
Figure 26
(A) The contrast seemed to fade away (white arrowhead) with a thin boundary layer (white arrow). This is the 5th image of the systole. (B) Black contrast is seen moving backward to the proximal left circumflex (white arrow). This was the angiographic evidence of reverse flow. (C) Black contrast is seen more prominently and moves backwards to the proximal left circumflex (white arrow). This is the angiographic evidence of reverse flow (white arrow). In the next 3 images (DF), there is persistent stagnant contrast at the proximal segment of the LCX. This was the location of future lesion 3 months later (a little distal to the origin of the side-branch).

References

    1. Koo B.K., Lee J.M., Hwang D., Park S., Shiono Y., Yonetsu T., Lee S.H., Kawase Y., Ahn J.M., Matsuo H., et al. Practical Application of Coronary Physiologic Assessment: Asia-Pacific Expert Consensus Document: Part 1. JACC Asia. 2023;3:689–706. doi: 10.1016/j.jacasi.2023.07.003. - DOI - PMC - PubMed
    1. Nguyen T., Ngo K., Vu T.L., Nguyen H.Q., Pham D.H., Kodenchery M., Zuin M., Rigatelli G., Nanjundappa A., Gibson M. Introducing a Novel Innovative Technique for the Recording and Interpretation of Dynamic Coronary Angiography. Diagnostics. 2024;14:1282. doi: 10.3390/diagnostics14121282. - DOI - PMC - PubMed
    1. Nguyen T., Nguyen H.D., Dinh H.V.K., Dinh T.H.T., Ngo K., Truong H.H., Nguyen H.Q., Loc V.T., Le T., Vo N., et al. Preliminary Results in the Investigation of In Vivo Iliac and Coronary Flow Collision, Vortex Formation, and Disorganized Flow Degeneration: Insights from Invasive Cardiology Based on Fluid Mechanics Principles and Practices. Fluids. 2024;9:222. doi: 10.3390/fluids9100222. - DOI
    1. Hussain S., Mubeen I., Ullah N., Shah S.S.U.D., Khan B.A., Zahoor M., Ullah R., Khan F.A., Sultan M.A. Modern Diagnostic Imaging Technique Applications and Risk Factors in the Medical Field: A Review. Biomed. Res. Int. 2022;2022:5164970. doi: 10.1155/2022/5164970. - DOI - PMC - PubMed
    1. Ghidaoui M.S., Zhao M., McInnis D.A., Axworthy D.H. A Review of Water Hammer Theory and Practice. Appl. Mech. Rev. 2005;58:49–76. doi: 10.1115/1.1828050. - DOI

LinkOut - more resources