. 2025 Feb 22;26(5):1885.
doi: 10.3390/ijms26051885.

Biological Activity of Peptide Fraction Derived from Hermetia illucens L. (Diptera: Stratiomyidae) Larvae Haemolymph on Gastric Cancer Cells

Affiliations

Biological Activity of Peptide Fraction Derived from Hermetia illucens L. (Diptera: Stratiomyidae) Larvae Haemolymph on Gastric Cancer Cells

Roberta Rinaldi et al. Int J Mol Sci. .

Abstract

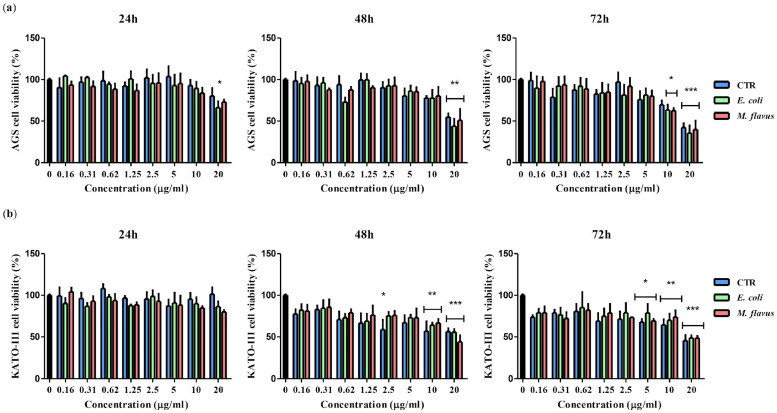
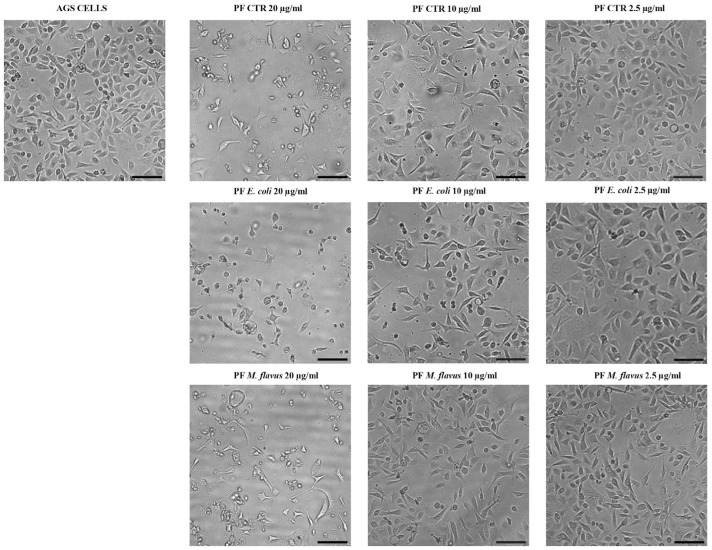
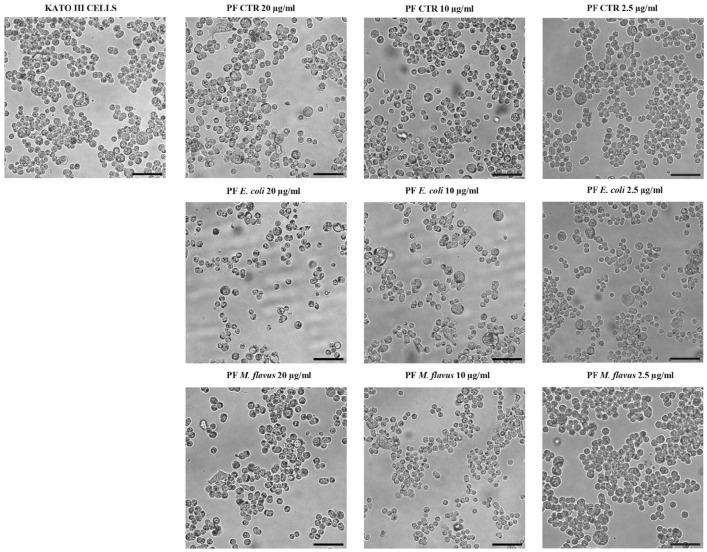
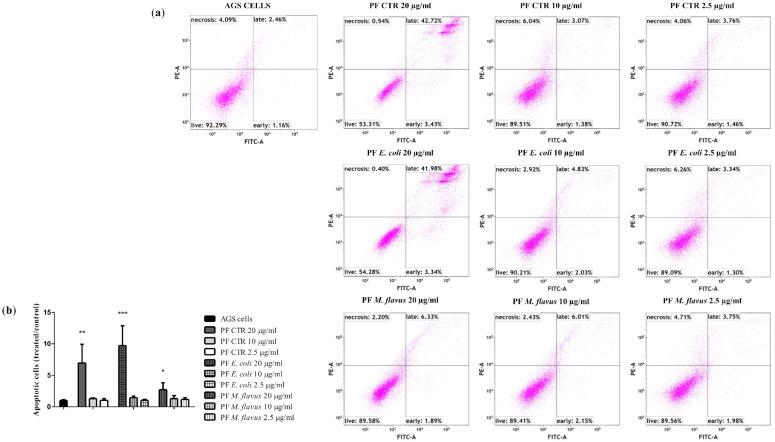
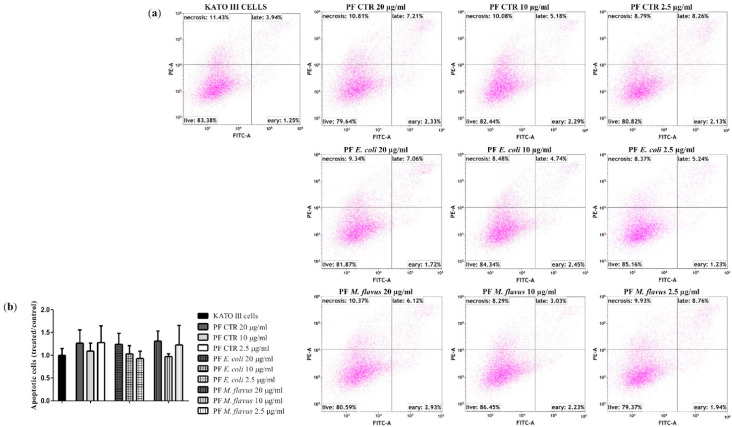
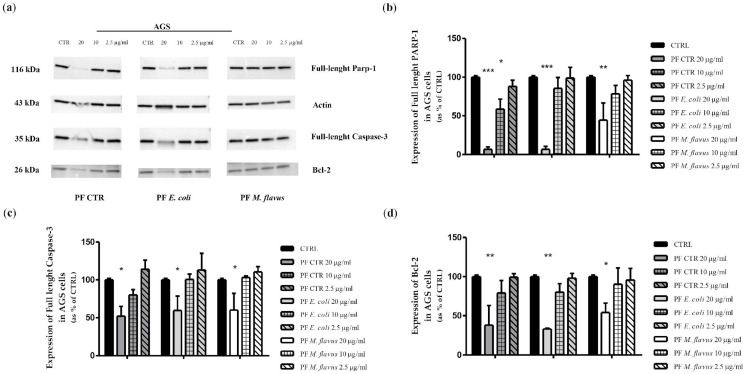
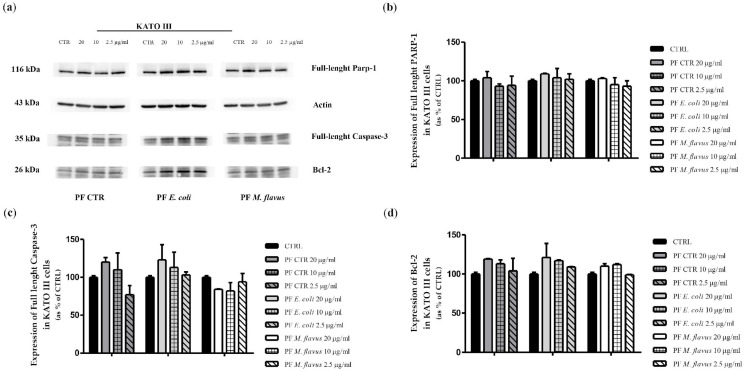
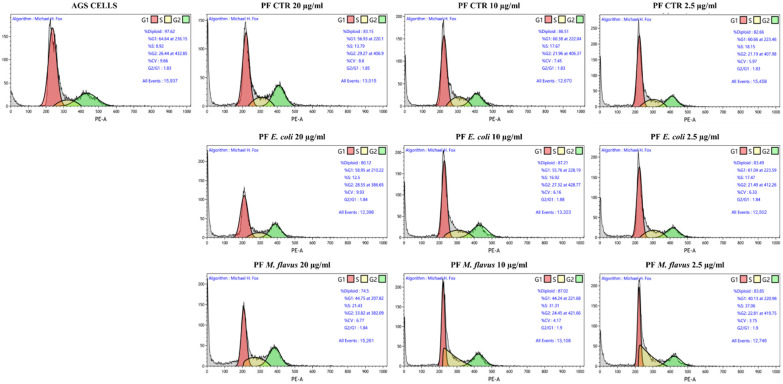
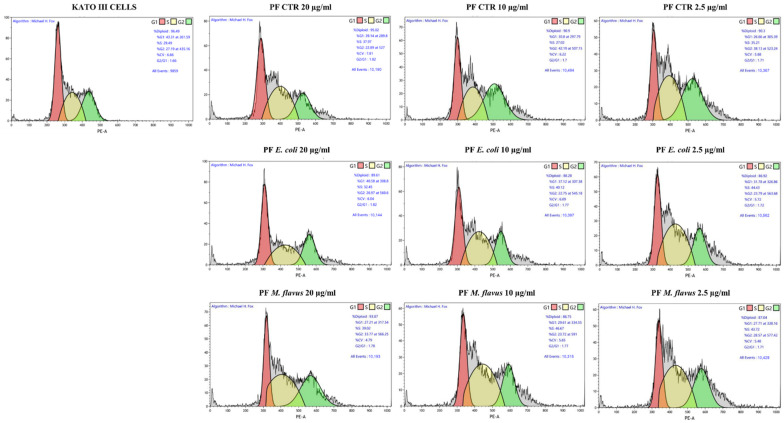
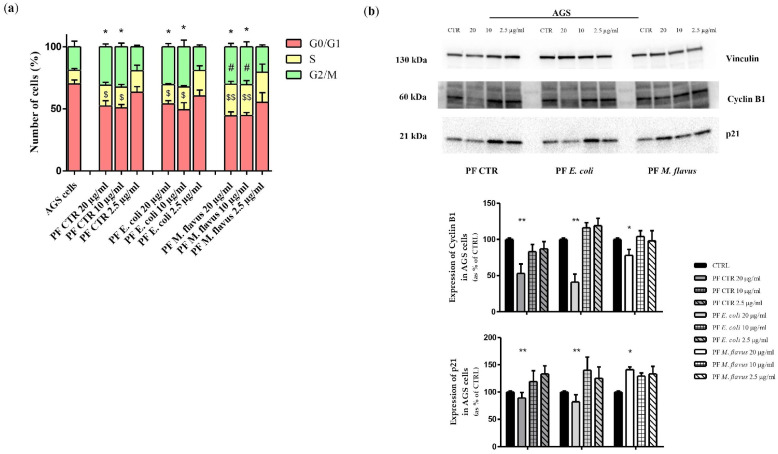
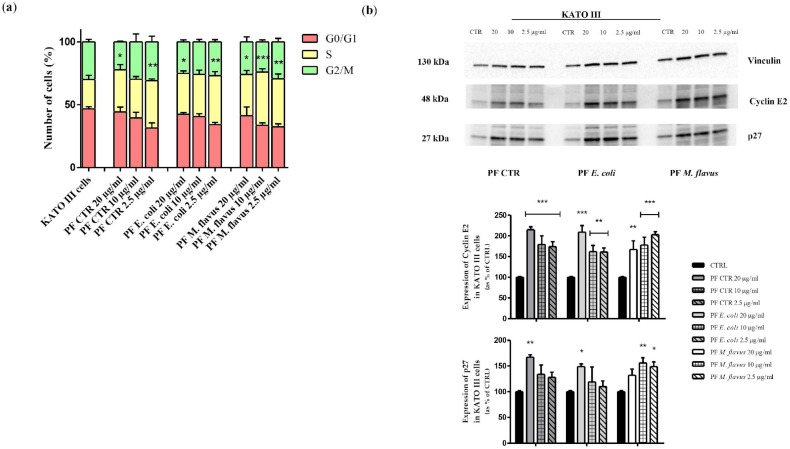
Gastric cancer (GC) is one of the leading causes of cancer-related mortality worldwide, characterised by poor prognosis and limited responsiveness to chemotherapy. There is a need for new and more effective anticancer agents. Antimicrobial peptides (AMPs) represent a promising class of biomolecules for this purpose. Naturally occurring in the innate immune system, these peptides can also exert cytotoxic effects against cancer cells, earning them the designation of "anticancer peptides" (ACPs). They have the potential to be a viable support for current chemotherapy schedules due to their selectivity against cancer cells and minor propensity to induce chemoresistance in cells. Insects are an excellent source of AMPs. Among them, due to its ability to thrive in hostile and microorganism-rich environments, we isolated a peptide fraction from Hermetia illucens L. (Diptera: Stratiomyidae) haemolymph to evaluate a possible anticancer activity. We tested Peptide Fractions (PFs) against AGS and KATO III gastric cancer cell lines. Data obtained indicated that PFs, especially those resulting from Escherichia coli and Micrococcus flavus infection (to boost immune response), were able to inhibit tumour cell growth by inducing apoptosis or cell cycle arrest in a cell line-specific manner. These results support further investigation into the use of antimicrobial peptides produced from insects as possible anticancer agents.

Keywords: anticancer peptides; black soldier fly; haemolymph extracts; in vitro anticancer activity.


Conflict of interest statement

The authors declare no conflicts of interest.

Figures

Figure 1
Figure 1
Evaluation of AGS and KATO III cell viability following exposure to PFs at varying concentrations over time. MTT assay was performed after incubation of (a) AGS and (b) KATO III cells with 20 µg/mL, 10 µg/mL, 5 µg/mL, 2.5 µg/mL, 1.25 µg/mL, 0.62 µg/mL, 0.31 µg/mL, 0.16 µg/mL PFs (PF CTR in blue, PF E. coli in green, and PF M. flavus in red) for 24 h, 48 h, and 72 h. Cell viability was expressed as a percentage relative to control of untreated cells (black bar). The graphs represent means ± Standard Error (SE) of three independent experiments; differences between treatment groups were estimated by one-way ANOVA followed by Dunnett’s post hoc test (* p < 0.05, ** p < 0.01, *** p < 0.001) using GraphPad Prism software 5.0. Significant differences were evaluated vs. untreated cells.
Figure 2
Figure 2
Microscopic analysis of AGS cells treated with PFs. Morphological cell analysis of AGS cell line treated for 48 h with 20 µg/mL, 10 µg/mL, 2.5 µg/mL PFs and untreated, observed through inverted phase contrast microscope. Images represent observations made on each sample in at least three separate fields of view. Magnification: 10×; scale bars: 80 µm.
Figure 3
Figure 3
Microscopic analysis of KATO III cells treated with PFs. Morphological cell analysis of KATO III cell line treated for 48 h with 20 µg/mL, 10 µg/mL, 2.5 µg/mL PFs and untreated, observed through inverted phase contrast microscope. Images represent observations made on each sample in at least three separate fields of view. Magnification: 10×; scale bars: 80 µm.
Figure 4
Figure 4
FACS analysis for apoptosis in AGS cell line treated for 48 h with 20 µg/mL, 10 µg/mL, 2.5 µg/mL PFs, and untreated controls. (a) The FACS profiles represent 10,000 events and are indicative of the patterns seen in three replications, and (b) the resultant histogram analysis shows data as means ± Standard Error (SE) of three independent experiments. Statistical significance was evaluated using GraphPad Prism software 5.0 with one-way ANOVA, followed by Dunnett’s post hoc test (* p < 0.05, ** p < 0.01, *** p < 0.001). Significant differences were evaluated vs. untreated cells (AGS cells bar).
Figure 5
Figure 5
FACS analysis for apoptosis on KATO III cell line treated for 48 h with 20 µg/mL, 10 µg/mL, 2.5 µg/mL PFs, and untreated controls. (a) The FACS profiles represent 10,000 events and are indicative of the patterns seen in three replications, and (b) the resultant histogram analysis shows data as means ± Standard Error (SE) of three independent experiments. Statistical significance was evaluated using GraphPad Prism software 5.0 with one-way ANOVA, followed by Dunnett’s post hoc test. Significant differences were evaluated vs. untreated cells (KATO III cells bar).
Figure 6
Figure 6
Western blot analysis of apoptosis-related proteins on AGS cells. (a) Western blot analysis showing the expression levels of proteins related to the apoptotic pathway, (b) PARP1, (c) Caspase-3, and (d) Bcl-2 in AGS cell line after exposing cells for 48 h with 20, 10, and 2.5 µg/mL of PFs. The relative expression levels were normalised to the housekeeping control, actin. The data are expressed as means ± Standard Error (SE) of three independent experiments. Statistical significance was evaluated using GraphPad Prism software 5.0 with one-way ANOVA, followed by Dunnett’s post hoc test (* p < 0.05, ** p < 0.01, *** p < 0.001). Significant differences were evaluated vs. untreated cells. Significant differences were evaluated vs. untreated cells (CRTL).
Figure 7
Figure 7
Western blot analysis of apoptosis-related proteins on KATO III cells. (a) Western blot analysis showing the expression levels of proteins related to the apoptotic pathway, (b) PARP1, (c) Caspase-3, and (d) Bcl-2 on KATO III cell line after exposing cells for 48 h with 20, 10, and 2.5 µg/mL of PFs. The relative expression levels were normalised to the housekeeping control, actin. The data are expressed as means ± Standard Error (SE) of three independent experiments. Statistical significance was evaluated using GraphPad Prism software 5.0 with one-way ANOVA, followed by Dunnett’s post hoc test.. Significant differences were evaluated vs. untreated cells (CTRL).
Figure 8
Figure 8
Representative plots (10,000 events) of cell cycle analysis by flow cytometry on AGS cell line. Dot plots report the distribution of cell cycle phases of AGS cells treated with PFs for 48 h at concentrations of 20, 10, and 2.5 µg/mL and untreated.
Figure 9
Figure 9
Representative plots (10,000 events) of cell cycle analysis by flow cytometry on KATO III cell line. Dot plots report the distribution of cell cycle phases of KATO III cells treated with PFs for 48 h at concentrations of 20, 10, and 2.5 µg/mL and untreated.
Figure 10
Figure 10
Cell cycle analysis in AGS cells. (a) Histogram reports the mean ± Standard Error (SE) of percentage of AGS cells treated with PFs for 48 h at concentrations of 20, 10, and 2.5 µg/mL and untreated in each phase of the cell cycle (G0/G1, S, and G2/M) from three separate experiments. (b) Western blot analysis reporting the expression levels of protein related to cell cycle mechanisms (Cyclin B1 and p21) on AGS cells treated with PFs for 48 h at concentrations of 20, 10, and 2.5 µg/mL and untreated. The relative expression levels are normalised to the housekeeping control, vinculin. The data are expressed as means ± Standard Error (SE) of three independent experiments. Statistical significance was evaluated using GraphPad Prism software 5.0 with one-way ANOVA, followed by Dunnett’s post hoc test (* p < 0.05, ** p < 0.01; # p < 0.05 or $ p < 0.05, $$ p < 0.01). Significant differences were evaluated vs. untreated cells (CTRL).
Figure 11
Figure 11
Cell cycle analysis in KATO III cells. (a) Histogram reports the mean ± Standard Error (SE) of percentage of treated KATO III cells treated with PFs for 48 h at concentrations of 20, 10, and 2.5 µg/mL and untreated in each phase of the cell cycle (G0/G1, S, and G2/M) from three separate experiments. (b) Western blot analysis reporting the expression levels of protein related to cell cycle mechanisms (Cyclin E2 and p27) on KATO III cells treated with PFs for 48 h at concentrations of 20, 10, and 2.5 µg/mL and untreated. The relative expression levels are normalised to the housekeeping control, vinculin. The data are expressed as means ± Standard Error (SE) of three independent experiments. Statistical significance was evaluated using GraphPad Prism software 5.0 with one-way ANOVA, followed by Dunnett’s post hoc test (* p < 0.05, ** p < 0.01, *** p < 0.001). Significant differences were evaluated vs. untreated cells (CTRL).

Similar articles

References

    1. National Cancer Institute . ‘Cancer Statistics’, National Institutes of Health. National Cancer Institute; Bethesda, MD, USA: 2024.
    1. Global Cancer Observatory . International Agency for Research on Cancer. World Health Organization; Geneva, Switzerland: 2024.
    1. Global Health Observatory . Explore a World of Health Data. World Health Organization; Geneva, Switzerland: 2024.
    1. World Cancer Research Fund International . Cancer Trends—Worldwide Cancer Data. World Cancer Research Fund International; Sheffield, UK: 2022.
    1. Bray F., Laversanne M., Sung H., Ferlay J., Siegel R.L., Soerjomataram I., Jemal A. Global cancer statistics 2022: GLOBOCAN estimates of incidence and mortality worldwide for 36 cancers in 185 countries. CA Cancer J. Clin. 2024;74:229–263. doi: 10.3322/caac.21834. - DOI - PubMed

MeSH terms

Supplementary concepts

LinkOut - more resources