. 2025 Feb 25;26(5):1976.
doi: 10.3390/ijms26051976.

Deciphering Colorectal Cancer-Hepatocyte Interactions: A Multiomics Platform for Interrogation of Metabolic Crosstalk in the Liver-Tumor Microenvironment

Affiliations

Deciphering Colorectal Cancer-Hepatocyte Interactions: A Multiomics Platform for Interrogation of Metabolic Crosstalk in the Liver-Tumor Microenvironment

Alisa B Nelson et al. Int J Mol Sci. .

Abstract

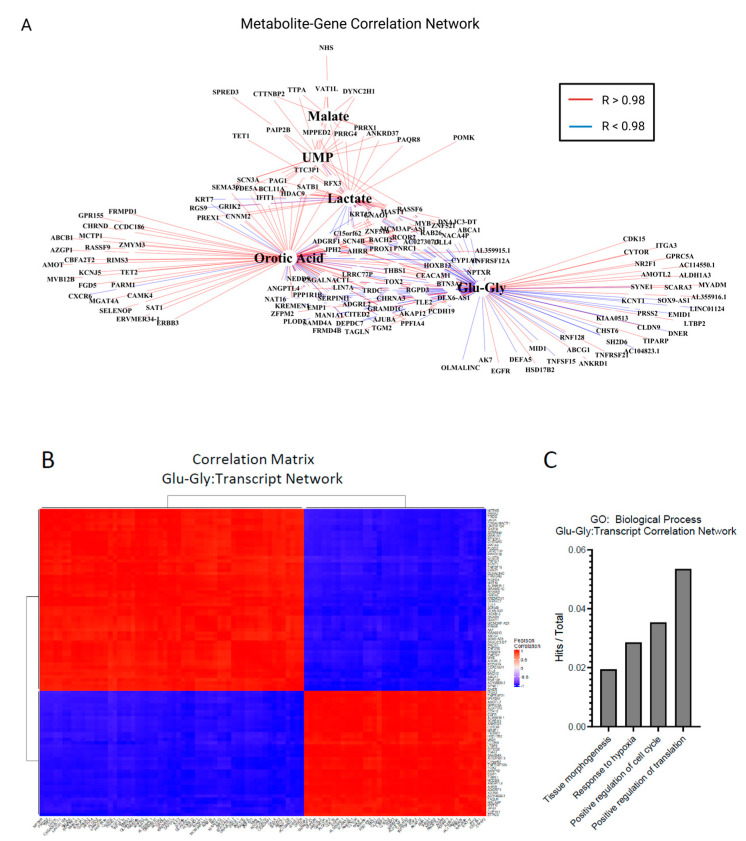
Metabolic reprogramming is a hallmark of cancer, enabling tumor cells to adapt to and exploit their microenvironment for sustained growth. The liver is a common site of metastasis, but the interactions between tumor cells and hepatocytes remain poorly understood. In the context of liver metastasis, these interactions play a crucial role in promoting tumor survival and progression. This study leverages multiomics coverage of the microenvironment via liquid chromatography and high-resolution, high-mass-accuracy mass spectrometry-based untargeted metabolomics, 13C-stable isotope tracing, and RNA sequencing to uncover the metabolic impact of co-localized primary hepatocytes and a colon adenocarcinoma cell line, SW480, using a 2D co-culture model. Metabolic profiling revealed disrupted Warburg metabolism with an 80% decrease in glucose consumption and 94% decrease in lactate production by hepatocyte-SW480 co-cultures relative to SW480 control cultures. Decreased glucose consumption was coupled with alterations in glutamine and ketone body metabolism, suggesting a possible fuel switch upon co-culturing. Further, integrated multiomics analysis indicates that disruptions in metabolic pathways, including nucleoside biosynthesis, amino acids, and TCA cycle, correlate with altered SW480 transcriptional profiles and highlight the importance of redox homeostasis in tumor adaptation. Finally, these findings were replicated in three-dimensional microtissue organoids. Taken together, these studies support a bioinformatic approach to study metabolic crosstalk and discovery of potential therapeutic targets in preclinical models of the tumor microenvironment.

Keywords: cancer metabolism; metabolomics; multiomics; tumor microenvironment.


Conflict of interest statement

P.A.C. has served as an external consultant for Pfizer, Inc., Abbott Laboratories, Janssen Research & Development and Juvenescence. A.C. is now an employee of Solventum.

Figures

Figure 1
Figure 1
Multiomics study of co-cultures of primary hepatocytes and SW480s. (A) Scheme of 2D co-culture system and timeline for cell collection. After growth arrest, 3T3J2s were plated with freshly thawed primary rat hepatocytes for 7 days, and then a subset of these plates received SW480s. After 3 days of co-culturing, all media and cells were collected for analysis. (B) Omics coverage of co-cultured groups included broad metabolomic coverage utilizing NMR- and LC-MS/MS-based approaches and bulk RNA sequencing. These data were integrated using univariate approaches to interrogate the impact of metabolomic changes on tumor transcriptional profiles. Abbreviations: HJ, hepatocyte+3T3-J2 co-culture; SJH, SW480+3T3-J2+hepatocyte co-culture; SJ, SW480+3T3-J2 co-culture; NMR, nuclear magnetic resonance; LC-MS/MS, liquid chromatography hyphenated with tandem mass spectrometry.
Figure 2
Figure 2
Fuel utilization in 2-dimensional co-cultures. (A) Glucose consumption and lactate production in moles per ng total DNA per day. (B) Lactate/glucose ratio of media concentration after 24 h. (C) Concentration of acetoacetate (AcAc), β-hydroxybutryrate (βOHB) and total ketone bodies (TKB) in mmol/g DNA measured in media after 24 h of incubation. (D) Relative abundance of glutamine in total ion counts after normalization to total ng DNA. Volcano plot showing upregulated and downregulated metabolites in SJH compared to (E) HJ control cultures and (F) SJ control cultures; positive log2FC = up in SJH. Significance tested using unpaired t-test, comparison HJ vs. SJH or SJ vs. SJH, and corrected for multiple comparisons using Benjamini–Hochberg method. * p adj. < 0.05, ** p adj. < 0.01, *** p adj. < 0.001, and **** p adj. < 0.0001. Abbreviations: HJ, hepatocyte+3T3-J2 co-culture; SJH, SW480+3T3-J2+hepatocyte co-culture; SJ, SW480+3T3-J2 co-culture.
Figure 3
Figure 3
Analytical dilution of co-culture controls reveals metabolic adaptation in SJH co-cultures. (A) Schematic of analytical dilution of HJ and SJ controls to form a 1-to-1 ratio (1T1) after metabolite extraction. (B) Volcano plot upregulated and downregulated metabolites in SJH compared to 1T1 ion counts; positive log2FC = up in SJH. SJH, SW480+3T3-J2+hepatocyte co-culture; 1T1, 1-to-1 ratio of SJ to HJ metabolite extractant.
Figure 4
Figure 4
Metabolic interactions of biosynthetic pathways in SJH co-cultures. Fold change of metabolite abundance after 24 h co-culture relative to time point 0 in (A) media abundance of purine metabolism products, hypoxanthine and uric acid; (B) intracellular inosine pools; (D) media abundance of pyrimidine biosynthesis intermediates, uridine and orotic acid; and (E) intracellular pyrimidine intermediates and substrates, aspartate, carbamoyl aspartate, orotic acid, UDP, and uridine. (C) 13C-enrichment of intracellular inosine pools from 22 mM [U-13C6]glucose in 3D microtissue organoids. Statistical comparison by unpaired t-test; letters indicate significance in comparison to HJ controls (“a”) or SJ controls (“b”). * p adj. < 0.05. HJ, hepatocyte+3T3-J2 co-culture; SJH, SW480+3T3-J2+hepatocyte co-culture; SJ, SW480+3T3-J2 co-culture; UDP, uridine diphosphate.
Figure 5
Figure 5
Discriminant ITUM analysis of SJH co-cultures. (A) Biplot of first two principal components (PC1 and PC2) of PCA of HJ, SJH, and SJ co-cultures by 13C-glucose-enriched isotopologues. Black-filled circles represent samples. Spheres show co-culture groups. Blue directed vectors show isotopologue loadings for PC1 and PC2. (B) Hierarchical clustering of ITUM SJH vs. SJ Pearson correlation matrix. White triangle with “1” label indicates control cluster of isotopologues; yellow shapes with “2” and “3” labels correspond to cluster of isotopologues from region of strongly co-enriched isotopologues in response to co-culture; and black shapes with “4” label correspond to cluster of isotopologues with weak co-enrichment in response to co-culture. Red arrow, U_M6 positive correlation with unenriched M+0 isotopologues in Region 1; blue arrow, U_M6 negative correlation with multiple isotopologues, including GSH_M3, in Region 2; and yellow arrow, GSH_M4 positive correlation with metabolic precursor E_M4 in Region 3. Abbreviations: HJ, hepatocyte+3T3-J2 co-culture; SJH, SW480+3T3-J2+hepatocyte co-culture; SJ, SW480+3T3-J2 co-culture; .M#, isotopologue representing number of heavy carbons present in the molecule (i.e., M1 indicates presence of 1 heavy 13-carbon); aKG, alpha-ketoglutarate; S, serine; M, malate; L, lactate; C, citrate; ATP, adenosine triphosphate; U, uridine diphosphate N-acetylglucosamine; G, glycine; D, aspartate; E, glutamate; GSH, glutathione; Sc, succinate; GPI, glycerophosphoinositol.
Figure 6
Figure 6
Transcriptional profiling of tumor cells in 3D microtissues identifies alterations in metabolic pathways upon exposure to hepatocytes. (A) Three-dimensional microtissue organoid scheme. (B) Volcano plot showing significantly upregulated and downregulated genes in samples from SJH cultures compared with SJ cultures. Positive logFC indicates up in SJH cultures. (C) Gene ontology analysis using DEG as input. (D) GSEA hallmark analysis of SJ compared with SJH. A positive NES score indicates gene profiles that are enriched in tumor cells from the SJH condition compared with the SJ condition. All shown pathways adjusted FDR < 0.05. (E) Expression patterns of core enriched genes associated with Myc pathway and two metabolic pathways, oxidative phosphorylation and glutathione metabolism, that are positively enriched in the SJH condition and heat maps. (F) GSEA Oncogenic analysis of SJ compared with SJH. A negative NES score indicates gene profiles that are enriched in tumor cells from the SJ condition compared with the SJH condition. All shown pathways adjusted FDR < 0.05. HJ, hepatocyte+3T3-J2 co-culture; SJH, SW480+3T3-J2+hepatocyte co-culture; SJ, SW480+3T3-J2 co-culture.
Figure 7
Figure 7
Multiomics pathway analysis of metabolic adaptation to hepatocytes. (A) Correlation network of differentially expressed genes (DEGs) and metabolites in SJH co-cultures compared to SJ control cultures. Gene names filtered from full bulk RNA-sequencing DEGs for significance of correlation to metabolites of interest (p < 0.001). Red lines indicate strong positive associations, and blue represent strong negative associations (R > |0.98|). (B) Hierarchical clustering of Pearson correlation matrix of transcripts highly correlated with glutamyl-glycine (Glu-Gly). (C) Gene counts with functional group membership of 98 transcripts were found to correlate strongly with glutamyl-glycine (Glu-Gly). Abbreviations: Glu-Gly, glutamyl-glycine dipeptide; UMP, uridine monophosphate.

Update of

References

    1. Siegel R.L., Giaquinto A.N., Jemal A. Cancer statistics, 2024. CA A Cancer J. Clin. 2024;74:12–49. doi: 10.3322/caac.21820. - DOI - PubMed
    1. Horn S.R., Stoltzfus K.C., Lehrer E.J., Dawson L.A., Tchelebi L., Gusani N.J., Sharma N.K., Chen H., Trifiletti D.M., Zaorsky N.G. Epidemiology of liver metastases. Cancer Epidemiol. 2020;67:101760. doi: 10.1016/j.canep.2020.101760. - DOI - PubMed
    1. Hanahan D., Weinberg Robert A. Hallmarks of Cancer: The Next Generation. Cell. 2011;144:646–674. doi: 10.1016/j.cell.2011.02.013. - DOI - PubMed
    1. Pavlova N.N., Thompson C.B. The Emerging Hallmarks of Cancer Metabolism. Cell Metab. 2016;23:27–47. doi: 10.1016/j.cmet.2015.12.006. - DOI - PMC - PubMed
    1. Lyssiotis C.A., Kimmelman A.C. Metabolic Interactions in the Tumor Microenvironment. Trends Cell Biol. 2017;27:863–875. doi: 10.1016/j.tcb.2017.06.003. - DOI - PMC - PubMed

LinkOut - more resources