. 2025 Feb 27;26(5):2134.
doi: 10.3390/ijms26052134.

Inhibition of LncRNA H19 Attenuates Testicular Torsion-Induced Apoptosis and Preserves Blood-Testis Barrier Integrity

Affiliations

Inhibition of LncRNA H19 Attenuates Testicular Torsion-Induced Apoptosis and Preserves Blood-Testis Barrier Integrity

Linxin Cheng et al. Int J Mol Sci. .

Abstract

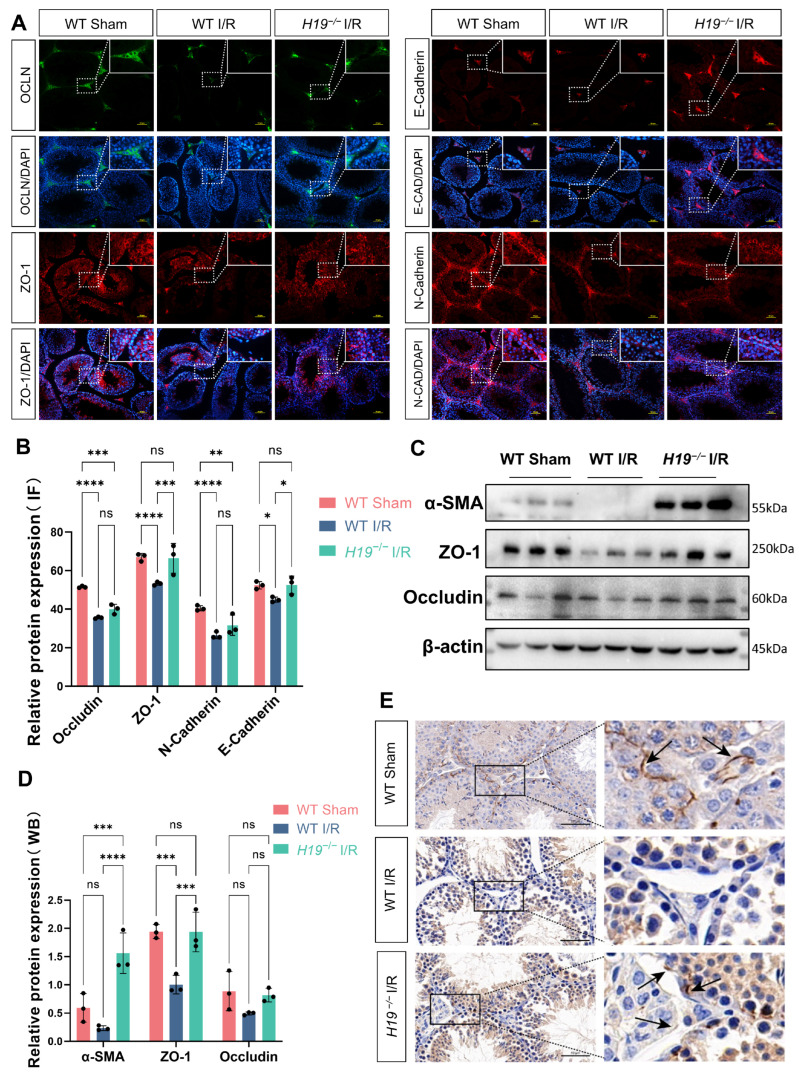
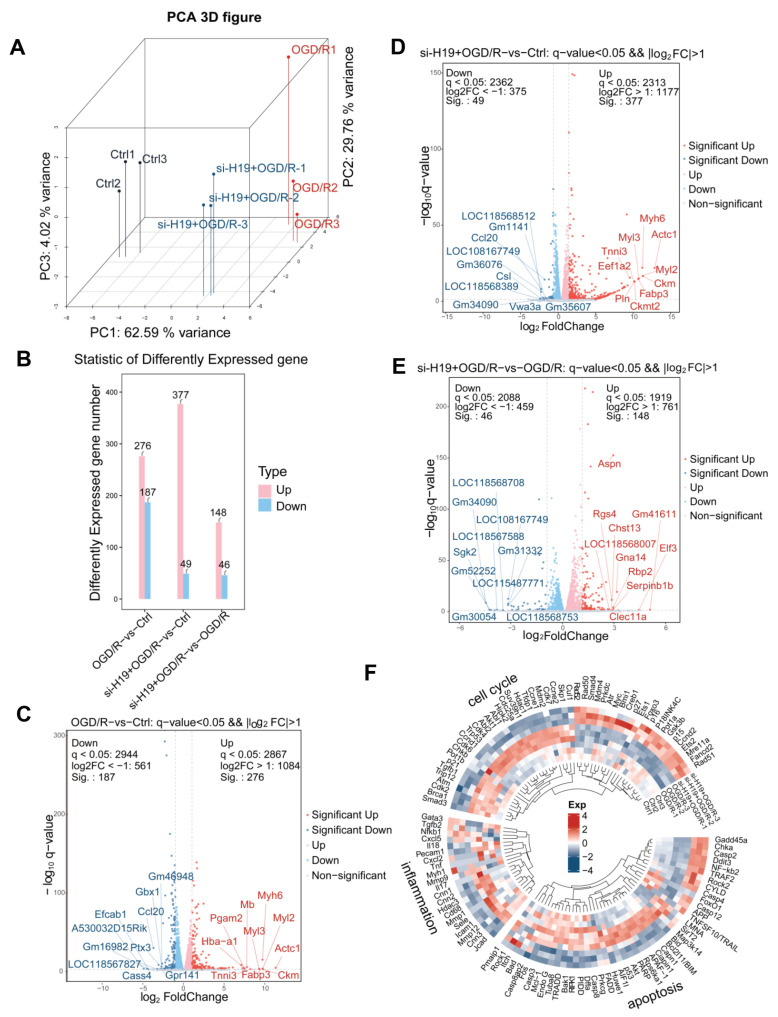
Testicular torsion is a common emergency in adolescents, and can lead to severe ischemia reperfusion injury (IRI). LncRNA H19 has been shown to increase during ischemia, but its role in testicular IRI remains unknown. Focusing on this research gap, we utilized H19 biallelic mutant mice and Sertoli cell line (TM4) to construct in vivo and in vitro models of ischemia/reperfusion (I/R) and oxygen-glucose deprivation/reperfusion (OGD/R). Compared to WT I/R mice, H19-/- I/R mice showed milder tissue disorganization and cell loss, with a more intact blood-testis barrier (BTB). The cell viability decreased, ROS levels and apoptosis-related factors such as Bax/Bcl-2 increased in TM4 cells after OGD/R, whereas these changes were reversed when H19 was knocked down followed by OGD/R (si-H19+OGD/R). In contrast, over-expression of H19 in TM4 cells exacerbates OGD/R-induced cell apoptosis. Through in-depth analysis of KEGG-enriched pathways, the PI3K/AKT pathway was identified as a potential target of H19 modulation. Western blotting confirmed that, in OGD/R cells, elevated H19 levels were accompanied by the excessive AKT phosphorylation and the tight junction marker ZO-1 degradation; and in si-H19+OGD/R cells, the decreased AKT phosphorylation was recovered and the up-regulated ZO-1 expression was weakened simultaneously via using the AKT activator SC79. These results suggest that inhibiting H19 in OGD/R cells might preserve the integrity of the BTB by reversing the excessive phosphorylation of AKT. Moreover, H19 deficiency in si-H19+OGD/R cells alleviated the disturbances in glycolysis, fatty acid biosynthesis, and amino acid metabolism. Our study indicates that H19 might be a potential therapeutic target for clinic testicular I/R treatment.

Keywords: Sertoli cell; apoptosis; blood–testis barrier; lncRNA H19; testicular torsion.


Conflict of interest statement

The authors declare no conflicts of interest.

Figures

Figure 1
Figure 1
H19 knockout alleviated apoptosis damage caused by testicular IRI. (A) Representative images of testicular torsion models. (B) Changes in H19 mRNA expression in testis after I/R. n = 3 per group. (C) Representative images of TUNEL staining in the WT sham, WT I/R, and H19−/− I/R mice. n = 3 per group, scale bars = 100 µm. (D) The quantification of TUNEL assay. (EG) mRNA levels of Caspase-8, Caspase-3, and Bax/Bcl-2 in WT Sham, WT I/R, and H19−/− I/R. n = 3 per group. (H,I) The protein expressions and quantifications of Bax and Bcl-2 were assessed by Western blot in WT Sham, WT I/R, and H19−/− I/R samples, n = 3 per group. Data are depicted as mean ± SD. * p < 0.05, ** p < 0.01, *** p < 0.001, ns, no statistical significance.
Figure 2
Figure 2
H19 knockout diminished the apoptotic cell quantities, and improved the sperm motility and organizational structure of testicular IRI. (A,B) Changes in the number of various cell types in the testes. The thin black arrow indicates spermatid, the thin red arrow indicates spermatogonium, the black thick arrow indicates purple Sertoli cells, and the red thick arrow indicates spermatocyte undergoing meiosis. n = 3 per group. Scale bars = 50 µm. n = 3 per group. (C) Comparison of sperm motility analysis. n = 2–5 per group. (D) Johnsen’s score was evaluated 2 h after testicular torsion and 24 h reperfusion. n = 6 per group. (E) HE staining and analyses of testes obtained from WT sham, WT I/R, and H19−/− I/R groups. The thick arrow indicates a decrease in mature sperm, the thin arrow indicates the shedding of spermatogenic cells into the lumen. n = 3 per group. Scale bars = 50 µm, 100 µm. Data are depicted as mean ± SD. * p < 0.05, ** p < 0.01, *** p < 0.001, **** p < 0.0001, ns, no statistical significance.
Figure 3
Figure 3
H19 knockout maintained the integrity of the BTB. (A,B) Representative images and quantifications of Occludin, ZO-1, E-Cadherin and N-Cadherin expression in WT Sham, WT I/R and H19−/− I/R analyzed by immunofluorescence (Occludin, ZO-1, E-Cadherin, and N-Cadherin were located in cell membrane and cell junctions. Green indicates mouse primary antibodies, and red indicates rabbit primary antibodies). n = 3 per group. Scale bars = 50 µm. (C,D) The protein expressions and quantifications of α-SMA, ZO-1 and Occludin were assessed by Western blot in WT sham, WT I/R, and H19−/− I/R mice, n = 3 per group. (E) Immunohistochemical expression of ZO-1 in WT sham, WT I/R, and H19−/− I/R mice (black arrows indicate the locations of ZO-1 expression). Scale bars = 50 µm. Data are depicted as mean ± SD. * p < 0.05, ** p < 0.01, *** p < 0.001, **** p < 0.0001, ns, no statistical significance.
Figure 4
Figure 4
Treatment with OGD/R induced inflammation response, apoptosis, and peroxidation in TM4 cells. (A) Representative images of the CTRL and OGD/R groups at 0 h and 16 h of treatment; Scale bars = 100 µm. (B) ROS green fluorescence in the CTRL and OGD/R groups at 16 h treatment under fluorescence microscopy. n = 3 per group. Scale bars = 100 µm. (C) Relative ROS expression levels were detected by a microplate reader. n = 3 per group. (D) CCK-8 viability assay for the CTRL and OGD/R groups. n = 3 per group. (E) qPCR analysis and comparison of H19, Bax, Bcl-2, HIF-1α, IL-6, and Caspase-3 in CTRL and OGD/R groups through six biological replicates. (F,G) Cleaved Caspase-3, Cleaved PARP, Bax, and Bcl-2 protein levels and quantitation in TM4 cells before and after OGD/R. n = 3 per group. Data are depicted as mean ± SD. * p < 0.05, ** p < 0.01, *** p < 0.001, **** p < 0.0001, ns, no statistical significance.
Figure 5
Figure 5
The inhibition of H19 contributed to easing inflammation, apoptosis, and oxidative stress in OGD/R TM4 cells. (A) Cell viability of CTRL, OGD/R, and si-H19+OGD/R TM4 cells. n = 3 per group. (B) ROS generations of CTRL, OGD/R, and si-H19+OGD/R TM4 cells. n = 3 per group. (CI) Expression of H19, HIF-1α, Caspase-3, Bax, Bcl-2, IL-6, and Bcl-xl mRNA by RT-qPCR in CTRL, OGD/R, and si-H19+OGD/R through six biological replicates. (J,K) Protein expressions and quantifications of Cleaved Caspase-3, Cleaved PARP, Bax, and Bcl-2 by Western blot in CTRL, OGD/R, si-NC+OGD/R, and si-H19+OGD/R TM4 cells. n = 3 per group. (L,M) Protein expressions and quantifications of Cleaved Caspase-3, Cleaved PARP, Bax, and Bcl-2 by Western blot in CTRL, OGD/R, oe-NC+OGD/R and oe-H19+OGD/R TM4 cells. n = 3 per group. Data are depicted as mean ± SD. * p < 0.05, ** p < 0.01, *** p < 0.001, **** p < 0.0001, ns, no statistical significance.
Figure 6
Figure 6
RNA-Seq analysis of CTRL, OGD/R, and si-H19+OGD/R groups. (A) Global gene expression profiling of CTRL, OGD/R, and si-H19+OGD/R. (BE) Statistic and comparison of different expressed genes of CTRL, OGD/R, and si-H19+OGD/R. (F) Expression heatmap of apoptosis, inflammation, and cell cycle markers in CTRL, OGD/R, and si-H19+OGD/R. n = 3 per group.
Figure 7
Figure 7
Inhibition of H19 preserves ZO-1 expression possibly by preventing AKT excessive phosphorylation in OGD/R TM4 cells. (A) KEGG enrichment and comparison between the si-H19+OGD/R and the OGD/R TM4 cells. (B) Protein expression of p-AKT and AKT in the CTRL, OGD/R, si-NC+OGD/R, and si-H19+OGD/R TM4 cells. (C) Protein expression of p-AKT and AKT in the CTRL, OGD/R, oe-NC+OGD/R, and oe-H19+OGD/R TM4 cells. (D,E) The quantifications of (B,C). (F,G) Representative images and quantifications of ZO-1 in TM4 cells of CTRL, OGD/R, si-H19+OGD/R, and oe-H19+OGD/R analyzed by immunofluorescence (ZO-1 is localized at the cell membrane and cell junctions). n = 3 per group. Scale bars = 100 µm. (HJ) Western blot analysis and quantifications were performed to analyze the changes in p-AKT, AKT, and ZO-1 in CTRL, OGD/R, si-NC+OGD/R, and si-H19+OGD/R. n = 3 per group. Data are depicted as mean ± SD. * p < 0.05, ** p < 0.01, **** p < 0.0001, ns, no statistical significance.
Figure 8
Figure 8
Inhibition of H19 may help maintain energy metabolism in TM4 cells. (AC) KEGG enrichment and comparative analysis of CTRL, OGD/R, and si-H19+OGD/R. (DF) Heatmap of gene expression related to glycolysis, fatty acid biosynthesis, and amino acid metabolism. n = 3 per group.

Similar articles

References

    1. Zhang M., Liu Q., Meng H., Duan H., Liu X., Wu J., Gao F., Wang S., Tan R., Yuan J. Ischemia-reperfusion injury: Molecular mechanisms and therapeutic targets. Signal Transduct. Target. Ther. 2024;9:12. doi: 10.1038/s41392-023-01688-x. - DOI - PMC - PubMed
    1. Eltzschig H.K., Eckle T. Ischemia and reperfusion–from mechanism to translation. Nat. Med. 2011;17:1391–1401. doi: 10.1038/nm.2507. - DOI - PMC - PubMed
    1. Shunmugam M., Goldman R.D. Testicular torsion in children. Can. Fam. Physician Med. Fam. Can. 2021;67:669–671. doi: 10.46747/cfp.6709669. - DOI - PMC - PubMed
    1. Minas A., Mahmoudabadi S., Gamchi N.S., Antoniassi M.P., Alizadeh A., Bertolla R.P. Testicular torsion in vivo models: Mechanisms and treatments. Andrology. 2023;11:1267–1285. doi: 10.1111/andr.13418. - DOI - PubMed
    1. Oyedokun P.A., Akhigbe R.E., Ajayi L.O., Ajayi A.F. Impact of hypoxia on male reproductive functions. Mol. Cell. Biochem. 2023;478:875–885. doi: 10.1007/s11010-022-04559-1. - DOI - PubMed

MeSH terms

Substances

LinkOut - more resources