

Impact of Saharan Dust and SERPINA1 Gene Variants on Bacterial/Fungal Balance in Asthma Patients
- PMID: 40076778
- PMCID: PMC11899813
- DOI: 10.3390/ijms26052158
Impact of Saharan Dust and SERPINA1 Gene Variants on Bacterial/Fungal Balance in Asthma Patients
Abstract
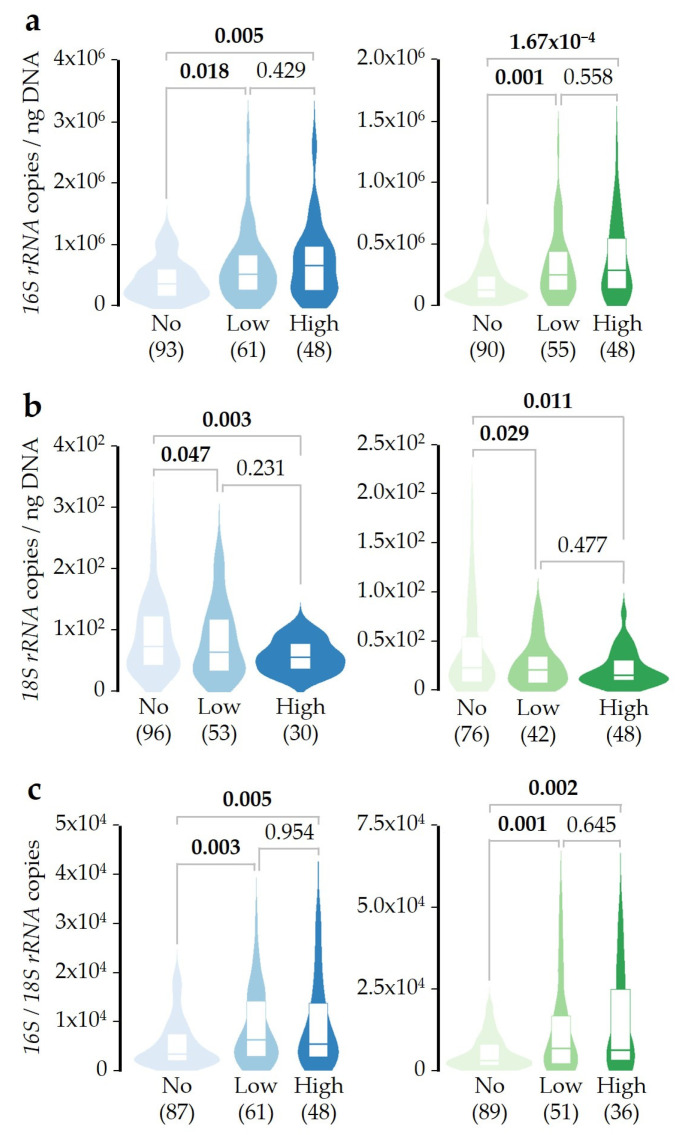
The Canary Islands, a region with high asthma prevalence, are frequently exposed to Saharan Dust Intrusions (SDIs), as are a wide range of countries in Europe. Alpha-1 antitrypsin (SERPINA1 gene) regulates the airway's inflammatory response. This study analyzed the combined effect of SDI exposure and SERPINA1 variants on bacterial/fungal DNA concentrations in saliva and pharyngeal samples from asthmatic patients. Bacterial and fungal DNAs were quantified by qPCR in 211 asthmatic patients (GEMAS study), grouped based on their exposure to daily PM10 concentrations. Associations between SDI exposure, microbial DNA concentrations, and nine variants in SERPINA1 were tested using linear regression models adjusted for confounders. The ratio between bacterial and fungal DNA was similar in saliva and pharyngeal samples. SDI exposure for 1-3 days was enough to observe significant microbial DNA change. Increased bacterial DNA concentration was detected when SDI exposure occurred 4-10 days prior to sampling, while exposure between days 1 and 3 led to a reduction in the fungal DNA concentration. The T-allele of SERPINA1 SNV rs2854254 prevented the increase in the bacterial/fungal DNA ratio in pharyngeal samples after SDI exposure. The bacterial/fungal DNA ratio represents a potential tool to monitor changes in the microbiome of asthmatic patients.
Keywords: 16S rRNA; 18S rRNA; SERPINA1; SNV; Saharan dust intrusions; asthma; microbial DNA concentration.
Conflict of interest statement
The authors declare no conflicts of interest.
Figures


Similar articles
-
Alpha-1 antitrypsin deficiency and Pi*S and Pi*Z SERPINA1 variants are associated with asthma exacerbations.Pulmonology. 2025 Dec 31;31(1):2416870. doi: 10.1016/j.pulmoe.2023.05.002. Epub 2024 Oct 25. Pulmonology. 2025. PMID: 37236906
-
SERPINA1 gene polymorphisms in a population-based ALSPAC cohort.Pediatr Pulmonol. 2019 Sep;54(9):1474-1478. doi: 10.1002/ppul.24422. Epub 2019 Jul 12. Pediatr Pulmonol. 2019. PMID: 31298815
-
Fungal DNA, allergens, mycotoxins and associations with asthmatic symptoms among pupils in schools from Johor Bahru, Malaysia.Pediatr Allergy Immunol. 2011 May;22(3):290-7. doi: 10.1111/j.1399-3038.2010.01127.x. Pediatr Allergy Immunol. 2011. PMID: 21457336
-
Endotoxin, ergosterol, fungal DNA and allergens in dust from schools in Johor Bahru, Malaysia- associations with asthma and respiratory infections in pupils.PLoS One. 2014 Feb 11;9(2):e88303. doi: 10.1371/journal.pone.0088303. eCollection 2014. PLoS One. 2014. PMID: 24523884 Free PMC article.
-
The Effects of Rare SERPINA1 Variants on Lung Function and Emphysema in SPIROMICS.Am J Respir Crit Care Med. 2020 Mar 1;201(5):540-554. doi: 10.1164/rccm.201904-0769OC. Am J Respir Crit Care Med. 2020. PMID: 31661293 Free PMC article.
References
-
- Georgakopoulou V.E., Taskou C., Diamanti A., Beka D., Papalexis P., Trakas N., Spandidos D.A. Saharan Dust and Respiratory Health: Understanding the Link between Airborne Particulate Matter and Chronic Lung Diseases (Review) Exp. Ther. Med. 2024;28:460. doi: 10.3892/etm.2024.12750. - DOI - PMC - PubMed
-
- López-Villarrubia E., Iñiguez C., Costa O., Ballester F. Acute Effects of Urban Air Pollution on Respiratory Emergency Hospital Admissions in the Canary Islands. Air Qual. Atmos. Health. 2016;9:713–722. doi: 10.1007/s11869-015-0382-z. - DOI
-
- Dominguez-Rodriguez A., Baez-Ferrer N., Rodríguez S., Avanzas P., Abreu-Gonzalez P., Terradellas E., Cuevas E., Basart S., Werner E. Saharan Dust Events in the Dust Belt -Canary Islands- and the Observed Association with in-Hospital Mortality of Patients with Heart Failure. J. Clin. Med. 2020;9:376. doi: 10.3390/jcm9020376. - DOI - PMC - PubMed
-
- von Suchodoletz H., Glaser B., Thrippleton T., Broder T., Zang U., Eigenmann R., Kopp B., Reichert M., Ludwig Z. The Influence of Saharan Dust Deposits on La Palma Soil Properties (Canary Islands, Spain) CATENA. 2013;103:44–52. doi: 10.1016/j.catena.2011.07.005. - DOI
MeSH terms
Substances
Grants and funding
- 2022CLISA19/Fundación CajaCanarias and Fundación "la Caixa"
- SAF2017-83417R/MICIU/AEI/ 10.13039/501100011033 and by "ERDF A way of making Europe"
- FPI2024010017/co-financed by the Canarian Agency for Research, Innovation and the Information Society of the Counseling of Universities, Science and Innovation and Culture, and by the European Social Fund Plus (FSE+) Integrated Operational Program of the Canary Islands
- TESIS2022010045/co-financed by the Canarian Agency for Research, Innovation and the Information Society of the Counseling of Universities, Science and Innovation and Culture, and by the European Social Fund Plus (FSE+) Integrated Operational Program of the Canary Islands
LinkOut - more resources
Full Text Sources
Medical
Research Materials
Miscellaneous
