

Genome-Wide Identification and Expression Analysis of the TGA Gene Family in Banana (Musa nana Lour.) Under Various Nitrogen Conditions
- PMID: 40076789
- PMCID: PMC11900138
- DOI: 10.3390/ijms26052168
Genome-Wide Identification and Expression Analysis of the TGA Gene Family in Banana (Musa nana Lour.) Under Various Nitrogen Conditions
Abstract
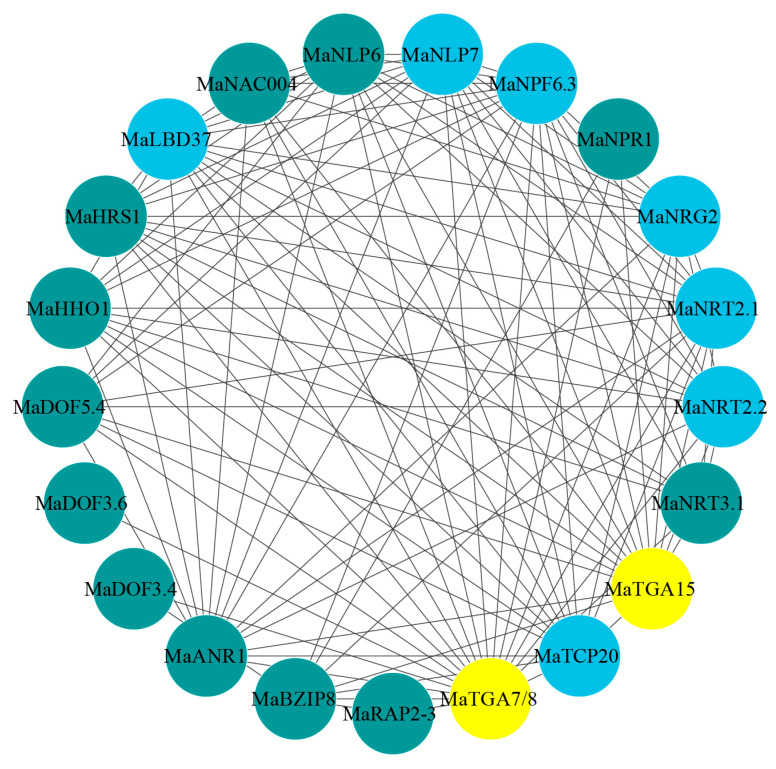
The TGA (TGACG motif-binding factor) transcription factors are integral to root growth and development, and are pivotal in mediating plant responses to abiotic stresses. Nonetheless, their role in the nutrient absorption processes of banana plants has not been extensively investigated. This research conducted a comprehensive analysis of the MaTGA gene family, emphasizing their physicochemical characteristics, phylogenetic relationships, gene duplication events, promoter cis-regulatory elements and protein interaction networks. Furthermore, this study investigated the expression patterns of MaTGA family members under varying nitrogen conditions. A total of 18 MaTGA members were identified within the banana genome, each encoding proteins characterized by the presence of bZIP and DOG domains. These genes exhibited an uneven distribution across eight chromosomes. Phylogenetic analysis further classified the MaTGA family into four distinct subgroups (I-IV), consisting of three, seven, three, and five members, respectively. An analysis of promoter cis-elements indicated that over 50% of the MaTGA gene family members contain hormone-responsive elements associated with abscisic acid (ABRE), ethylene (ERE), and salicylic acid (SARE), in addition to stress-responsive elements related to drought (MBS) and low temperature (LTR). Regarding gene expression, MaTGA7, MaTGA8, and MaTGA15 exhibited significantly elevated expression levels in the leaves and roots relative to other tissues. Under varying nitrogen conditions, 13 members, including MaTGA7 and MaTGA8, demonstrated the highest expression levels under reduced nitrogen (70%) treatment, followed by low nitrogen (20%) conditions, and the lowest expression levels were observed under nitrogen-deficient conditions. These findings imply that MaTGA genes may play crucial roles in enhancing nitrogen use efficiency. Protein interaction predictions suggest that MaTGA7, MaTGA8, and MaTGA15 may interact with nitrogen-related proteins, including Nitrate Transporter 2 (NRT2.1 and NRT2.2), NIN-Like Protein 7 (NLP7), and Nitrate Transporter 1.1 (NPF6.3). In summary, MaTGA7, MaTGA8, and MaTGA15 are likely involved in the processes of nitrogen absorption and utilization in bananas. The present findings establish a basis for subsequent investigations into the functional roles of MaTGA genes in augmenting nutrient use efficiency and mediating responses to abiotic stresses in banana plants.
Keywords: TGA transcription factors; banana; gene expression; nutrient utilization.
Conflict of interest statement
The authors declare no conflicts of interest.
Figures


Similar articles
-
Expression Analysis of MaTGA8 Transcription Factor in Banana and Its Defence Functional Analysis by Overexpression in Arabidopsis.Int J Mol Sci. 2021 Aug 28;22(17):9344. doi: 10.3390/ijms22179344. Int J Mol Sci. 2021. PMID: 34502265 Free PMC article.
-
Genome-wide identification and characterization of the superoxide dismutase gene family in Musa acuminata cv. Tianbaojiao (AAA group).BMC Genomics. 2015 Oct 20;16:823. doi: 10.1186/s12864-015-2046-7. BMC Genomics. 2015. PMID: 26486759 Free PMC article.
-
[Genome-wide identification of the banana GLR gene family and its expression analysis in response to low temperature and abscisic acid/methyl jasmonate].Sheng Wu Gong Cheng Xue Bao. 2023 Jul 25;39(7):2874-2896. doi: 10.13345/j.cjb.220972. Sheng Wu Gong Cheng Xue Bao. 2023. PMID: 37584137 Chinese.
-
Genome-wide characterization of a SRO gene family involved in response to biotic and abiotic stresses in banana (Musa spp.).BMC Plant Biol. 2019 May 22;19(1):211. doi: 10.1186/s12870-019-1807-x. BMC Plant Biol. 2019. PMID: 31113386 Free PMC article.
-
Genome-wide identification and characterization of DTX family genes highlighting their locations, functions, and regulatory factors in banana (Musa acuminata).PLoS One. 2024 Jun 6;19(6):e0303065. doi: 10.1371/journal.pone.0303065. eCollection 2024. PLoS One. 2024. PMID: 38843276 Free PMC article.
References
-
- Weiste C., Pedrotti L., Selvanayagam J., Muralidhara P., Fröschel C., Novák O., Ljung K., Hanson J., Dröge-Laser W. The Arabidopsis bZIP11 transcription factor links low-energy signalling to auxin-mediated control of primary root growth. PLoS Genet. 2017;13:e1006607. doi: 10.1371/journal.pgen.1006607. - DOI - PMC - PubMed
MeSH terms
Substances
Grants and funding
- 323RC543 and 323QN279/Natural Science Foundation of Hainan
- No. NKLTCB202311 and NKLTCB202333/Project of National Key Laboratory for Tropical Crop Breeding
- ZDYF2023XDNY179/Hainan Province Science and Technology Special Fund
- 1630052024003/Social Public-interest Scientific Institution Reform Special Fund
- CARS-31/China Agriculture Research System
LinkOut - more resources
Full Text Sources
