. 2025;168(2):31.
doi: 10.1007/s10533-025-01219-6. Epub 2025 Mar 10.

Freshwater faces a warmer and saltier future from headwaters to coasts: climate risks, saltwater intrusion, and biogeochemical chain reactions

Affiliations

Freshwater faces a warmer and saltier future from headwaters to coasts: climate risks, saltwater intrusion, and biogeochemical chain reactions

Sujay S Kaushal et al. Biogeochemistry. 2025.

Abstract

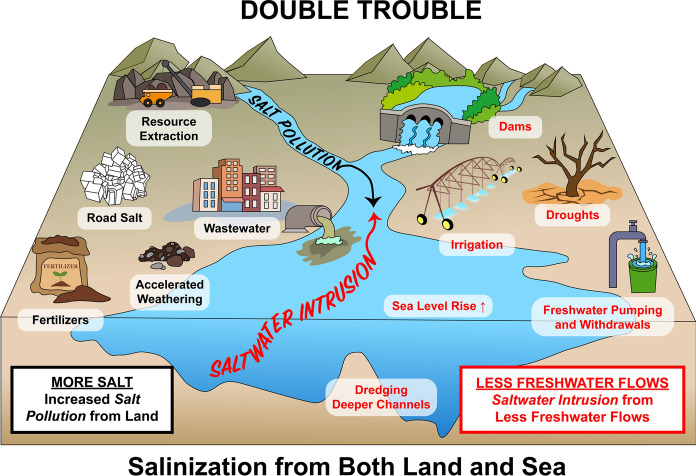
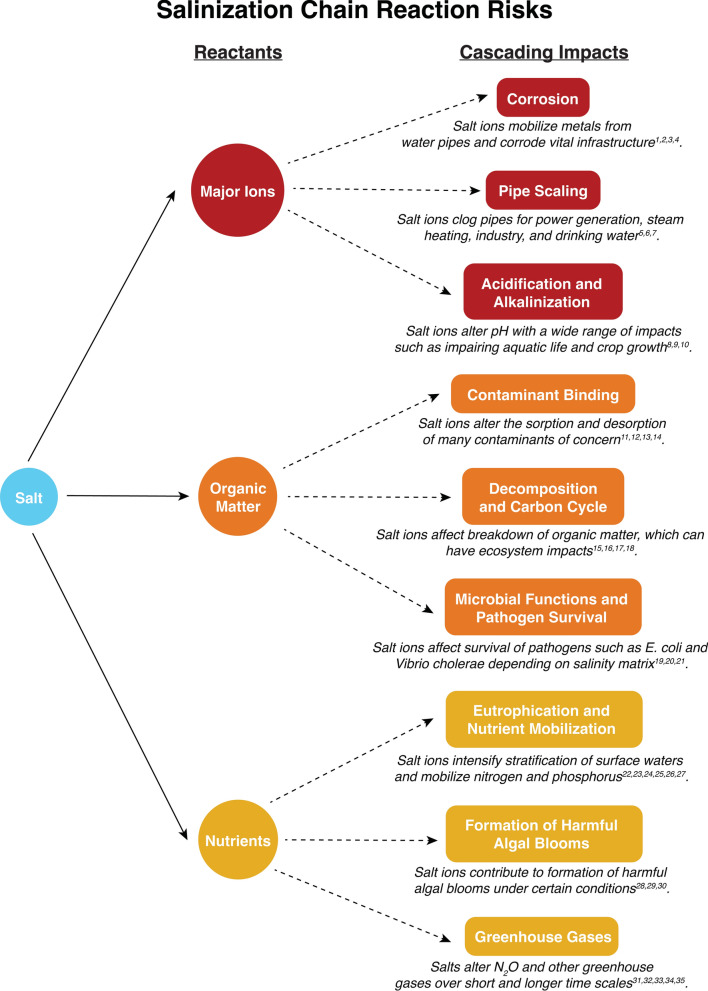
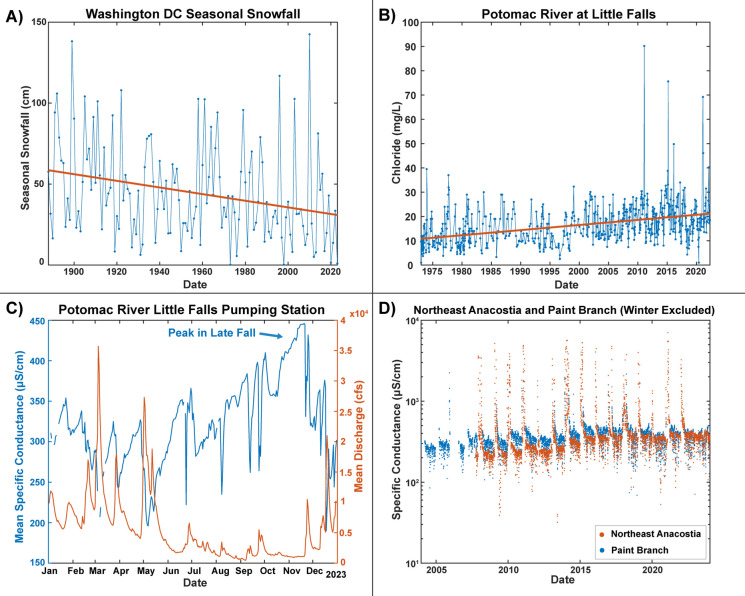
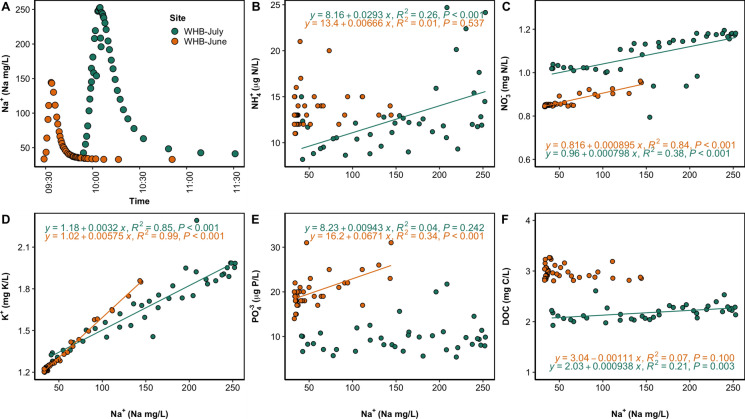
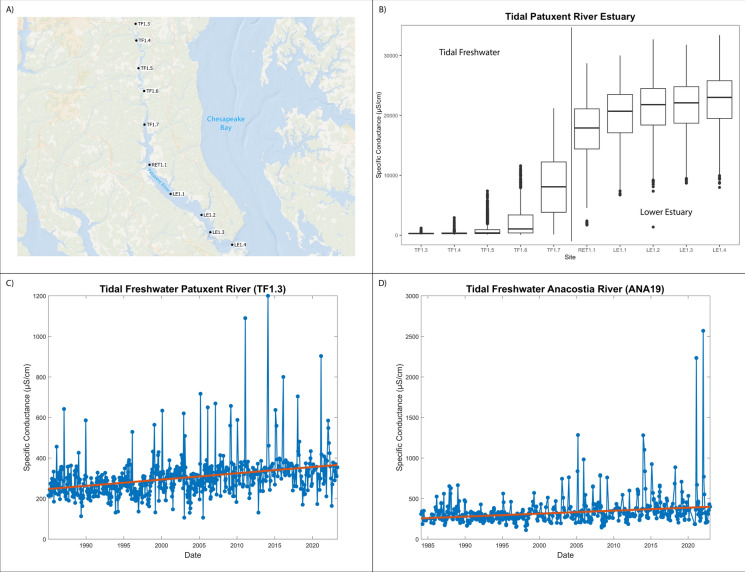
Alongside global climate change, many freshwater ecosystems are experiencing substantial shifts in the concentrations and compositions of salt ions coming from both land and sea. We synthesize a risk framework for anticipating how climate change and increasing salt pollution coming from both land and saltwater intrusion will trigger chain reactions extending from headwaters to tidal waters. Salt ions trigger 'chain reactions,' where chemical products from one biogeochemical reaction influence subsequent reactions and ecosystem responses. Different chain reactions impact drinking water quality, ecosystems, infrastructure, and energy and food production. Risk factors for chain reactions include shifts in salinity sources due to global climate change and amplification of salinity pulses due to the interaction of precipitation variability and human activities. Depending on climate and other factors, salt retention can range from 2 to 90% across watersheds globally. Salt retained in ecosystems interacts with many global biogeochemical cycles along flowpaths and contributes to 'fast' and 'slow' chain reactions associated with temporary acidification and long-term alkalinization of freshwaters, impacts on nutrient cycling, CO2, CH4, N2O, and greenhouse gases, corrosion, fouling, and scaling of infrastructure, deoxygenation, and contaminant mobilization along the freshwater-marine continuum. Salt also impacts the carbon cycle and the quantity and quality of organic matter transported from headwaters to coasts. We identify the double impact of salt pollution from land and saltwater intrusion on a wide range of ecosystem services. Our salinization risk framework is based on analyses of: (1) increasing temporal trends in salinization of tributaries and tidal freshwaters of the Chesapeake Bay and freshening of the Chesapeake Bay mainstem over 40 years due to changes in streamflow, sea level rise, and watershed salt pollution; (2) increasing long-term trends in concentrations and loads of major ions in rivers along the Eastern U.S. and increased riverine exports of major ions to coastal waters sometimes over 100-fold greater than forest reference conditions; (3) varying salt ion concentration-discharge relationships at U.S. Geological Survey (USGS) sites across the U.S.; (4) empirical relationships between specific conductance and Na+, Cl-, SO4 2-, Ca2+, Mg2+, K+, and N at USGS sites across the U.S.; (5) changes in relationships between concentrations of dissolved organic carbon (DOC) and different salt ions at USGS sites across the U.S.; and (6) original salinization experiments demonstrating changes in organic matter composition, mobilization of nutrients and metals, acidification and alkalinization, changes in oxidation-reduction potentials, and deoxygenation in non-tidal and tidal waters. The interaction of human activities and climate change is altering sources, transport, storage, and reactivity of salt ions and chain reactions along the entire freshwater-marine continuum. Our salinization risk framework helps anticipate, prevent, and manage the growing double impact of salt ions from both land and sea on drinking water, human health, ecosystems, aquatic life, infrastructure, agriculture, and energy production.

Supplementary information: The online version contains supplementary material available at 10.1007/s10533-025-01219-6.

Keywords: Anthropogenic salt cycle; Carbon cycle; Climate change; Global biogeochemical cycles; Metals; Nitrogen cycle.


Conflict of interest statement

Competing interestThe authors have no relevant financial or non-financial interests to disclose.

Figures

Fig. 1
Fig. 1
Salinization exerts a growing double impact on freshwaters from both land and sea. Salt pollution from land is increasing concentration of multiple salt ions in rivers worldwide (Kaushal et al. 2019, 2023a, b, 2024). At the same, decreased freshwater flows, droughts, and drying rivers can also increase saltwater intrusion risks. Variability in the location of the salt front of rivers and estuaries likely depends on: tides, winds, waves and storm surges, increased precipitation, bathymetry, dredging deeper channels, sea level rise, degree of mixing, upriver freshwater withdrawals for agriculture, power, and water consumption, and other complex factors (Najjar et al. ; Ralston and Geyer ; Tian ; Lassiter ; Valle-Levinson and Li 2023). Tidal freshwaters and low salinity zones along streams, rivers, estuaries, and wetlands are the most at risk from the double impact of salt from land and sea. Graphics modified from IAN Symbol Library and Canva
Fig. 2
Fig. 2
Examples of different chain reactions triggered by salt as part of Freshwater Salinization Syndrome, which can influence the role of major ions, organic matter, and nutrients in degrading ecosystem services and causing water quality issues. Superscripts in the figure correspond to literature references for specific types of chain reactions that are provided in this caption. For example, impacts on corrosion can be found in Pieper et al. (2018)1; Stets et al. (2018)2; Zhou et al. (2021)3; Kaushal (2016)4. Impacts on pipe scaling can be found in Li et al. (2022a, b)5; MacAdam and Jarvis (2015)6; Cao et al. (2022)7. Impacts on acidification and alkalinization can be found in Bui (2017)8; Zalizniak et al. (2009)9; Zhao et al. (2022)10. Impacts on contaminant binding can be found in Navarro et al. (2022)11; Rodríguez-Liébana et al. (2010)12; Yin et al. (2022)13; Acosta et al. (2011)14. Impacts on decomposition and carbon cycling can be found in Oliveira et al. (2021)15; Connolly et al. (2014)16; Weston et al. (2011)17; Almeida Júnior et al. (2020)18. Impacts on microbial functions and pathogen survival can be found in Huq et al. (1984)19; DeVilbiss et al. (2021)20; Van Gray and Ayayee (2024)21. Impacts on eutrophication and nutrient mobilization can be found in Lind et al. 201822; Radosavljevic et al. (2022); Salcedo et al. (2024)24; Galella et al. (2023a, b)25; MacLeod et al. (2011)26; Steinmuller and Chambers (2018)27. Impacts on algal blooms can be found in Osburn et al. (2023)28; Yu et al. (2022)29; Duval et al. (2018)30. Impacts on greenhouse gases can be found in Ardón et al. (2018)31; Neubauer et al. (2013)32; Dang et al. (2019)33; Xie et al. (2020)34; Weston et al. (2014)35
Fig. 3
Fig. 3
Increasing long-term annual exports of major ions in kg/ha/yr (mass transport) in Susquehanna, Potomac, Patuxent, and Passaic Rivers along the eastern U.S. Annual exports of sodium, chloride, potassium, and alkalinity show increasing patterns over decades whereas sulfate shows a decreasing pattern over decades. There have been increased pulses in annual exports of major ions due to increasing climate variability over recent decades. Information on methods for salt ion load estimates can be found in the Supporting Information
Fig. 4
Fig. 4
(Panel A) Decreasing snowfall trend in Washington D.C. over 100 years from National Oceanic and Atmospheric Administration (NOAA) data. (Panel B) Increasing long-term trends in chloride concentrations with extreme pulses during recent years in the Potomac River at Little Falls Pumping Station near Washington D.C. from U.S. Geological Survey (USGS) data. (Panel C) Increasing specific conductance during drought conditions near the drinking water intake for the Potomac River at the Little Falls Pumping Station revealed by USGS high-frequency sensor data during 2023. (Panel D) Increasing baseflow concentrations of specific conductance with winters removed in the Northeast Branch of the Anacostia River in the Potomac Watershed
Fig. 5
Fig. 5
Relationships between streamflow and concentrations of sodium, calcium, magnesium, chloride, sulfate in streams and rivers across the U.S. monitored by the U.S. Geological Survey (USGS). Concentrations of major ions generally decrease with increases in runoff, but there appears to be a stabilization of concentrations (plateau) for many major ions at the highest levels of runoff. Information on USGS stream and river sites can be found in the Supporting Information
Fig. 6
Fig. 6
There are positive relationships between specific conductance and concentrations of salt ions and nutrients and dissolved inorganic carbon (as represented by alkalinity) in streams and rivers across the U.S. monitored by the U.S. Geological Survey (USGS). These positive relationships demonstrate that many different elements are either co-mobilized or transported along with salt ions in watersheds. Specific conductance is a surrogate or proxy for many ions (Kaushal et al. 2018b, 2019, 2020, 2021). Information on USGS sites can be found in the Supporting Information
Fig. 7
Fig. 7
Experimental NaCl tracer additions in a suburban New Hampshire stream (WHB) trigger “fast” mobilization of dissolved organic carbon (DOC), nitrogen (N), phosphorus (P), and potassium (K). A) Break-through curve of Na+ concentrations from the added NaCl at WHB; Regressions between added Na+ concentrations and ambient concentrations of B) ammonium (NH4+), C) nitrate (NO3), D) potassium (K+), E) phosphate (PO43−), and F) dissolved organic carbon (DOC). Green points are from July 2015 and yellow points are from June 2014. Each point represents a single sample, and linear regressions were only included for statistically significant (p < 0.05) relationships. The effects of experimental stream salinization may vary with streamflow and season. Information on tracer addition methods can be found in the Supporting Information
Fig. 8
Fig. 8
Salt impacts carbon cycling and bulk dissolved organic matter (DOM) concentrations, as well as different fractions of DOM through physical, biological, and chemical processes. These processes can result in net increases or decreases in DOM concentrations or changes in DOM quality from headwaters to coastal waters. Here, we summarize how changes in salinity impact: (1) bulk DOM; (2) recalcitrant DOM, which is often considered to be aromatic, high molecular weight humic-like substances typically terrestrial and soil derived (shown in brown arrows as absolute amount; Hansen et al. 2016); and (3) labile DOM, which is often considered to be less complex aliphatic, protein-like substances typically microbial and plant leachate derived (shown in green arrows as absolute amount; Hansen et al. 2016). Initially, pulses in salinity cause rapid decreases in pH (Kaushal et al. 2022), making DOM, including humic fractions, less soluble in soil, water, and streams (Green et al. ; Duan and Kaushal 2015). Over longer time scales, elevated salinity can cause alkalinization through repeated H+ depletion on soil exchange sites, enhancing solubility of DOM, particularly aromatic and humic fractions (Green et al. , ; Duan and Kaushal ; Haq et al. 2018). In soils and sediments, sodium dispersion can mobilize organic matter through the destruction of soil aggregates, and it can increase bulk DOM, as well as aromatic and non-humic fractions up to a threshold before flocculation (Amrhein et al. , Green et al. 2008b, 2009, Duan and Kaushal 2015). Along riparian zones and streams, invertebrate decomposers are impacted by salinity thresholds, which alter decomposition rates and concentrations of fine particulate organic matter, bulk DOM, and changes in DOM quality (Entrekin et al. ; Berger et al. 2019). Within streams and rivers, elevated salinity can pose a subsidy-stress relationship to primary producers and heterotrophic microbial communities. Low levels of added salinity initially cause decreases in osmotic stress, leading to increases in primary production and decomposition rates (Entrekin et al. ; DeVilbiss et al. 2024), which could increase bulk DOM and protein-like and microbially derived fractions of organic matter through exudation. As salinity thresholds are exceeded, increases in osmotic stress can lead to decreases in primary production and decomposition rates, leading to decreases in overall DOM concentrations and larger relative contributions of recalcitrant material (Entrekin et al. 2019). Cell death due to desiccation or cell lysis caused by osmotic stress can increase the contribution of aquatically sourced DOM in streams (Duan and Kaushal ; Kaushal et al. 2022). Along river flowpaths, salinity gradients along the freshwater-marine continuum can affect whether different fractions of DOM are degraded, oxidized, or mineralized by sunlight, UV radiation, and photobleaching based on upon the chemical composition of organic matter and the salt ion matrix (Minor et al. ; Schafer et al. 2021). Along the entire freshwater-marine continuum, increasing ionic strength also increases the solubility of proteins up to a threshold, which depends upon salt ion compositions and DOM substrate composition (salting-in), after which hydrogen bond locations are taken up and solubility decreases (salting out) (Kaushal et al. ; Hyde et al 2017). Across increased salinity levels, Ca2+, Mg2+, and Na+, can lead to flocculation of organic matter; flocculation can remove aromatic and humic fractions preferentially and decrease bulk DOC concentrations (Abolfazli and Strom ; Duan and Kaushal 2015). Overall, salinity affects the cycling of carbon from headwaters to coastal waters in many environmentally significant ways based on: organic substrate composition, concentrations and compositions of the salt ion matrix, previous salt exposure histories at sites, microbial communities and adaptations to osmotic stress, and other site-specific factors
Fig. 9
Fig. 9
Experimental NaCl impacts on pH, dissolved inorganic carbon (DIC), total dissolved nitrogen (TDN), and humic fractions of dissolved organic matter (DOM) in sediments from non-tidal and tidal freshwater sites along the Anacostia River. Results are from an original experiment with further details provided in Supporting Information. Organic matter indices were identified using staRdom in R (Pucher et al. 2019), with a higher value of BIX representing a larger contribution of recent autochthonous material (Huguet et al. 2009) and higher values of Coble’s Peaks (A, C, M, and T) representing larger amounts of protein-like and humic-like organic matter, as associated with each peak given in parentheses (Coble 1996). RU denotes Raman Units, which is followed by the description of the peak (Coble 1996). T (Protein-like) to C (Humic-Like) is the ratio between Coble’s Peak T to Coble’s Peak C, with higher values indicating a larger relative contribution of protein-like material. Experimental methods and additional results are in the Supporting Information
Fig. 10
Fig. 10
Relationships between Na+, Ca2+, and Mg2+ (total sum of these three base cations), and K+ and dissolved organic carbon concentrations in streams and rivers across the U.S. In addition, we present examples of relationships between dissolved organic carbon (DOC) and individual ions at specific sites. Concentrations of DOC appear to increase initially with elevated concentrations of Na+, Ca2+, and Mg2+ (sum of these base cations) across sites in the Eastern U.S., but then decrease likely as ionic strength and coagulation increases. However, there are typically declining relationships between DOC concentrations and concentrations of Na+, Ca2+, and Mg2+ at individual local sites. Typically, K+ concentrations show a strong positive relationship with DOC concentrations, which is likely because of the importance of biological controls on cycling of potassium; potassium is a limiting nutrient in terrestrial systems (Tripler et al. 2006). Information on U.S. Geological Survey (USGS) sites can be found in Supporting Information Table S1
Fig. 11
Fig. 11
A long-term trend analysis of salinity for tidal sites within the EPA Chesapeake Bay Program water quality monitoring network. Long-term trends at sites were only assessed if sites had 10 + years of data and 50 + observations. Theil-Sen slopes are shown for the trends at specific stations as examples; in addition, the colors of points on the map represent ranges in Theil-Sen slopes for individual stations within the tidal monitoring network. Trends in figures A-F are statistically significant and PSU in the figure legend refers to practical salinity unit. (Panels A, B, and C) Long-term trends in salinity throughout the Chesapeake Bay. The mainstem of the Chesapeake Bay shows long-term “freshening” or decreasing salinity trends due to increased streamflow from the Susquehanna River over recent decades. In contrast, we observed increasing salinity trends in many of the tidal rivers flowing into the Chesapeake Bay during the same time period. (Panels D, E, F) There have been increasing long-term salinity trends along the Potomac, Rapahannock, York, and James Rivers; while examples of time series are only shown for a subset of these rivers, all monitoring stations with increasing salinity trends can be seen in shades of red on the map. The names of some of the major tributaries flowing into Chesapeake Bay are labeled on the map for geographic reference. Information about trends at each station (e.g., years of record, sample sizes, slopes, p values, and confidence intervals) can be found in Supporting Information Table S2
Fig. 12
Fig. 12
Salinization is impacting tidal freshwater rivers of the Chesapeake Bay according to an analysis of data from the EPA Chesapeake Bay Program. Tidal freshwaters of the Patuxent River estuary are becoming more salty, whereas salty portions of the lower estuary are becoming fresher. (Panels A and B) There is an increase in salinity pulses in tidal freshwaters, and there is an increase in pulses of fresher water in the saltier lower estuary. (Panels A and B) There are extreme outliers in very high specific conductance in tidal freshwater reaches, and there are extreme outliers in low specific conductance in the lower estuary due to floods and dilution events. (Panels C and D) There have been increasing long-term trends in specific conductance in the tidal freshwater Patuxent River and tidal freshwater Anacostia River. (Panels C and D) These increasing long-term trends in specific conductance are characterized by an increase in winter pulses when road salt is applied

References

    1. Abolfazli E, Strom K (2021) Deicing road salts may contribute to impairment of streambeds through alterations to sedimentation processes. ACS ES&T Water 2(1):148–155
    1. Acosta JA, Jansen B, Kalbitz K, Faz A, Martínez-Martínez S (2011) Salinity increases mobility of heavy metals in soils. Chemosphere 85(8):1318–1324 - PubMed
    1. Ahmad S (2003) Reinforcement corrosion in concrete structures, its monitoring and service life prediction––a review. Cement Concr Compos 25(4–5):459–471
    1. Aldea CM, Shah SP, Karr A (1999) Effect of cracking on water and chloride permeability of concrete. J Mater Civ Eng 11(3):181–187
    1. Almeida Júnior ES, Martínez A, Gonçalves AL, Canhoto C (2020) Combined effects of freshwater salinization and leaf traits on litter decomposition. Hydrobiologia 847:3427–3435