. 2025;27(3):99.
doi: 10.1007/s10530-025-03543-2. Epub 2025 Mar 10.

Predicting the invasiveness of alpine newts in the UK

Affiliations

Predicting the invasiveness of alpine newts in the UK

Alexandra C North et al. Biol Invasions. 2025.

Abstract

Predicting invasion risk to novel environments is essential for risk management and conservation decision making but the evolutionary lineage at which to make these predictions is often unclear. Here we predict the current suitability across the United Kingdom (UK) for the alpine newt Ichthyosaura alpestris, a species with a complex evolutionary history, a broad native range, a growing number of introduced populations and anecdotal reports of ecological consequences to native amphibian communities. We use species distribution and ecological niche modelling to predict environmental suitability of the alpine newt in the UK at both the species-level and lineage-level and to quantify evolutionary lineage niche overlap. We show good model transferability at the species-level and parts of the UK-especially central and eastern England and parts of central and northern Scotland-to be highly environmentally suitable for the alpine newt. Our findings provide evidence of environmental niche differences at the lineage-level, with the Greek lineage being distinct from most other lineages, but with low confidence in maxent predictions for the Greek, Balkan and Italian lineages due to high levels of extrapolation. In contrast, the niche of the UK records appear to share the same niche as the Central lineage. We find 66% of currently known alpine newt records to fall within areas predicted to be environmentally suitable at the species-level, providing a series of testable hypotheses to better understand the invasion ecology of this species in the UK.

Supplementary information: The online version contains supplementary material available at 10.1007/s10530-025-03543-2.

Keywords: Alpine newt; Ichthyosaura alpestris; Invasive; Maxent; Niche; Species distribution modelling.


Conflict of interest statement

Conflict of interestThe authors have no relevant financial or non-financial interests to disclose.

Figures

Fig. 1
Fig. 1
Rarefied Ichthyosaura alpestris occurrence records utilised in this study, coloured by evolutionary lineage as geographically defined by Recuero et al. (2014), alongside UK records
Fig. 2
Fig. 2
Spearman rank correlation coefficient matrix for the 9 environmental variables included in the final analyses. Values closer to zero depict low correlation, and yellow depicts complete correlation
Fig. 3
Fig. 3
ae Cloglog index of occurrence probability shows predicted environmental suitability across the UK based on the environmental niche for all modelled lineages combined (species-level) as well as each lineage separately. Warmer colours depict higher environmental suitability and colder colours depict lower environmental suitability f–j MESS maps show regions vulnerable to extrapolation and areas therefore that we can be less confident in predictions. Shades of grey represent areas of extrapolation, with darker greys representing higher degrees of extrapolation. Areas of blue represent values above zero which represent no extrapolation. Known UK populations (rarefied to 1km to ensure independence) are overlayed as open circles
Fig. 4
Fig. 4
Most different variable to show what is driving main environmental differences between native and invaded range a Species-level, b Central, c Balkan d Greek and e Italian lineage. Open circles show known UK alpine newt populations
Fig. 5
Fig. 5
Predicted presence/absence map based on the top ranking optimised and fine-tuned model with the maximum training sensitivity plus specificity threshold for a Species-level, b Central c Balkan d Greek and e Italian lineage analysis. Grey areas are predicted suitable, red areas not suitable, and open circles are known alpine newt records
Fig. 6
Fig. 6
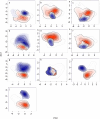
Differences in non-analogous environmental space between a Central [red] vs Balkan [blue] lineage b Central [blue] vs Greek [red] lineage c Central [blue] vs Italian [red] lineage d Central [red] lineage vs UK records [blue] e Balkan [blue] vs Greek [red] lineage f Balkan [blue] vs Italian [red] lineage g Balkan [red] lineage vs UK [blue] records h Greek [blue] vs Italian [red] lineage i Greek [red] lineage vs UK [blue] records j Italian [red] lineage vs UK [blue] records. Darker colours depict areas where the specified environmental space is more abundant, and lighter colours less abundant. Grey lines show the environmental space of environment 1 (linked to the red lineage). The black lines are isopleths that represent differences between the environmental space of the two lineages being compared
Fig. 7
Fig. 7
Differences in analogous environmental space between a Central [red] vs Balkan [blue] lineage b Central [blue] vs Greek [red] lineage c Central [blue] vs Italian [red] lineage d Central [red] lineage vs UK [blue] records e Balkan [blue] vs Greek [red] lineage f Balkan [blue] vs Italian [red] lineage g Greek [blue] vs Italian [red] lineage. Darker colours depict areas where the specified environmental space is more abundant, and lighter colours less abundant. Grey lines show the environmental space of environment 1 (linked to the red lineage). The black lines are isopleths that represent differences between the environmental space of the two lineages being compared

References

    1. Allouche O, Tsoar A, Kadmon R (2006) Assessing the accuracy of species distribution models: prevalence, kappa and the true skill statistic (TSS). J Appl Ecol 43:1223–1232. 10.1111/j.1365-2664.2006.01214.x
    1. Araújo MB, Pearson RG (2005) Equilibrium of species’ distributions with climate. Ecography (Cop) 28:693–695. 10.1111/j.2005.0906-7590.04253.x
    1. Araújo MB, Peterson AT (2012) Uses and misuses of bioclimatic envelope modeling. Ecology 93:1527–1539. 10.1890/11-1930.1 - PubMed
    1. Arntzen J, Denoël M, Kuzmin S, et al (2009) Ichthyosaura alpestris. the IUCN Red List of Threatened Species 2009. In: IUCN
    1. Arntzen JW, King TM, Denoël M et al (2016) Provenance of Ichthyosaura alpestris (Caudata: Salamandridae) introductions to France and New Zealand assessed by mitochondrial DNA analysis. Herpetol J 26:49–56

LinkOut - more resources