. 2025 Mar 8;5(1):vbaf013.
doi: 10.1093/bioadv/vbaf013. eCollection 2025.

A unified hypothesis-free feature extraction framework for diverse epigenomic data

Affiliations

A unified hypothesis-free feature extraction framework for diverse epigenomic data

Ali Tuğrul Balcı et al. Bioinform Adv. .

Abstract

Motivation: Epigenetic assays using next-generation sequencing have furthered our understanding of the functional genomic regions and the mechanisms of gene regulation. However, a single assay produces billions of data points, with limited information about the biological process due to numerous sources of technical and biological noise. To draw biological conclusions, numerous specialized algorithms have been proposed to summarize the data into higher-order patterns, such as peak calling and the discovery of differentially methylated regions. The key principle underlying these approaches is the search for locally consistent patterns.
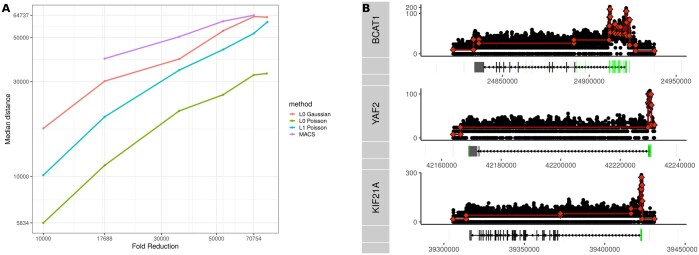
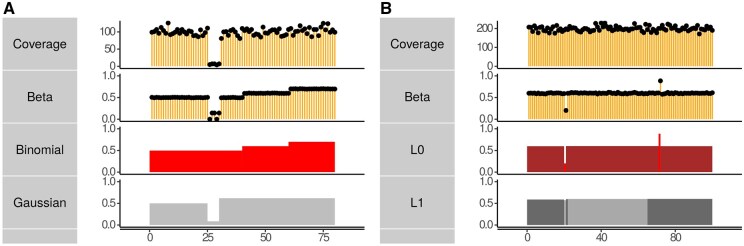
Results: We propose L 0 segmentation as a universal framework for extracting locally coherent signals for diverse epigenetic sources. L 0 serves to compress the input signal by approximating it as a piecewise constant. We implement a highly scalable L 0 segmentation with additional loss functions designed for sequencing epigenetic data types including Poisson loss for single tracks and binomial loss for methylation/coverage data. We show that the L 0 segmentation approach retains the salient features of the data yet can identify subtle features, such as transcription end sites, missed by other analytic approaches.

Availability and implementation: Our approach is implemented as an R package "l01segmentation" with a C++ backend. Available at https://github.com/boooooogey/l01segmentation.


Conflict of interest statement

None declared.

Figures

Figure 1.
Figure 1.
(A) Binomial, Gaussian, and Poisson L0 segmentation execution times are plotted in log-space (both x and y) with respect to various segment lengths. The data are simulated using the corresponding probability distributions. Even though the theoretical worst-case complexity of the algorithm is O(n2), in practice, the execution time scales linearly with the length of the input. (B and C) Comparison of the running time of our proposed method against similar approaches. CROCS is used for epigenetic data. PELT is the algorithm used in the Yokoyama et al. approach for segmenting methylation data. (D) To estimate how long it would take for the methods to segment the entire Hg38 we benchmarked the methods on a 300KB segment and multiplied the results with 10 000. This likely underestimates both CROCS’ and PELT’s actual execution time.
Figure 7.
Figure 7.
Comparing L0 to L1 with binomial error on real WGBS data with different fold compression computed on the chromosome level. The reported differentially methylated region is highlighted. (A) POU5F1 expressing cell line, H1. (B) The non-expressing contrasting cell-line, IMR90. Note that unlike Fig. 6, fold compression is fixed at the chromosome level, and consequently the number of segments in this region is not constant across L0 and L1.
Figure 8.
Figure 8.
Comparison of L0 and L1 segmentations with binomial error in preserving the characteristics of genomic regions, namely “TssA” (TSS) and “Tx” (Transcript) regions identified by ChromHMM, in two cell lines: H1 and IMR90.
Figure 2.
Figure 2.
Poisson L0 segmentation is applied to ChIP-seq assays of CTCF, RNA Polymerase II, and three H3 histone modifications. The hyperparameter (λ) is chosen automatically using cross-validation.
Figure 3.
Figure 3.
Comparison of L0 Poisson (circle), L1 Poisson (triangle), and fixed size binning (square) for the various compression ratios on the DNase track from the H1 and IMR90 cell lines. The methods are applied on a 10M base-pair segment of Chromosome 1. We evaluated the methods using 937 peaks for H1 and 1400 peaks for IMR90 discovered by MACS within this segment. (A and B) The ratio of the mean signal within peak regions to the mean background signal after segmentation. (C and D) Maximum Jaccard Index distributions for the methods at different compression ratios. Jaccard indices are calculated between peaks and the segments discovered by the methods. (E and F) Median of the distributions shown in C and D.
Figure 4.
Figure 4.
The ratio of mean signal within ChromHMM clusters to the mean background signal after compressing the signal 10K fold using L0 Poisson (L0), L1 Poisson (L1), and fixed size binning (binned). The results are shown for DNase, H3K27ac, and H3K27me3 ChIP-seq tracks from H1 and IMR90 cell lines. (A) For all tracks and cell lines, L0 Poisson retains the information content of the signal, while L1 Poisson and binning either completely lose the structure or diminish the signal intensity. (B) A closer inspection highlights the efficiency of L0 Poisson in preserving the integrity of epigenetic signals after compression.
Figure 5.
Figure 5.
(A) Comparison of the performance of different data reduction approaches on the transcript end site (TES) discovery task. We plot the median absolute distance to TES based on known gene models. The degree of segmentation is adjusted using lambda, while for peaks, we adjust the FDR cutoff to get a comparable number of segments. (B) Examples of segmentation tracks for selected transcripts. Highlighted regions on the gene annotations indicate MACS peaks. While the Pol II signal is often noisy outside of the promoter region, a subtle drop-off in the signal can often be observed toward the end of transcripts. In many cases, this change in signal is correctly identified by L0 Poisson segmentation.
Figure 6.
Figure 6.
Binomial L0 segmentation accurately accounts for read coverage and discovers short regions with distinct methylation rates. We compare segmentation formulations on simulated data. Coverage and methylation are shown in the first and second rows respectively. (A) Gaussian (bottom row) and binomial error segmentation (the third row) with the same number of segments. Binomial error merges low-coverage regions with their neighbors. (B) Comparing L0 (the third row) and L1 (the bottom row). The L0 penalty is more sensitive to local structure discovering the 2 CpGs simulated with different β.

References

    1. Akalin A, Kormaksson M, Li S et al. methylKit: a comprehensive R package for the analysis of genome-wide DNA methylation profiles. Genome Biol 2012;13:R87. 10.1186/gb-2012-13-10-r87 - DOI - PMC - PubMed
    1. Chen M, Lin H, Zhao H. Change point analysis of histone modifications reveals epigenetic blocks linking to physical domains. Ann Appl Stat 2016;10:506–26. - PMC - PubMed
    1. Dunham I, Kundaje A, Aldred SF et al. An integrated encyclopedia of DNA elements in the human genome. Nature 2012;489:57–74. 10.1038/nature11247 - DOI - PMC - PubMed
    1. Ernst J, Kellis M. Chromatin state discovery and genome annotation with ChromHMM. Nat Protoc 2017;12:2478–92. 10.1038/nprot.2017.124 - DOI - PMC - PubMed
    1. Gong B, Purdom E. Methcp: differentially methylated region detection with change point models. J Comput Biol 2020;27:458–71. - PubMed

LinkOut - more resources