. 2025 Sep 1;110(9):2009-2023.
doi: 10.3324/haematol.2024.286577. Epub 2025 Mar 13.

Enforcement of stem-cell dormancy by nucleophosmin mutation is a critical determinant of unrestricted self-renewal during myeloid leukemogenesis

Affiliations

Enforcement of stem-cell dormancy by nucleophosmin mutation is a critical determinant of unrestricted self-renewal during myeloid leukemogenesis

Maria Elena Boggio Merlo et al. Haematologica. .

Abstract

Mutations in the NPM1 gene (NPMc+) and in the FLT3 gene (FLT3-ITD) represent the most frequent co-occurring mutations in acute myeloid leukemia (AML), yet the cellular and molecular mechanisms of their co-operation remain largely unexplored. Using mouse models that faithfully recapitulate human AML, we investigated the impact of these oncogenes on pre-leukemic and leukemic hematopoietic stem cells (HSC), both separately and in combination. While both NPMc+ and Flt3-ITD promote the proliferation of pre-leukemia HSC, only NPMc+ drives extended self-renewal by preventing the depletion of the quiescent HSC pool. Quiescent HSC have a dynamic equilibrium between dormant and active states, which respectively support self-renewal and regenerative hematopoiesis. Transcriptional profiling of these dormant and active states revealed that not only does NPMc+ stimulate the transition from dormancy to activity, but it also reinforces the dormant state, thereby ensuring the replenishment of dormant HSC. Intriguingly, the co-expression of NPMc+ and Flt3-ITD engenders a novel phenotypic state within quiescent HSC, whereby dormancy and activity co-exist within a single cell. We posit that this unique state fuels the in vivo expansion of self-renewing HSC and facilitates the rapid selection of leukemia-initiating cells. Pharmacological inhibition of the dormancy-related TGFβ1 pathway effectively reduces the self-renewal capacity of leukemia stem cells and extends survival in our mouse models. Collectively, these findings demonstrate that enforcement of HSC dormancy is a critical determinant of unrestricted self-renewal during leukemogenesis and, as such, represents a compelling target for the development of novel anti-leukemic therapies.


Figures
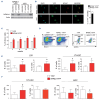
Figure 1.
Figure 1.
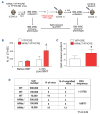
NPM1c+ expression promotes pre-leukemic hematopoietic stem cell expansion. (A) Western Blot analysis of NPMc+ expression in the YFP+ (Y+) and YFP- (Y-) fractions after FACS sorting of bone marrow-mononuclear cells (BM-MNC) isolated from NPMc+/YFP and YFP mice and treated in vitro with the TAT-CRE. Lysates from the OCI-AML3 NPMc+ cell line were used as positive control. Actin was used as a loading control. (B) (Left) Representative confocal images of anti-NPMc+ immunofluorescence analyses performed on YFP+ cells sorted from NPMc+/YFP and YFP mice. Blue: DAPI; green: YFP; red: NPMc+ (original magnification x256, scale bar 10 μm). (Right) Percentage of NPMc+ cells within the YFP+ sorted population. (C) Competitive bone marrow transplant (BMT, 1:1 ratio): percentage of CD45.2+ donor-derived YFP+ cells in the peripheral blood (PB) of transplanted mice at the indicated time points. N=3-5 mice per cohort, graph representative of one of 3 independent experiments (*P<0.05). (D) Representative FACS gating schemes for the analysis of different hematopoietic populations in the BM of YFP and NPMc+/YFP animals. (Left) Gating of the LSK (c-Kit+, Sca-1+, Lin-) population within lineage negative cells. (Right) Gating of long-term hematopoietic stem cells (LT-HSC) (Lin-, Sca-1+, cKit+, CD34-, FLK-), short-term HSC (ST-HSC) (Lin-, Sca1+, cKit+, CD34+, FLK-), and multi-potent progenitors (MPP) (Lin-, Sca1+, cKit+, CD34+, FLK+) within LKS cells. (E and F) Quantification of the subpopulation depicted in (D): numbers (per million of BM-MNC, left panels) and percentages (right panels) of LSK in the Lin- population (E, left panel) and LT-HSC (E, right panel). ST-HSC (F, left panel) and MPP (F, right panel) in the LSK population, determined by FACS analyses in NPMc+/ YFP and YFP BM-MNC. N=3-5 mice per cohort; graph representative of one of 4 independent experiments (*P<0.05).
Figure 2.
Figure 2.
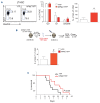
NPM1c+ expression promotes pre-leukemic hematopoietic stem cell self-renewal. (A) Self-Renewal assay and limiting number bone marrow transplantation (BMT) experimental scheme: YFP/CRE and NPMc+/CRE/YFP recombined bone marrow-mononuclear cells (BM-MNC) have been FACS-analyzed, sorted, and transplanted in recipient mice. After four months (mth), the BM has been collected, FACS-analyzed, and re-transplanted in a limiting dilution assay. (B) Number of long-term hematopoietic stem cells (LT-HSC) in one million BM-MNC derived from 4-OH-tamoxifen (4-OHT)-treated NPMc+/YFP and YFP mice, before (Input) and 4 mth after BMT. N=5 mice per cohort, graph representative of one of 2 independent experiments (*P<0.05). (C) Self-renewal quotient calculated as the ratio between the number of donor LT-HSC in the total BM of recipient mice at 4 mth post BMT, and the numbers of transplanted LT-HSC (*P<0.05). (D) Limiting BMT assay using different amounts of YFP+ FACS-sorted BM-MNC from NPM1c+/YFP or YFP mice (4 mth after the first BMT). Engrafted animals are defined as recipients with >0.1% donor-derived PB cells, 4 mth post BMT. The frequency of functional HSC (Competitive Repopulation Units, CRU) was calculated with the ELDA software. Mean±Standard Deviation values are shown. Unpaired Student t test has been applied and significant P values are reported. d: days.
Figure 3.
Figure 3.
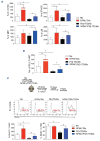
NPM1c+ expression preserves hematopoietic stem cell quiescence. (A) (Left) Representative plots showing the FACS gating strategy for the cell cycle analysis of long-term HSC (LT-HSC), based on Hoechst/Ki67 double staining. (Middle) Percentage of LT-HSC in the different cell-cycle phases determined by FACS analyses. N=4 animal/group (*P<0.05). (Right) Numbers (per million of bone marrow-mononuclear cells, BM-MNC) of quiescent (G0) LT-HSC in the same animal cohorts. (B) (Top) Schematic representation of the experimental approach to quantitate BrdU+ label retaining cells (LRC). (Bottom) Numbers of 5-Bromodeoxy-uridine (BrdU)+ LR LT-HSC per million of BM-MNC detected at the end of the chase period. N=4 animals/group, graph representative of one of 2 independent experiments (*P<0.05). (C) Kaplan-Meyer survival curve of YFP and NPMc+/YFP mice weekly treated with 5-fluorouracil (5-FU; N=8 animals per cohort, graph representative of one of 2 independent experiments). Reported P value was calculated with the log rank test. mth: months.
Figure 4.
Figure 4.
NPMc+ expression restores numbers of total and quiescent long-term hematopoietic stem cells in Flt3-ITD mice. (A) Numbers of hematopoietic stem cells (HSC) / progenitors per million / bone marrow-mononuclear cells (BM-MNC) in Mx, NPMc+/Mx, Flt3-ITD/Mx and NP-Mc+/Flt3-ITD/Mx mice. Pool of 3 independent experiments (*P<0.05). (B) Cell cycle analysis by Hoechst/Ki67 staining: numbers per million of BM-MNC of quiescent (G0_2N/Ki67-) longterm HSC (LT-HSC). N=12 animal per cohort; pool of 4 independent experiments. (C) (Top) Experimental scheme of the 5-Bromodeoxy-uridine (BrdU) pulse-chasing retaining assay. (Middle) Gating strategy for the analyses of the BrdU retaining LT-HSC after 16 days of chasing. (Bottom) Numbers per million of BM-MNC (left) and percentages within the HSC compartment (right) of BrdU+ LT-HSC in NPMc+/ Mx (N=5), Flt3-ITD/Mx (N=5), NP-Mc+/Flt3-ITD/Mx (N=6), and control Mx-CRE (N=5) mice (*P<0.05).
Figure 5.
Figure 5.
NPM1c+ expression enforces a quiescence transcriptional program. (A and C) Gene-expression analyses of FACS-sorted YFP (Y) and NPMc+/YFP (NY) long-term hematopoietic stem cells (LT-HSC). N=4 animals per pool, 3 independent experiments. The heatmaps show the Z-scores of normalized expression values of each triplicate for homeobox genes (A) and genes involved in HSC quiescence maintenance (C); clustering using Euclidean distance and average linkage. (B and D) Gene set enrichment analysis for HSC quiescence- and proliferative-signatures in NPMc+ versus control (B), Flt3-ITD/Mx versus Mx, and NPMc+/Flt3-ITD/Mx versus Flt3-ITD/Mx (D) LT-HSC. Normalized enrichment score, P value (P), and false discovery rate (q) are indicated. (E and F) As in (A) and (C), for homeobox genes (E) and quiescence genes (F). Each column represents the average value of 2 independent experiments for Flt3-ITD/Mx; Mx and NPMc+/Flt3-ITD/Mx samples.
Figure 6.
Figure 6.
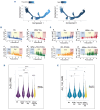
NPMc+ expression promotes hematopoietic stem cell dormancy. (A) (Left) Pseudo-time trajectory of pooled scRNA seq data (Mx, NPMc+/Mx, Flt3-ITD/Mx, NPMc+/Flt3-ITD/Mx) depicting the transition from the dormant to the active state of long-term hematopoietic stem cells (LT-HSC); pseudo-time progression is represented by the color-code dark (dormant) to light (active) blue. (Right) Color-coded normalized mean expression (NME) of the MoLO gene-signature along the pseudo-time trajectory. High MoLO expression (light blue) defined dormant state while low MoLO expression (dark blue) defined the active state. (B and C) Scatter plots of NME values of dormant (B) and active (C) genes by pseudo-time in the four samples (sig_Do and sig_Act genelists; Online Supplementary Table S2B). Colored lines are polynomial fit of data and depict the trend of the NME of each signature in each sample. (B-a and C-a) Horizontal dotted line defines the 99th percentile of the NME distribution of Mx cells in Groups 3 and 1, respectively. Cells above the thresholds are dormant HSC (dHSC) (B) or active HSC (aHSC) (C) and are framed by semi-transparent colored squares, based on group definition. (D and E) Combination of violin and overlaid box plots represent the NME distributions of: sig_Do genes (D) or sig_Act genes (E) in the dHSC or aHSC, respectively, of all samples (only for the NPMc+/Flt3-ITD/Mx sample dHSC, aHSC and daHSC are depicted separately). Statistical significance was tested with one-tailed Wilcoxon rank sum test (*P<0.05; **P<10-4; ***P<10-10).
Figure 7.
Figure 7.
Pharmacological inhibition of the TGFb pathway affects NPMc+/Flt3-ITD leukemic stem cell maintenance. (A and B) Gene set enrichment analysis enrichment plots for the TGFb signature in NPMc+/YFP long-term-hematopoietic stem cells (LT-HSC) versus YFP LT-HSC (A) or Flt3-ITD/Mx versus Mx LT-HSC and NPMc+/Flt3-ITD/Mx versus Flt3-ITD/Mx LT-HSC (B). Normalized enrichment score (NES), P value by log rank test, and false discovery rate (q) are indicated. (C) Experimental scheme: mice transplanted with a NPMc+/ Flt3-ITD acute myeloid leukemia (AML) blasts were treated with LY364947 or vehicle every other day for 16 days. At the end of the treatment 500,000 blasts were purified and re-transplanted in secondary recipient mice. (D) Percentage of control or LY364947-treated blasts (CD45.2+) in the peripheral blast (PB) of transplanted (CD45.1+) mice. N=5 animals per group. (E) Kaplan-Meier survival curve of mice transplanted with LY364947-treated or control blasts. N=5 animals per group. (F) Combination of violin and overlaid box plots representing the distributions of TGF/31 expression in scRNAseq data set for HSC-like or progenitor-like blasts coming from human AML samples. (Left) All samples (N=16) have been considered regardless of the genotype. (Center) Only the samples carrying the NPM mutation have been considered (N=5). (Right) Only samples with NPMwt (N=11) have been considered. Statistical significance was tested with two-sided Wilcoxon test; Confidence Interval 0.95. (G) Overall survival (left) and cumulative incidence of relapse (right) of The Cancer Genome Atlas AML patients based on the expression of TGF/31 (normalized RSEM, high≥=0.532, low<0.532). BMT: bone marrow transplant; WBC: white blood cell count.

References

    1. Welch JS, Ley TJ, Link DC, et al. The origin and evolution of mutations in acute myeloid leukemia. Cell. 2012;150(2):264-278. - PMC - PubMed
    1. Mallardo M, Caronno A, Pruneri G, et al. NPMc+ and FLT3_ITD mutations cooperate in inducing acute leukaemia in a novel mouse model. Leukemia. 2013;27(11):2248-2251. - PubMed
    1. Mupo A, Celani L, Dovey O, et al. A powerful molecular synergy between mutant nucleophosmin and Flt3-ITD drives acute myeloid leukemia in mice. Leukemia. 2013;27(9):1917-1920. - PMC - PubMed
    1. Vassiliou GS, Cooper JL, Rad R, et al. Mutant nucleophosmin and cooperating pathways drive leukemia initiation and progression in mice. Nat Genet. 2011;43(5):470-475. - PMC - PubMed
    1. Bowman RL, Busque L, Levine RL. Clonal hematopoiesis and evolution to hematopoietic malignancies. Cell Stem Cell. 2018;22(2):157-170. - PMC - PubMed

MeSH terms