. 2025 Aug 1;110(8):1758-1773.
doi: 10.3324/haematol.2024.286663. Epub 2025 Mar 13.

Bruton tyrosine kinase covalent inhibition shapes the immune microenvironment in chronic lymphocytic leukemia

Affiliations

Bruton tyrosine kinase covalent inhibition shapes the immune microenvironment in chronic lymphocytic leukemia

Daniel Medina-Gil et al. Haematologica. .

Abstract

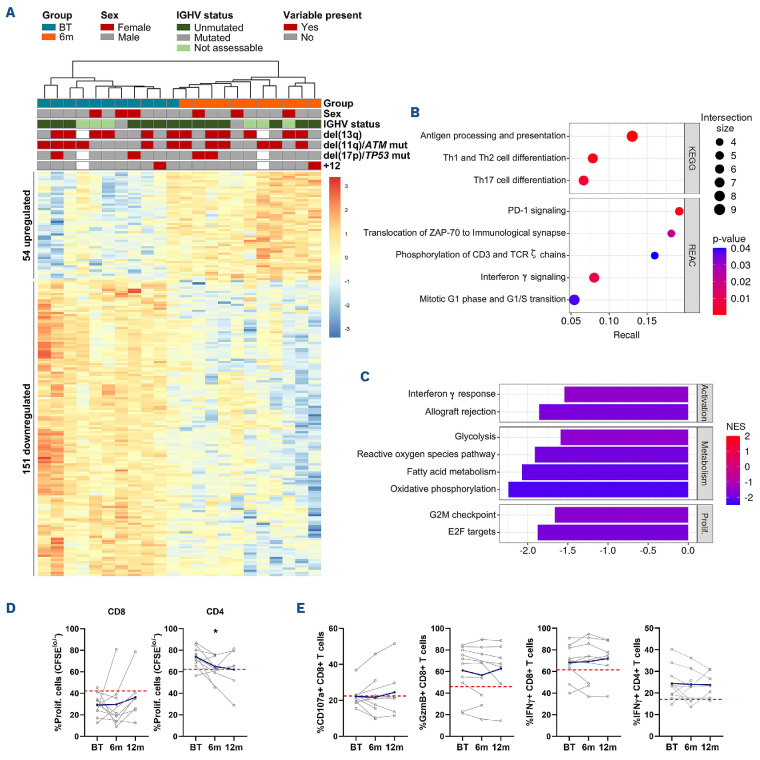
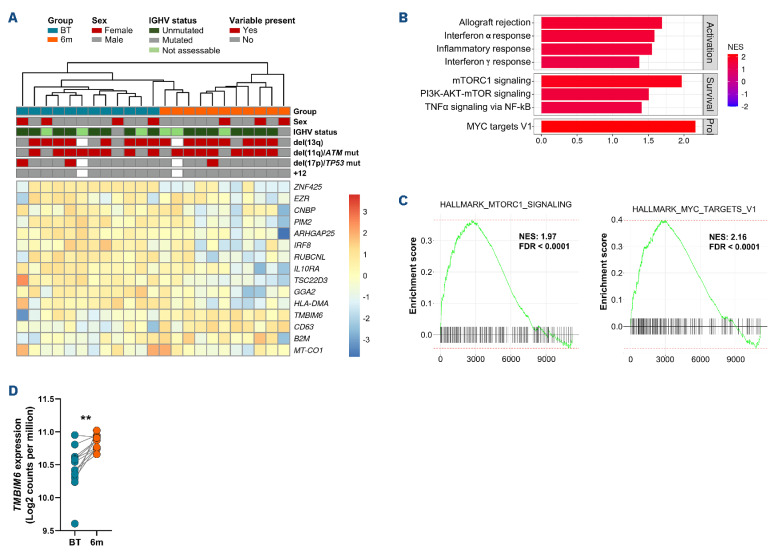
Continuous treatment with ibrutinib not only exerts tumor control but also enhances T-cell function in patients with chronic lymphocytic leukemia (CLL). We conducted longitudinal multi-omics analyses in samples from CLL patients receiving ibrutinib upfront to identify potential adaptive mechanisms to Bruton tyrosine kinase (BTK) inhibition during the first 12 months of continuous therapy. We found that ibrutinib induced a decrease in the expression of exhaustion markers and the proportion of regulatory T cells and T-follicular helper cells normalized to levels observed in healthy donors. Functionally, the expression of genes related to activation, proliferation, differentiation, and metabolism were downregulated in T cells; after in vitro stimulation, proliferation capacity was only slightly modified by ibrutinib treatment, while cytokine production was increased. In CLL cells, we observed a downregulation of immunosuppression, adhesion, and migration proteins. Adaptation at molecular level, characterized by an increase in cancer cell fraction of CLL cells with mutated driver genes, was observed in around half of the patients and was associated with retained migrative capacity towards CXCL12/CXCR4 axis. Interestingly, BTK C481S mutations were detected as early as after 6 months of treatment, particularly enriched in subsets of malignant cells retaining migrative capacity. These CLL cells with potential migrative capacity under ibrutinib also exhibited a distinct transcriptomic profile including upregulation of mTOR-AKT and MYC pathways. We identified the high expression of TMBIM6 as a potential novel independent poor prognostic factor. Of note, BIA, a TMBIM6 antagonist, induced CLL cell apoptosis and synergized with ibrutinib. In summary, our comprehensive multi-omics analysis of CLL patients undergoing ibrutinib therapy has unveiled early immunomodulatory effects on T cells and adaptative mechanisms in CLL cells. These findings can contribute to the identification of resistance mechanisms and the discovery of novel therapeutic targets.


Figures

Figure 1.
Figure 1.
Schematic representation of the multi-omics analyses of GELLC-7 clinical trial samples. BT: before treatment; PBMC: peripheral blood mononuclear cells; 1-12m: 1-12 months after treatment; DNAseq: DNA sequencing; RNAseq: RNA sequencing. CLL: chronic lymphocytic leukemia.
Figure 2.
Figure 2.
Immunophenotypic effect of ibrutinib on T cells. (A-D) Longitudinal analysis of the PD-1, CD244, CD39 and TIGIT expressions during ibrutinib treatment in CD8+ and CD4+ T cells. (E) Longitudinal analysis of the CD160 expression during ibrutinib treatment in CD8+ T cells. (F) Longitudinal analysis of the percentage of T-follicular helper (Tfh) cells defined as CXCR5+CD4+ T cells and regulatory T cells (Tregs) defined as CD25+CD127lo/- CD4+ T cells. Flow cytometry analyses included before treatment (BT) N=21, 1 month after treatment (1m) N=15, 3m N=22, 6m N=24 and 12m N=14 samples. Wilcoxon matched paired signed rank test was performed to compare statistical differences between BT and the subsequent time points. Grey lines represent the dynamics of individual patients, while the blue line represents the mean values across all patients. Red dashed line represents the mean value of age-matched healthy donors (HD) (N=10). *P<0.05; **P<0.01; ***P<0.001; ****P<0.0001.
Figure 3.
Figure 3.
Transcriptomic and functional effect of ibrutinib on T cells. (A) Clustered heatmap of the differential expressed genes (DEG) (false discovery rate [FDR]<0.05) in T cells after 6 months of ibrutinib treatment compared to before treatment (BT). (B) Dot plot of a summary of the significantly enriched terms of Kyoto Encyclopedia of Genes and Genomes (KEGG) and Reactome gene set databases from the overrepresentation analysis with the downregulated DEG. Intersection size represents the number of DEG present in a specific gene set and recall represents the intersection size divided by the number of genes of the specific gene set. (C) Summary of the significantly enriched processes (FDR<0.05) from the gene set enrichment analysis (GSEA) against Hallmarks from MSigDB. (D) Effect of ibrutinib in the percentage of proliferating CD8+ and CD4+ T cells (CFSElo/-) after 3 days of unspecific T-cell receptor (TCR) stimulation with Dynabeads Human T-Activator CD3/CD28. (E) Effect of ibrutinib on the expression of CD107a and granzyme B (GzmB) in CD8+ T cells and interferon g (IFNg) in CD8+ and CD4+ T cells upon 4 hours of PMA/Ionomycin stimuli. Wilcoxon matched paired signed rank test was performed to compare statistical differences between BT and the subsequent time points. Grey lines represent the dynamics of individual patients, while the blue line represents the mean values across all patients. Red dashed line represents the mean value of age-matched healthy donors (HD) (N=6). *P<0.05; **P<0.01; ***P<0.001; ****P<0.0001. 6m: 6 months after treatment; IGHV: immunoglobulin heavy chain variable region; NES: normalized enrichment score; Act.: activation; Prol.: proliferation; CFSE: carboxylfluorescein succinimidyl ester; 12m: 12 months after treatment.
Figure 4.
Figure 4.
Changes in the concentration of chemokines related to inflammation (CCL2, CCL3, CCL4 and CXCL10) and migration in plasma (CXCL13, CCL19 and CXCL12) (N=19). Wilcoxon matched paired signed rank test was performed to compare statistical differences between before treatment (BT) and 6 months after treatment (6m). Graphs show individual values and mean. *P<0.05; **P<0.01; ***P<0.001; ****P<0.0001.
Figure 5.
Figure 5.
Ibrutinib altered immunosuppression, adhesion, and migration proteins in chronic lymphocytic leukemia cells. (A) Longitudinal analysis of the CD200, BTLA, PD-L1 and PD-1 expressions on CLL cells during ibrutinib treatment. The percentage of PD-L1 expressing chronic lymphocytic leukemia (CLL) cells is only represented for the patients with >10% of expression at before treatment (BT). (B) Longitudinal analysis of the CD44, CD62L and CD49d expressions on CLL cells during ibrutinib treatment. (C) Longitudinal analysis of the CXCR5, CCR7 and CXCR4 expressions on CLL cells during ibrutinib treatment. (D) Representative dot plots of the proliferative population of CLL cells CXCR4dimCD5br. (E) Dynamics of the percentage of CXCR4dimCD5br cells out of CLL cells. Flow cytometry analyses included BT N=21, 1 months after treatment (1m) N=15, 3m N=22, 6m N=24 and 12m N=14 samples. Wilcoxon matched paired signed rank test was performed to compare statistical differences between BT and the subsequent time points. Grey lines represent the dynamics of individual patients, while the blue line represents the mean values across all patients. *P<0.05; **P<0.01; ***P<0.001; ****P<0.0001. MFI: mean fluorescence intensity; Dim: low expression; Br: bright i.e., high expression.
Figure 6.
Figure 6.
Molecular subclonal changes after 6 months of ibrutinib treatment in chronic lymphocytic leukemia cells with migrative capacity. (A) Migration assays of purified B cells from samples before treatment (BT) and 6 months after ibrutinib treatment (6m) of 12 chronic lymphocytic leukemia (CLL) patients were performed and analyzed by targeted DNA sequencing (targeted-DNA-seq) and bulk RNA sequencing (RNAseq). (B) Representation of the changes in cancer cell fraction (CCF) of the subclones detected by targeted-DNAseq between migrated CLL cells from BT and 6m and phylogenetic model inferred represented by Fish plots. Multiple mutations with a CCF <0.1 in the same patient were considered different subclones. (C) Changes in the percentage of specific CLL cell migration before and after ibrutinib treatment towards CXCL12/CXCR4 axis (N=12). (D) Changes of the percentage of specific CLL cell migration of patients exhibiting subclonal stability (N=5) and patients exhibiting subclonal shifts (N=7) and the difference between ibrutinib-treated samples and BT of both groups. Wilcoxon matched paired signed rank test was performed to compare statistical differences between BT and 6m. Grey lines represent the dynamics of individual patients and bars represent mean with standard error of the mean. *P<0.05; **P<0.01; ***P<0.001; ****P<0.0001.
Figure 7.
Figure 7.
Transcriptomic analysis of chronic lymphocytic leukemia cells with retained CXCR4-mediated migration. (A) Clustered heatmap of the 15 differential expressed genes (DEG) (false discovery rate [FDR] < 0.05) in chronic lymphocytic leukemia (CLL) cells with conserved CXCR4-migratory capacity under Bruton tyrosine kinase (BTK) inhibition compared to migrated cells before treatment (BT). One of the samples from the 6 months after treatment (6m) group was excluded for low quality RNA. (B) Summary of the significant enriched processes (FDR <0.05) from the gene set enrichment analysis (GSEA) against Hallmarks from MSigDB of RNA sequencing (RNAseq) of CLL cells from BT and 6m CXCL12-migrated cells. (C) GSEA plots of mTORC1 signaling and MYC Targets V1 from RNAseq of migrating cells at 6m compared to BT. (D) Changes in TMBIM6 expression in CXCL12-migrated cells. IGHV: immunoglobulin heavy chain variable region; NES: normalized enrichment score; Prol.: proliferation.
Figure 8.
Figure 8.
TMBIM6 as a novel target in chronic lymphocytic leukemia. (A) Relative cell viability of peripheral blood mononuclear cells (PBMC) from chronic lymphocytic leukemia (CLL) patients in a co-culture with UE6E7T-2 plus CD40L and CpG ODN upon 24 hours of BIA treatment. Relative cell viability was assessed by normalizing the percentage of annexin V-negative/propidium iodide-negative (AV-/PI-) cells. (B) Early apoptotic (AV+) CLL cells and T cells out of PI- cells upon 48 hours of BIA treatment in suspension culture. (C) Matrix of relative inhibition of PBMC from CLL patients at different concentrations of BIA combined with ibrutinib and HSA synergy score plots. Wilcoxon matched paired signed rank test was performed to compare statistical differences between concentrations. Graphs show individual values, mean and +/- standard error of the mean. *P<0.05; **P<0.01; ***P<0.001; ****P<0.0001. CpG ODN: CpG oligodeoxynucleotide; Pt.: patient; DMSO: dimethyl sulfoxide; HSA: highest single agent.

Similar articles

References

    1. O’Brien S, Furman RR, Coutre S, et al. Single-agent ibrutinib in treatment-naïve and relapsed/refractory chronic lymphocytic leukemia: a 5-year experience. Blood. 2018;131(17):1910-1919. - PMC - PubMed
    1. Burger JA, Barr PM, Robak T, et al. Long-term efficacy and safety of first-line ibrutinib treatment for patients with CLL/ SLL: 5 years of follow-up from the phase 3 RESONATE-2 study. Leukemia. 2020;34(3):787-798. - PMC - PubMed
    1. Herman SEM, Gordon AL, Hertlein E, et al. Bruton tyrosine kinase represents a promising therapeutic target for treatment of chronic lymphocytic leukemia and is effectively targeted by PCI-32765. Blood. 2011;117(23):6287-6296. - PMC - PubMed
    1. Ponader S, Chen S-S, Buggy JJ, et al. The Bruton tyrosine kinase inhibitor PCI-32765 thwarts chronic lymphocytic leukemia cell survival and tissue homing in vitro and in vivo. Blood. 2012;119(5):1182-1189. - PMC - PubMed
    1. de Rooij MFM, Kuil A, Geest CR, et al. The clinically active BTK inhibitor PCI-32765 targets B-cell receptor–and chemokine-controlled adhesion and migration in chronic lymphocytic leukemia. Blood. 2012;119(11):2590-2594. - PubMed

MeSH terms

LinkOut - more resources